The dominant theme for 2015 going forward is a “multi-speed and “multi-track” world awash in oil. The “multi-speed” refers to the post Great Recession, disparate economic growth rate among different countries and regions, and “multi-track” refers to the monetary policy divergence among major central banks. With the starting point at the end of the global recession led on by the financial crisis, countries have been recovering at different paces. Moreover, each country’s ability, timing and scale of implementing fiscal and monetary responses have been varied. Broadly speaking, the emerging markets at the beginning of the financial crisis had huge reserves and savings coupled with little debt. The emerging market balance sheet, both public and private, was much healthier and thus able to weather the financial crisis the best. In the case of China, its fiscal policy response was so immense that the Chinese economy bounced back very quickly. Nonetheless, the world economy is linked, and the economic performance of countries is affected by each other’s economic condition. Export-driven and dependent emerging market economies cannot expand at a faster rate if the consuming advanced economies are growing anemically. Further, the global financial crisis also shed light on the political and structural reforms needed to grow the emerging market economies on a sustainable path.
The case of the advances economies of the U.S., the European Unionand Japan was quite different. After years of easy credit, the public, corporate and private balance sheets were overleveraged and ultimately unsustainable. As the issuer of the world’s reserve currency, the U.S. was uniquely able to finance its debt with greater ease. After a significant (some may consider insufficient) and immediate fiscal stimulus coupled with an unprecedented monetary policy still in effect to this day, the U.S.economy has recovered substantially, albeit with unevenness. The speedy restructuring of the banks and the cleansing of the shadow banking system helped to restore the financial plumbing system and set the basis for recovery. The story in Europe is quite different and further complicated by the European monetary union (EMU). The housing led financial crisis exposed the weakness in the euro area. The interdependence of the banking system and the sovereigns in financing their governments, a monetary union without fiscal or banking union, and the structural differences among countries and regions exaggerated and morphed the effect of the American led financial crisis to the structural inadequacies of the EMU. The members of the EMU wanted the benefits of the monetary union whileavoiding the ownership of cross-border risks. With liquidity dried up and massive deleveraging, high debt EMU countries under pressure by the Troika (ECB, EU and IMF) elected austerity measures rather thanexpansive fiscal policies to provide a counterbalance to quickly shrinking economies. The squabbling and infighting among the EMU members almost brought the monetary union to a breaking point. Since then, the European Central Bank (ECB) has been the only body that has provided calmnessto the markets. With a lingering high unemployment rate and slowing economic activities, Europe is on the verge of recession and deflation.The world has been waiting for a massive monetary policy responsesince fiscal and structural reforms are virtually off the table.Japan is a different case. After experiencing its own housing and financial crisis and enduring two decades of mild deflation, Japan is still trying to achieve price stability and generate economic growth. Over the last two years, the Japanese government initiated the “three arrow” approach in its latest effort to bring back the animal spirit and inflate the economy. The first two arrows representing massive fiscal and monetary stimulus have been implemented,yet the third arrow of structural reform has been difficult to carry out. There are enough data points to draw opposing conclusions regarding the effectiveness of the two arrows. Only time will tell, but for now, it appears some inflation has been induced after a technical recession last year. However there is no real wage growth after a significant currency depreciation.
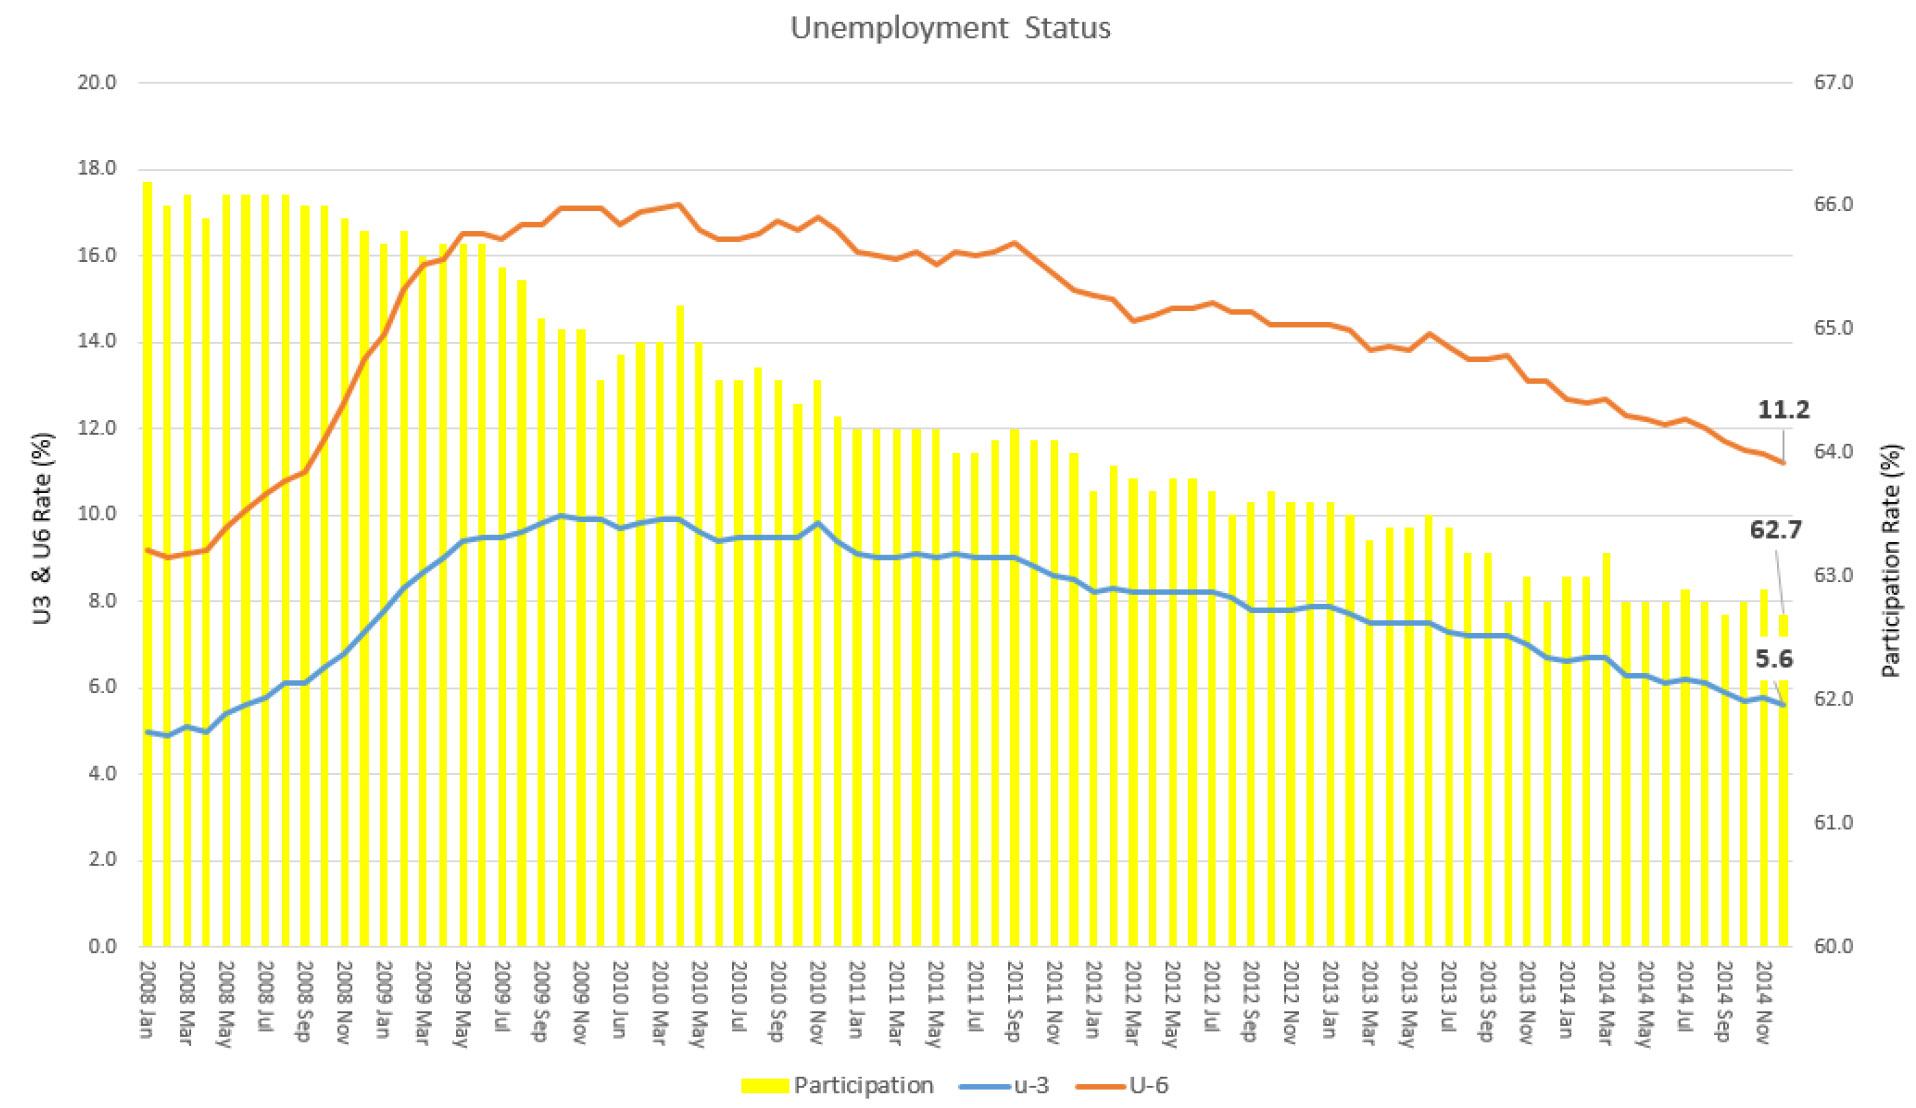
At the end of 2014, there was a growing sense of confidence in the U.S. economy.June 2015will mark the 6th anniversary since the end of the Great Recession. The U.S. financial system is at a much better place and the economy has recovered significantly from every broad measure. The Fed has ended its large scale asset purchase program known as Quantitative Easing (QE) and is now actively seeking to “lift off” from the zero bound interest rate policy. The unemployment rate (U3) is now at 5.6% and not far from “full employment” which is around a 5% to 5.5% unemployment rate. The general economy is also showing continuing improvement at an increasing rate. The Commerce Department reported that the U.S. economy expanded at a 5% seasonally adjusted annual rate in the third quarter, its strongest pace in 11 years. This followed an upwardly revised second quarter seasonally adjusted annual rate of 4.6%. As more people were employed, consumer spending accelerated as well. The University of Michigan preliminary consumer sentiment index for January rose to an 11-year high of 98.2. Happy days are back again!
We Are Almost All Back To Work
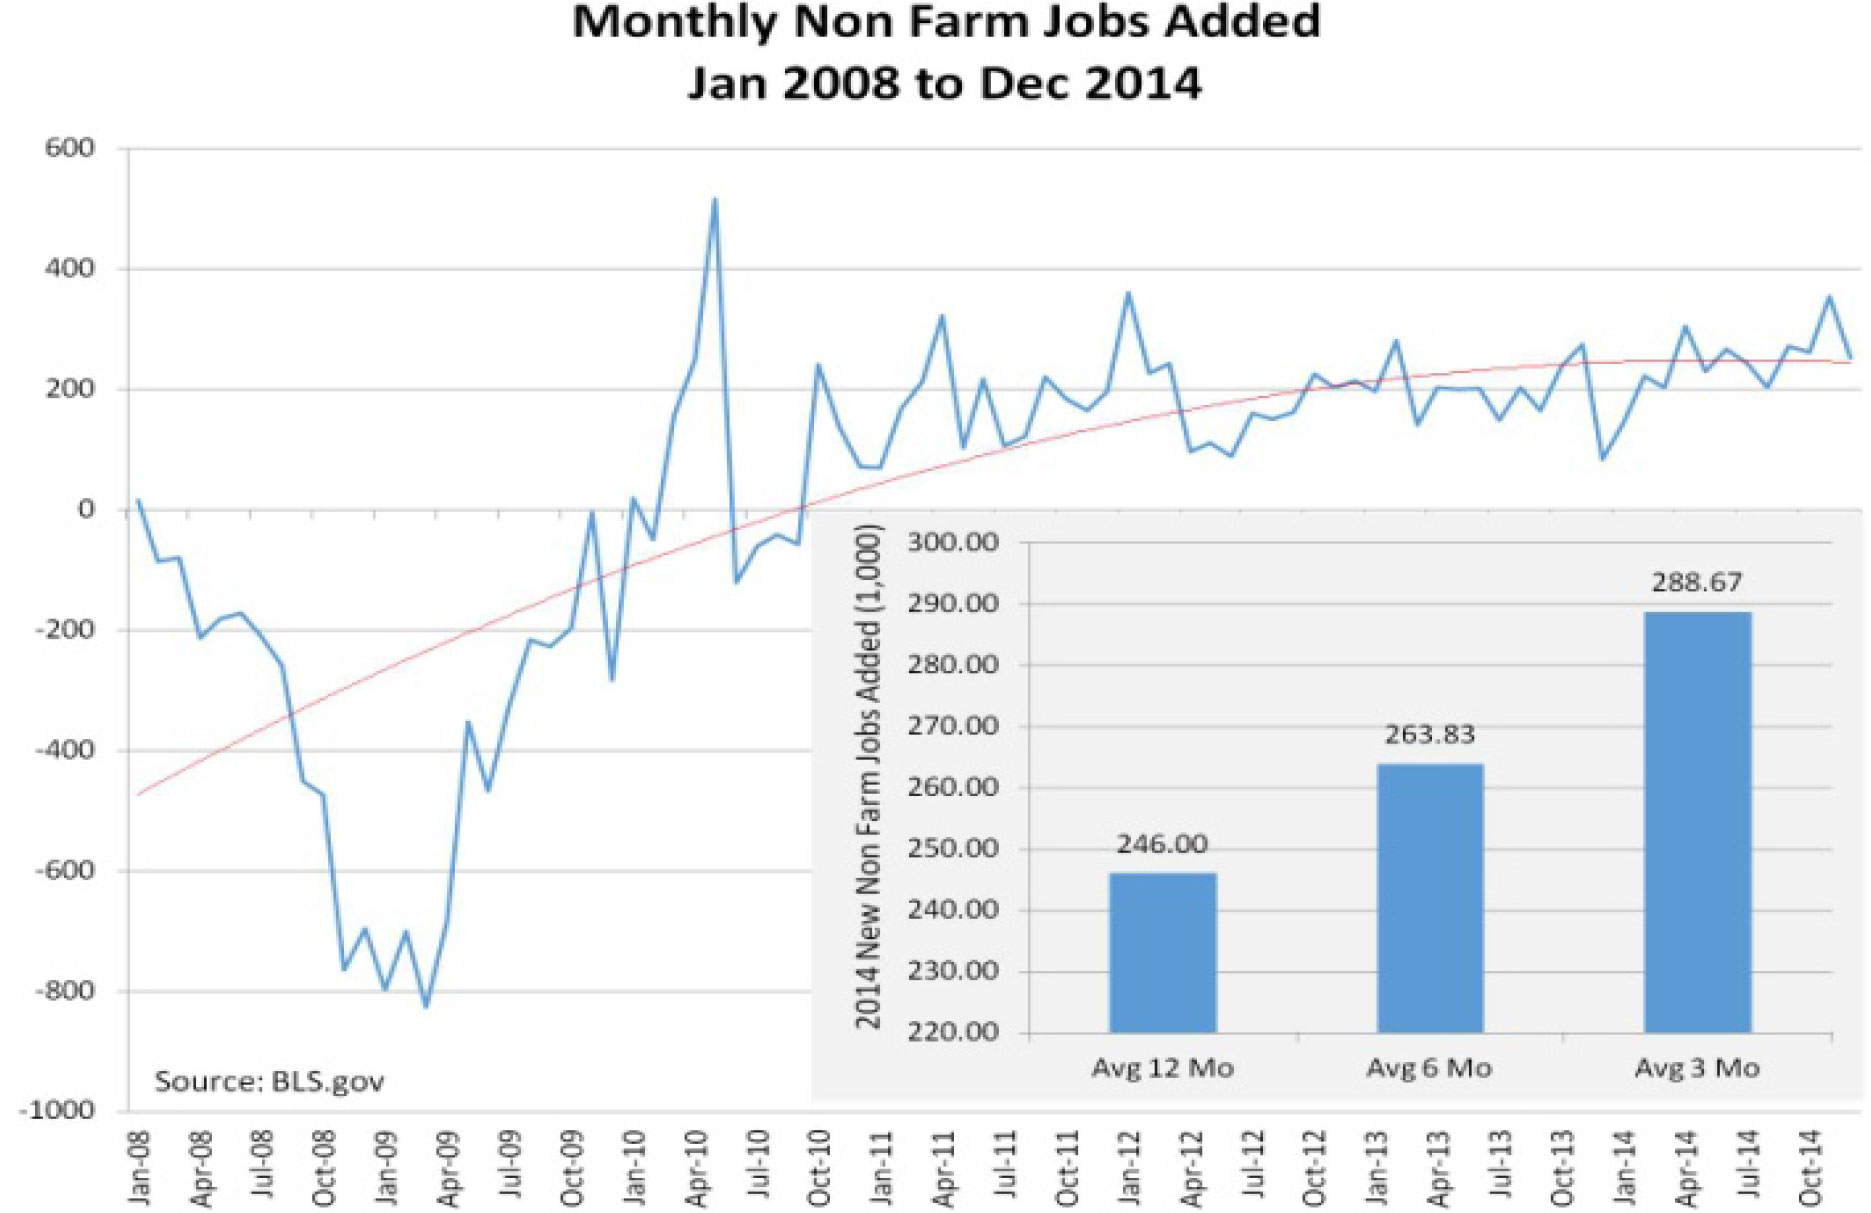
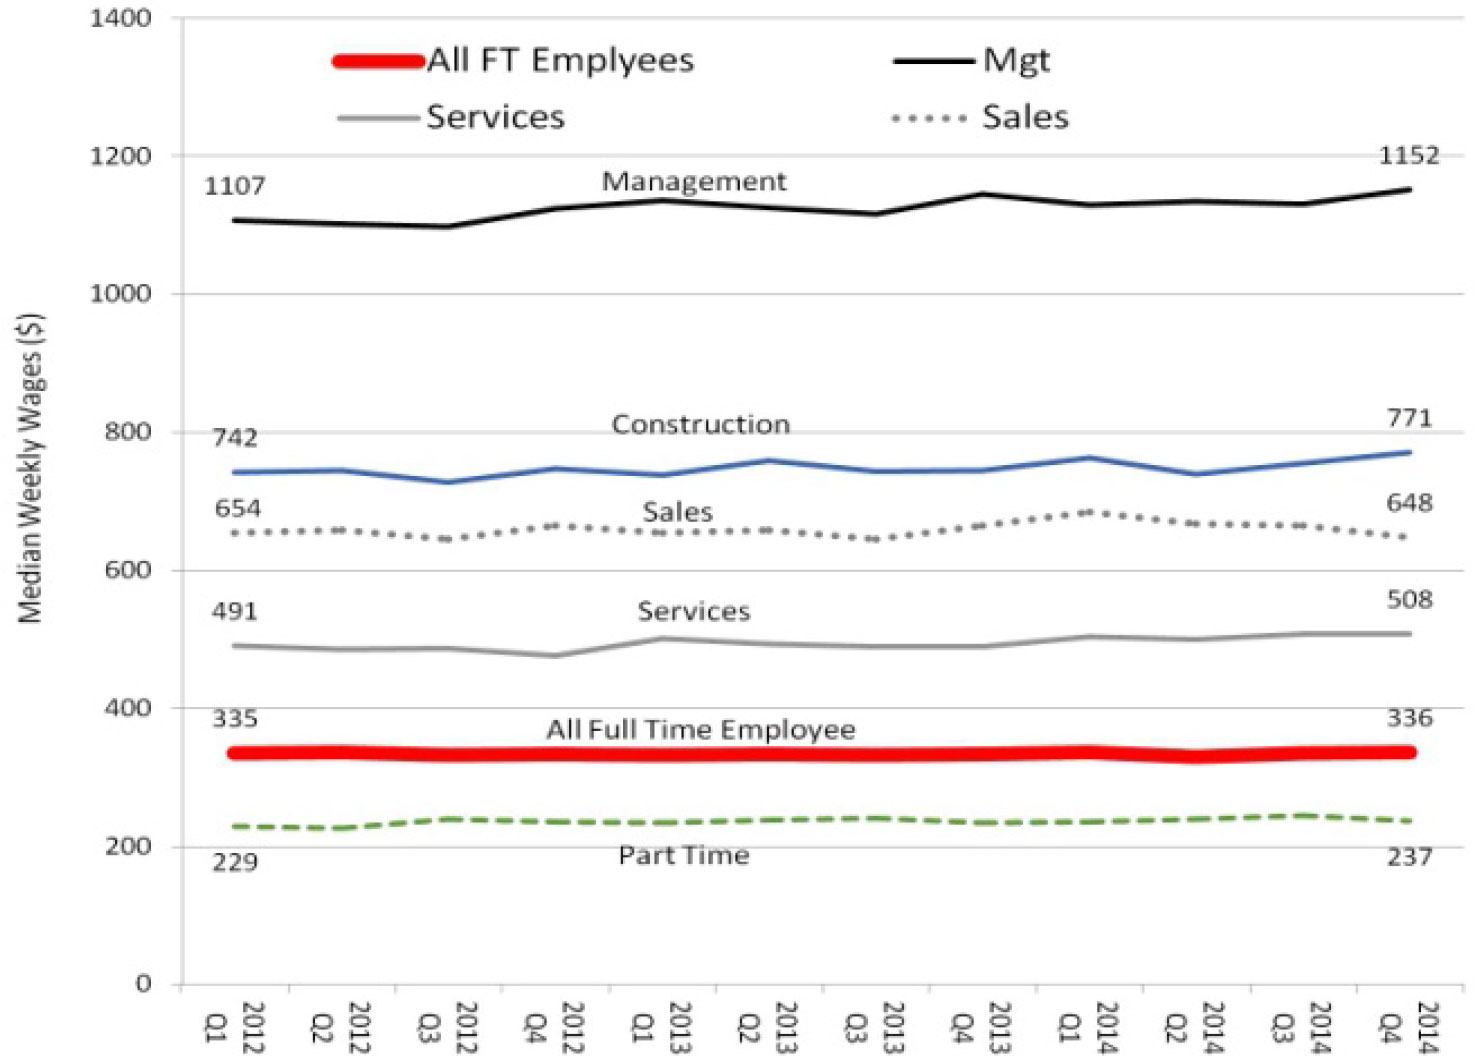
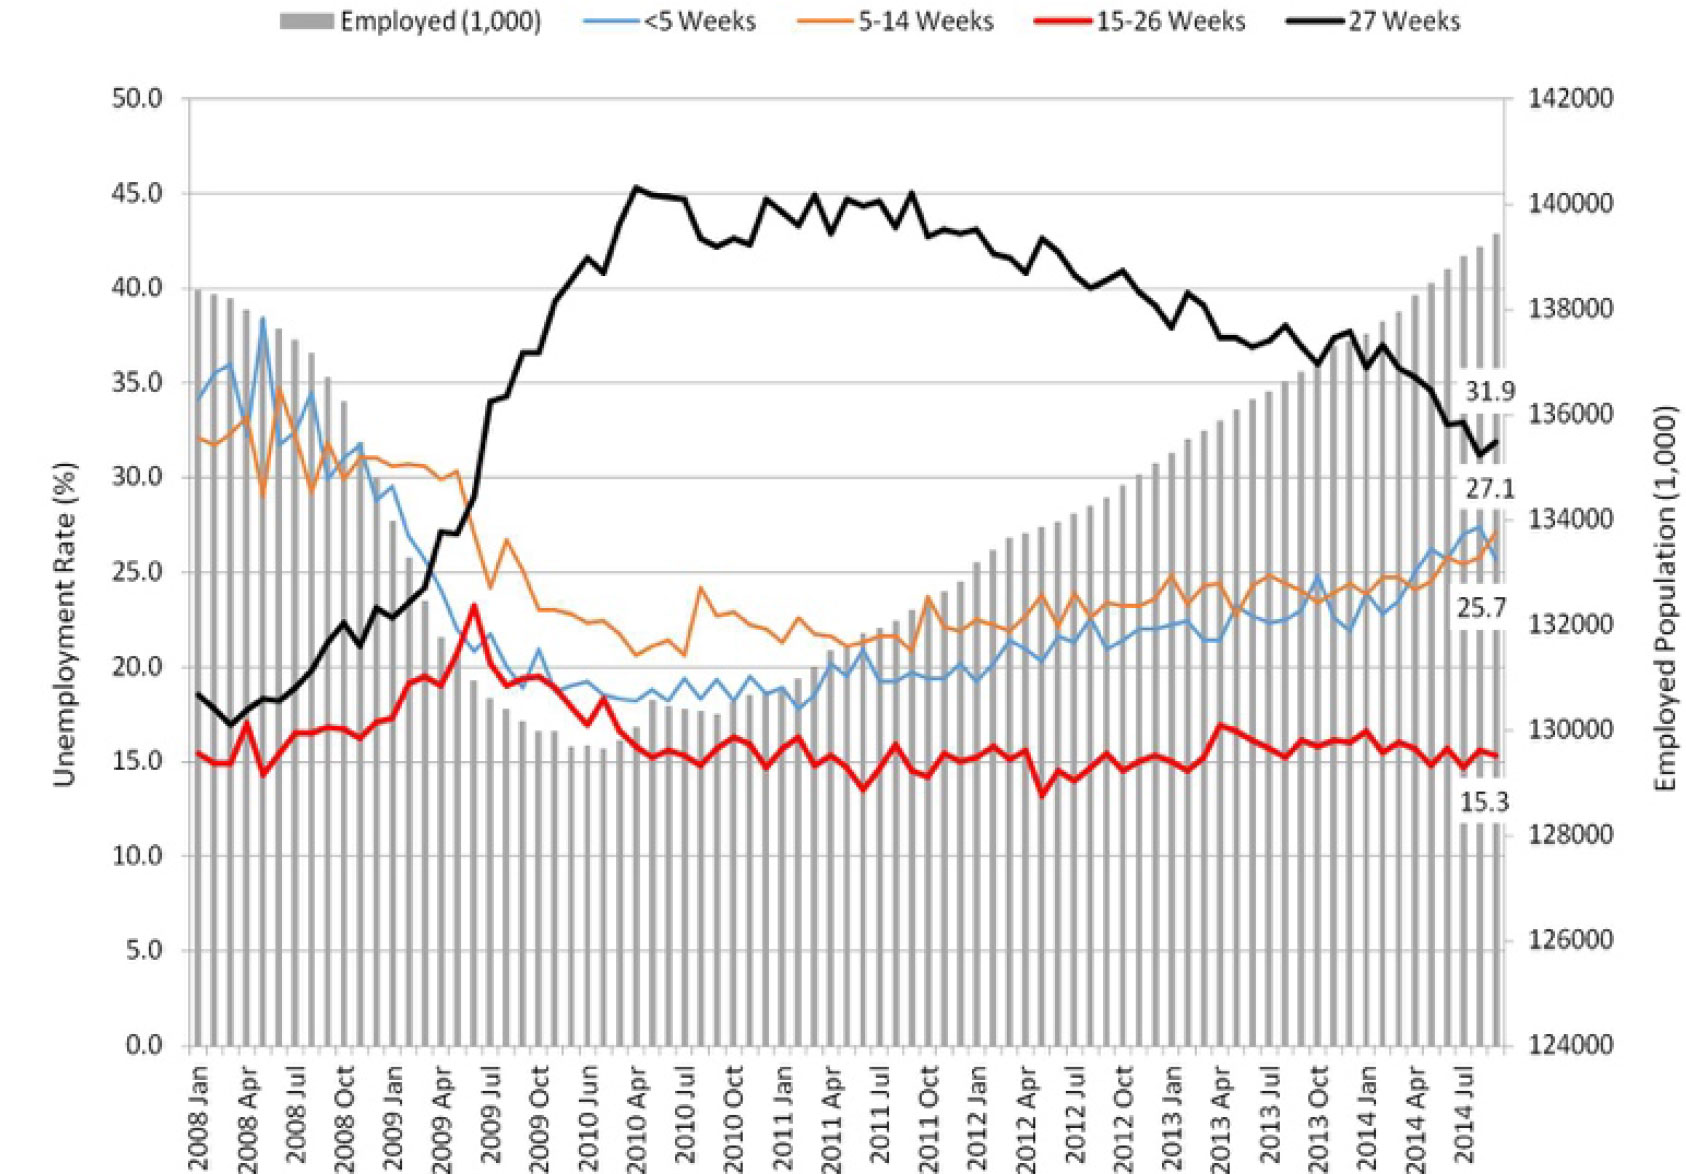
The 5.6% unemployment rate does not tell the whole story about this uneven and extended recovery. On the one hand, new jobs are created and more people are back to work. On the other hand, the long term unemployed (27 weeks or longer), the increasing unfilled job openings, the stagnant real wages and the depressed labor participation rate is painting a different picture. This set of confusing data is offering a mixed picture about the U.S. labor market. One conclusion is that a post-financial and housing crisis recovery takes longer to, and this recovery has been very uneven.
The graphs and data below illustrate the challenges underlying otherwise improving headline numbers reported month after month. Approximately the same number (5.6% each) of workers are marginally attached to the labor force and employed part time for economic reasons (U6) as workers who are unemployed (U3). Since U3 is a component of U6, as U3 declines U6 declines in sympathy, but the ratio between these two measures has been steady. In reality, many of the marginally attached to and employed part-time for economic reasons have not transitioned to full-time employment. This picture is even more cloudy when the labor participation rate continues to drop or stay at historical low levels. The fact is that those Americans leaving the workforce are simply not looking for jobs anymore (euphemistically termed “retired”) and contribute to the rapid decline in the U3 unemployment rate.
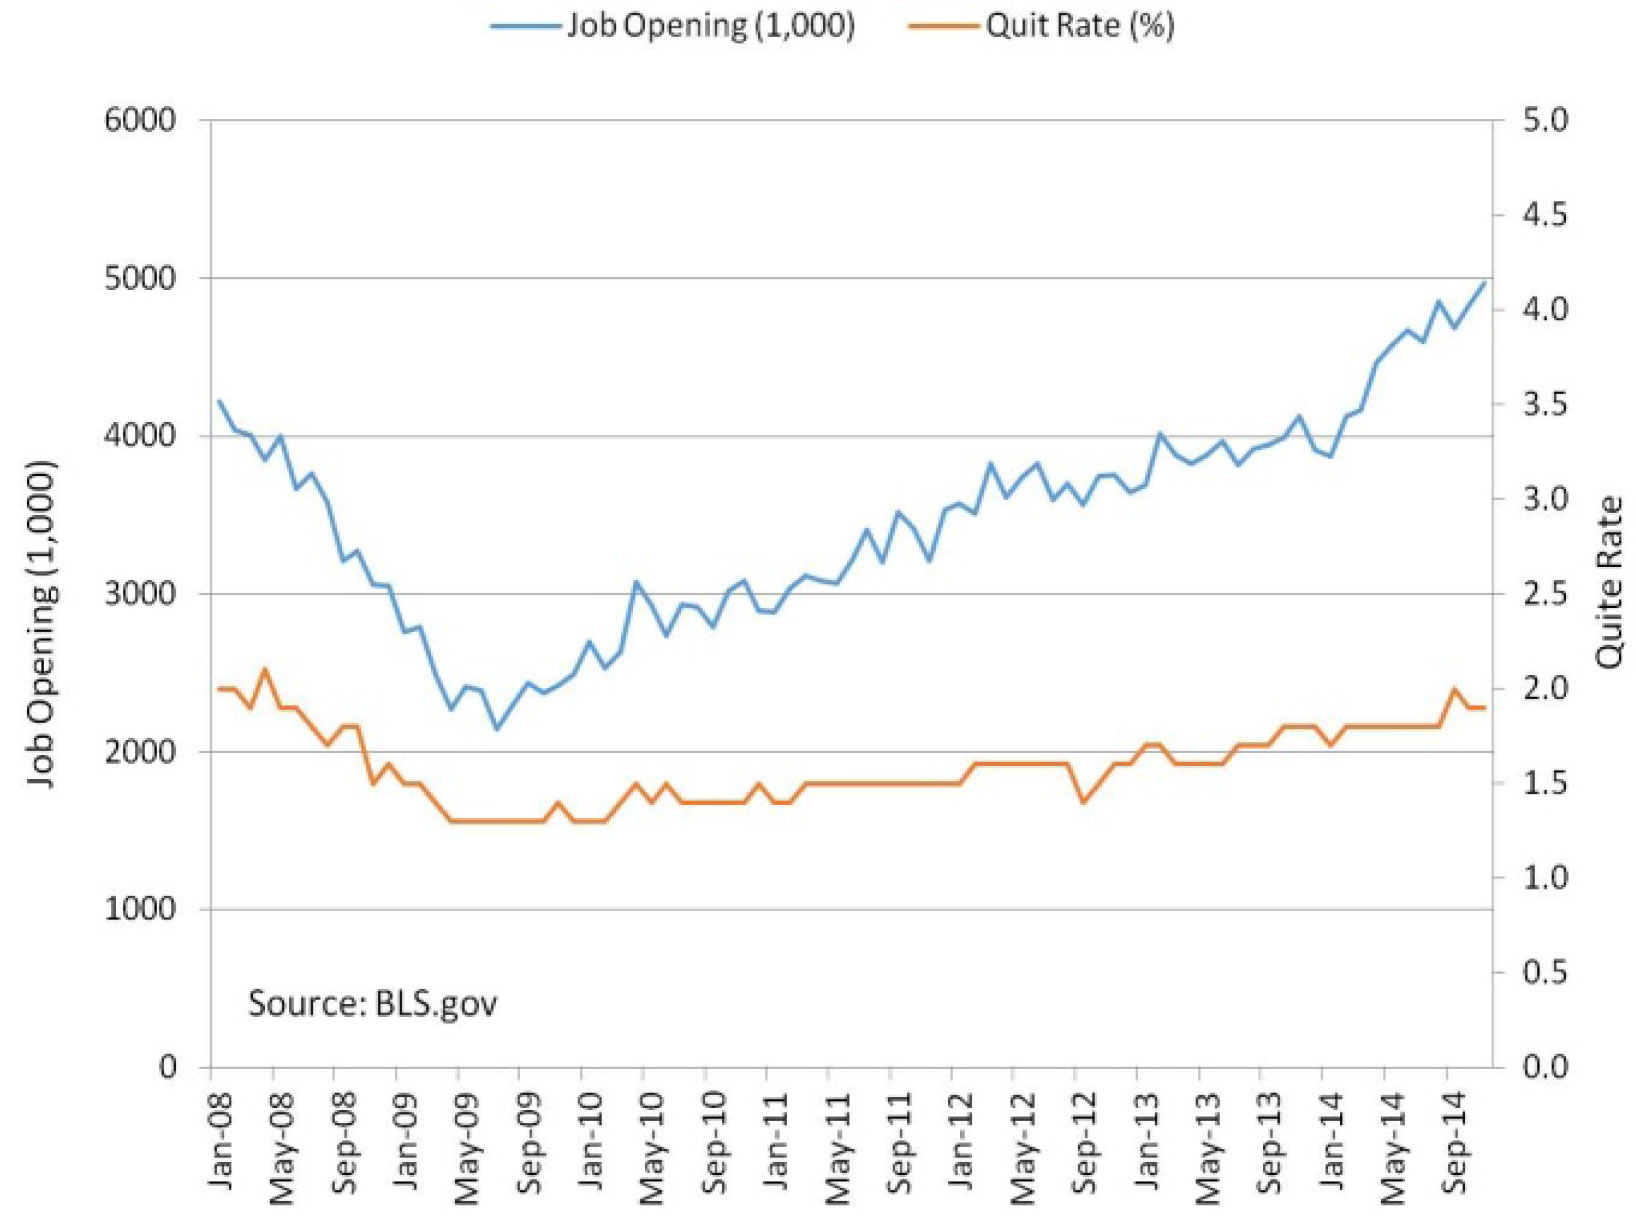
According to the DOL’s Bureau of Labor Statistics (BLS), there were 5.0 million “job openings” on the last business day of November, 2014, while “hires” (5.0 million) were little changed and “separations” (4.6 million) declined in November. Total “separations” includes quits, layoffs, discharges, and other separations. The “quit rate” (1.9%) was unchanged and the layoffs and discharges rate (1.2%) were also little changed. Quit rate is an indicator of employment confidence. An increasing quit rate can be interpreted as workers feeling more secure about their employability and willing to quit their current positions to land new jobs elsewhere. The graph below shows that the quit rate has ever so slightly inched upward since May 2009 but remained low even as job openings have progressively increased.
One explanation of this is a misalignment of skills and jobs. The new jobs created appeared unfilled by those unemployed, especially the long term unemployed. This is a troubling sign for the structurally unemployed. This may be the initial sign of the economy moving on and accepting a large segment of the long term unemployed.
The graph below shows the moving composition of the unemployed since January 2008 and the number of employed Americans in the workforce.
Based on the current progression, most economists suggest that the unemployment rate will be close to 5% by the end of this year. This would mean that the U.S. will be at full employment by historical measures. It is clear, however, that the Fed does not focus on the U3 rate in determining full employment –one of two of its mandates. The Fed continues to expressitsconcern about the slack in the labor market. Moreover, the lack of real wage growth as the U3 unemployment rate heads toward full employment is troubling. This signifies that the overall health of the American job market is not being represented by the 5.6% U3 rate.
Consuming Days Are Here Again
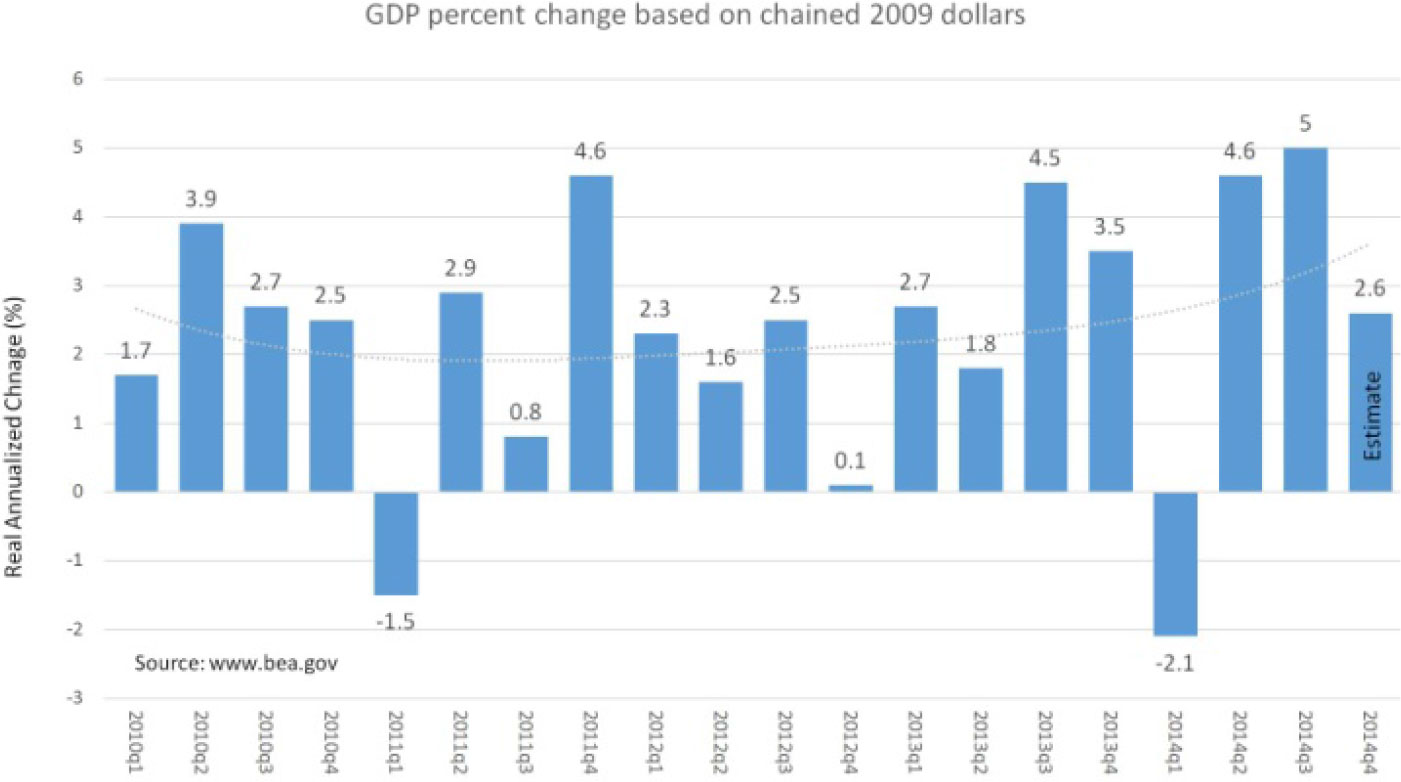
Since the negative print on the real GDP in the first quarter of 2014 due to severe winter weather, the U.S.GDP has recovered strongly at the annualized real rate of 4.6% and 5% in the second and third quarter respectively. This represents an average rate of 2.5% for the combined three quarters. The third quarter real GDP appears particularly strong.
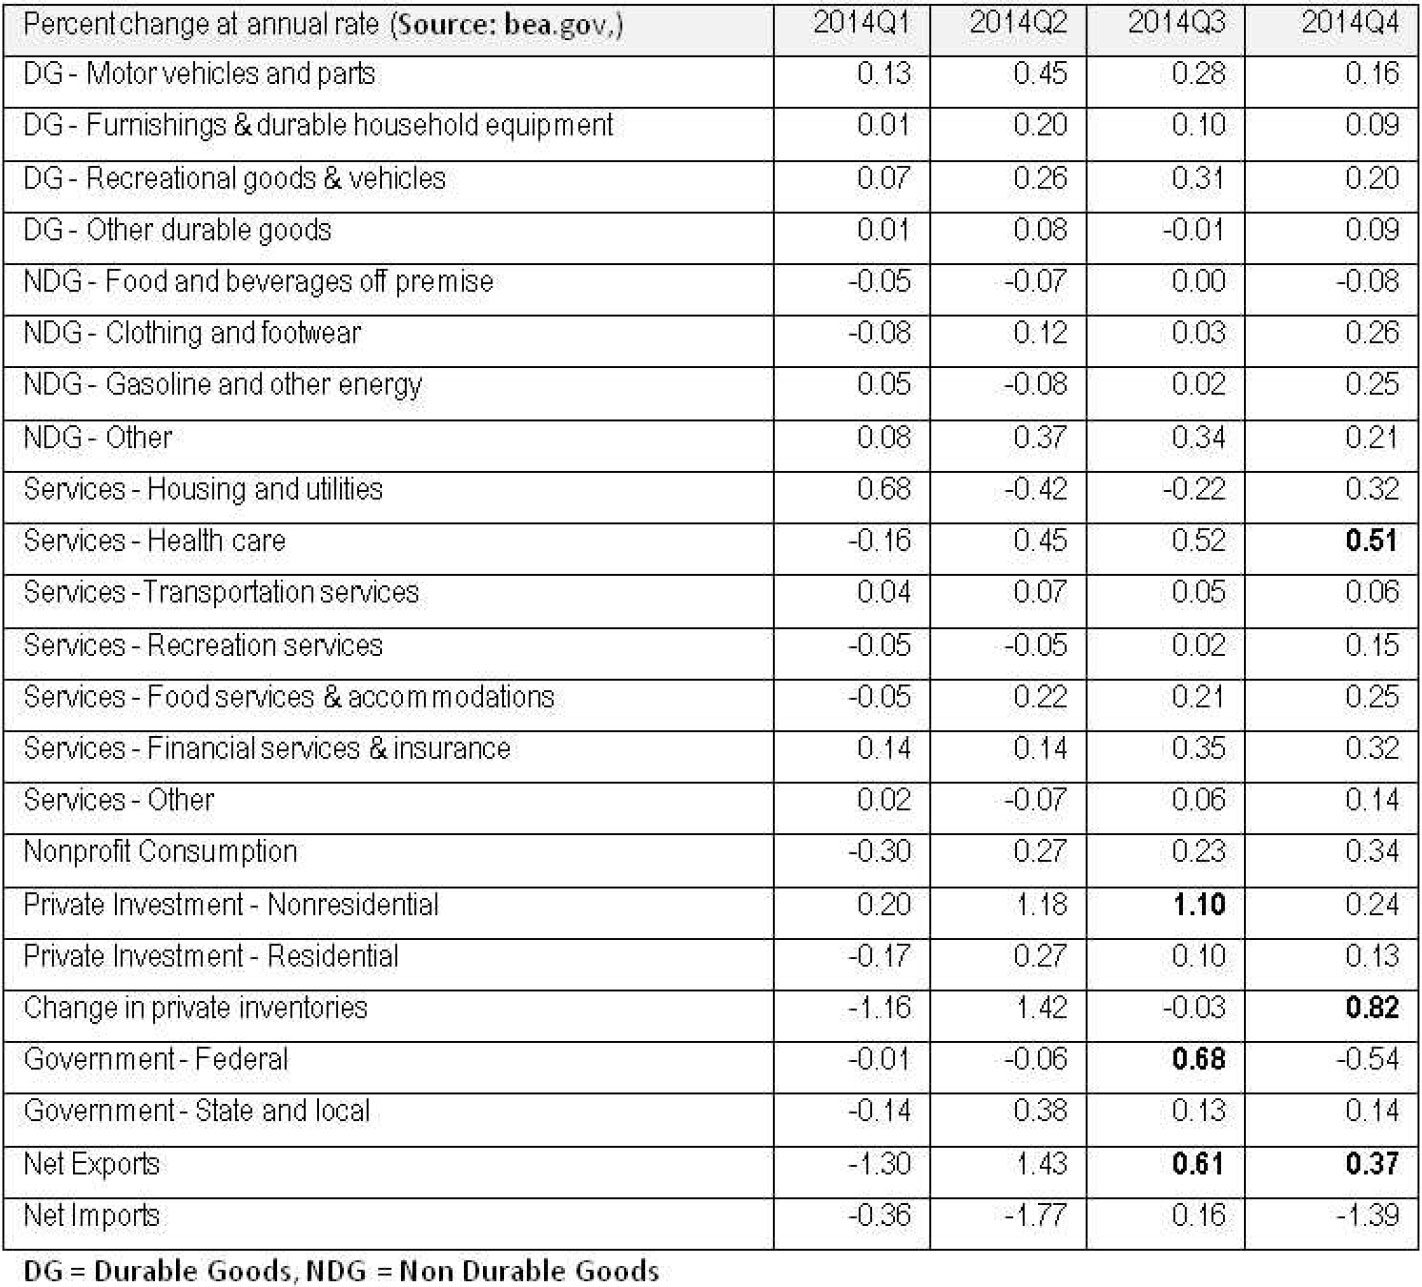
According to the latest (third) revised estimate below, the top three contributing sources came from capital spending (capex) at 1.1%, federal government defense spending at 0.68% and net export (primarily goods) at 0.61%. Spending for healthcare is also strong.The momentum of the economy has certainly slowed in the fourth quarter with the first estimate of the real GDP at 2.6% whereas the consensus was at 3%. If this estimate holds, 2014 would have a real U.S. GDP growth rate of 2.53%. This is another New Normal year with a sub 3% GDP economy.
The table above highlights the three biggest positive contributing sources to the third and fourth quarter GDP. In the third quarter, federal government spending (defense consumption), net export and non-residential private investment(cap ex spending) represented almost half of the 5% rate. In the fourth quarter, the biggest contributors were business inventory, net export (at a decelerating rate) and healthcare. Although it is disappointing to witness a drop in GDP after two months of significant improvement to fall back to 2.6%, the fundamental picture remains positive.
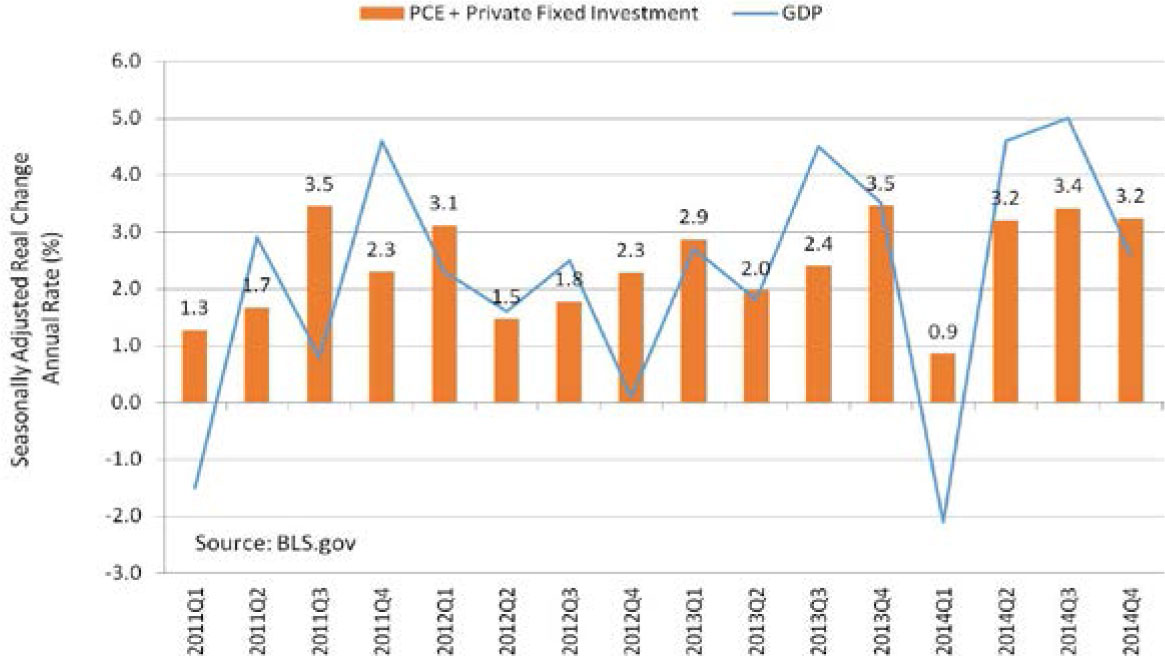
The above graph plots the “noisy” real GDP annualized rate of change since 2011Q1 and the consumer spending component of the real GDP for the same quarterly reporting periods. The consumer spending component is comprised of the Personal Consumption Expenditures (PCE) of goods and services and the gross private domestic fixed residential and non-residential investments. This excludes inventory change, government spending and trade. The fourth quarter GDP viewed from a consumer spending and investment standpoint remains strong and steady. Economists are still projecting a stronger 2015 estimating 3.00% to 3.25% in real GDP growth for the year. Employment, consumer confidence, low energy costs and an accommodative monetary policy all add to the hope that the U.S. will continue on its road to economic “normalization”.
The End of OPEC Price Control
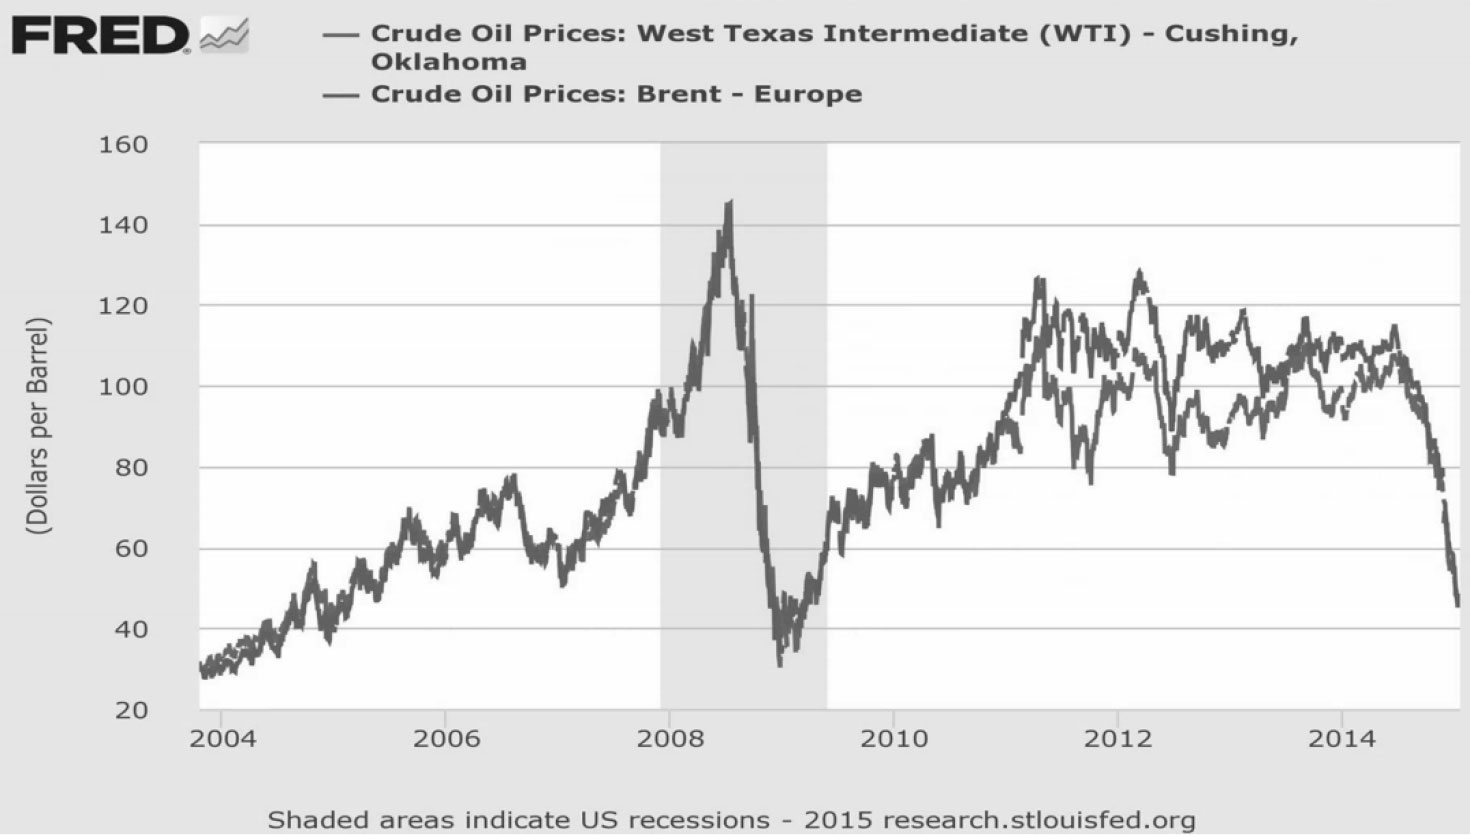
The price of oil has collapsed or at least lost 50% of its value in 2014 and continues to drift lower. This was a Black Swan event that no one foresaw or anticipated and has had enormous global consequences. The sudden drop in oil prices is the market’s response to an abundance of supply (driven primarily by the U.S.), a diminishing demand as the world slows (China and Europe) and price expectation.
The main culprit on the demand side is the global economic slowdown (minus U.S.), but more efficient use of energy and alternative fuel also added to the lower demand. The Organization of Petroleum Export Countries1 (OPEC), controlling almost 40% of world oil, has resisted in shaving its production to provide some price support and, during its last meeting in November, 2014, has so stated.The speculation for OPEC’s stance is to squeeze out the non-OPEC and high cost producers. The U.S. has the capacity and the reserve to produce oil and gas at an almost a just-in-time manner. After years of drilling and exploration, the U.S. is believed to have found more oil reserve than Saudi Arabia (producing 1/3 of the total OPEC output).Today, the U.S. isreplacing Saudi Arabia, the largest and the lowest cost producer, as the swing producer and has significant influence over the oil price.Even though the U.S. does not export oil (at least not yet), it is becoming more energy independent and reducing its oil import.
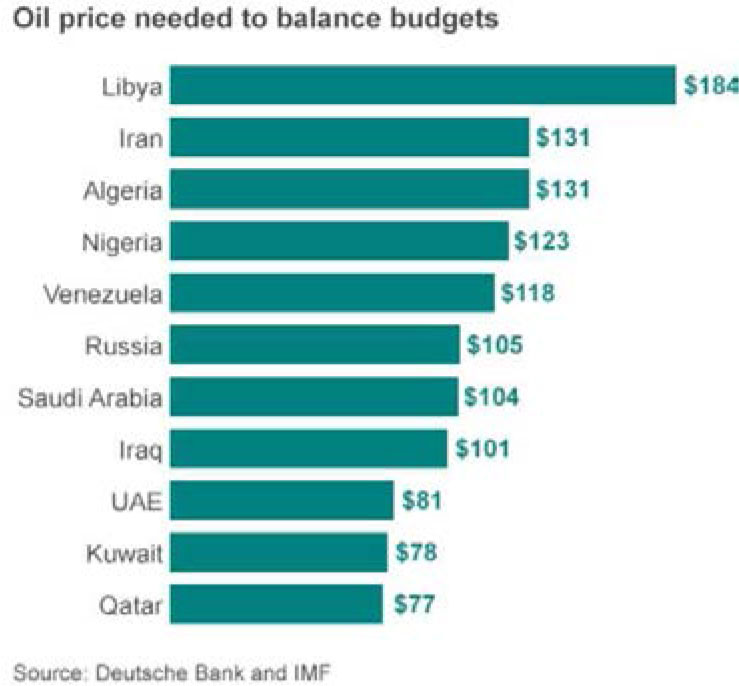
Oil exporters set their multi-year national budgets based on the price of oil. In the case of Russia, 50% of the national budget and 70% of its export income comes from oil receipts. Iranians are using oil revenue to fund the Syrian regime. Thus far, at below a $50 price per barrel, producers are still pumping oil in an effort to maintain market share. A sustained drop in oil price has significant impact on oil exporters with significant financial, economic and possibly geopolitical consequences, but not all of the OPEC members will suffer at the same rate. In the case of Saudi Arabia and countries in the Gulf, they have built up significant foreign reserves which allow them to be less impacted in the short run and to buy time to adjust to the new reality. In the case of Nigeria, Iran and Iraq, with a much greater population to support, this drop in oil prices have a more serious and immediate impact. Moreover, an exporter’s current account, balance sheet and currency reserve and value will also be negatively impacted as revenues dry with their credit ratings and ability to finance and issue debt impacted.
On the other hand, the drop in oil prices is a significant positive for oil importers. This is a huge redistribution of income and wealth from the exporters to the importers of oil. The largest importers of oil are U.S., China, India, Japan, South Korea, and Germany. Now that the U.S. is 50% energy independent and China is slowing and transforming from an investment and exporting juggernaut to a more balanced consumer driven economy, Japan and India are the biggest winners, but the benefits are distributed equally. In developed or advanced economies, the net savings from dropping oil prices goes straight to the consumer pockets, but in the case of many emerging and developing economies, much of the savings are kept at the country level and produce little positive wealth effect for their citizens. The general consensus thus far is that this is a net positive for the world economy and should incrementally add to global growth.
The bottom for the oil price remains a guess, but most observers believe we are at or close to the bottom at $40 to $45 per barrel. This remains speculation. Baker Hughes2 has issued the rotary rig counts as a service to the petroleum industry since 1944 and is an important business barometer for the drilling industry and its suppliers. When drilling rigs are active they consume products and services produced by the oil service industry. The active rig count acts as a leading indicator of demand for products used in drilling, completing, producing and processing hydrocarbons. The following data released by Huges tells a story of the stress in the oil business as rigs begin to disappear in the U.S. and Canada – the higher cost producers.
| Area | Last Count | Count | Change from Prior Count | Date of Prior Count | Change from Last Year | Date of Last Year’s Count |
|---|---|---|---|---|---|---|
| U.S. | 30 January 2015 | 1543 | -90 | 23 January 2015 | -242 | 30 January 2014 |
| Canada | 30 January 2015 | 394 | -38 | 23 January 2015 | -214 | 30 January 2014 |
| International | December 2014 | 1313 | -11 | November 2014 | -22 | December2013 |
This is a leading indicator that the production for the excess oil supply in the world may have peaked and the bottom for oil price may be near. But this does not necessarily mean that the oil price is going up from here. Until demand returns, cutting production and supply is the only way to support oil prices.
The World Growth Reassessed
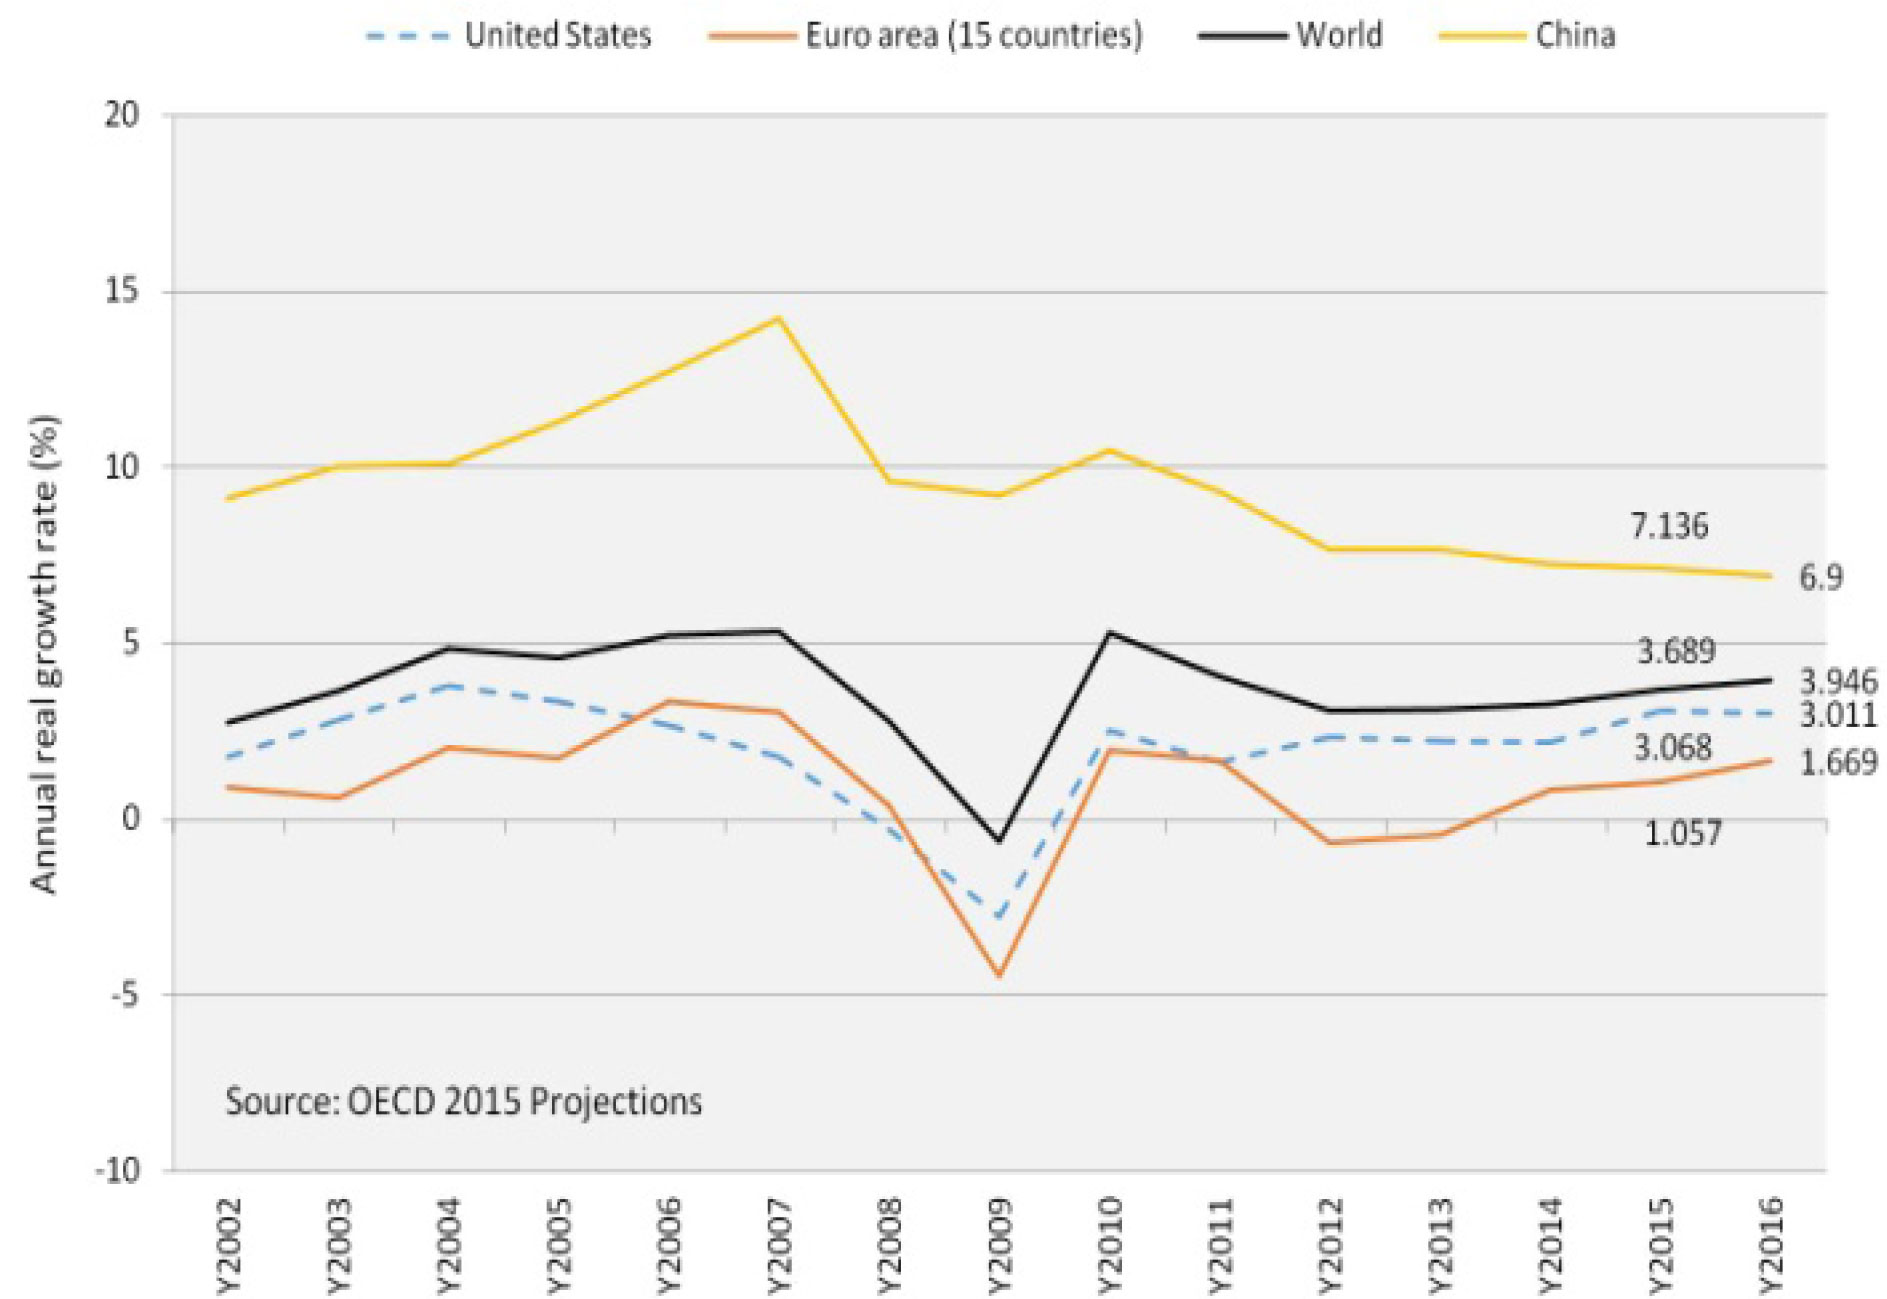
In November 2014, the Organisation for Economic Co-operation and Development (OECD3 ) released its General Assessment of the Macroeconomic Situation and more recently on January 19th, the International Monetary Fund (IMF) issuedits latest update forecasts regarding the world’s economic outlook drawing similar conclusions. The OECD acknowledges the U.S.for stronger growth along with the UK among developed economies. It sees China continuing to slow along with a weak Russia and Brazil. India, Indonesia and South Africa remain on a recovery track. The OECD remains concerned (especially in Europe) with the persistent level of unemployment and with risks largely to the downside for GDP growth due to potential financial volatility, lack of growth confidence, and impaired and stretched bank and household balance sheets especially; and also the risk to deflation in Europe and disinflation around the world. The worry is for global stagflation and demand weakness.The OECD sees global growthpicking up slightly from 3.25% in 2014 to 3.75% in 2015. However, this number masks the divergence across major economies with large risks and vulnerabilities.
Macroeconomic and structural policies need to be as supportive as possible against the backdrop of persistent weak economic activities, stubbornly high unemployment rates, and lingering fear of deflation. Clearly, relying on monetary policy alone is not sufficient to bring escape velocity to the global slowing economies. Available room to ease the pace of fiscal reduction should be exploited and continue designing and implementing structural reforms to enhance resilience and inclusiveness. The IMF’s update to its World Economic Outlook revises its global growth forecast downward for 2015 and 2016 from 3.8% and 4.0% to 3.5% and 3.7% respectively. The U.S. is the only country which the IMF has revised upward its GDP from 3.1% to 3.6% in 2015 and 3.0% to 3.3% in 2016. However, with the dollar strength reducing net U.S. exports is expected. There are many contributing factors to the lower growth forecast. In the Euro area, weak investment and lowered inflation and inflation expectation are contributing factors. In Japan, the economy experienced a fall into a technical recession in the third quarter with subdued private domestic demand after the first round of increased consumption tax. The IMF update basically echoed the views of the OECD- global growth is slowing.
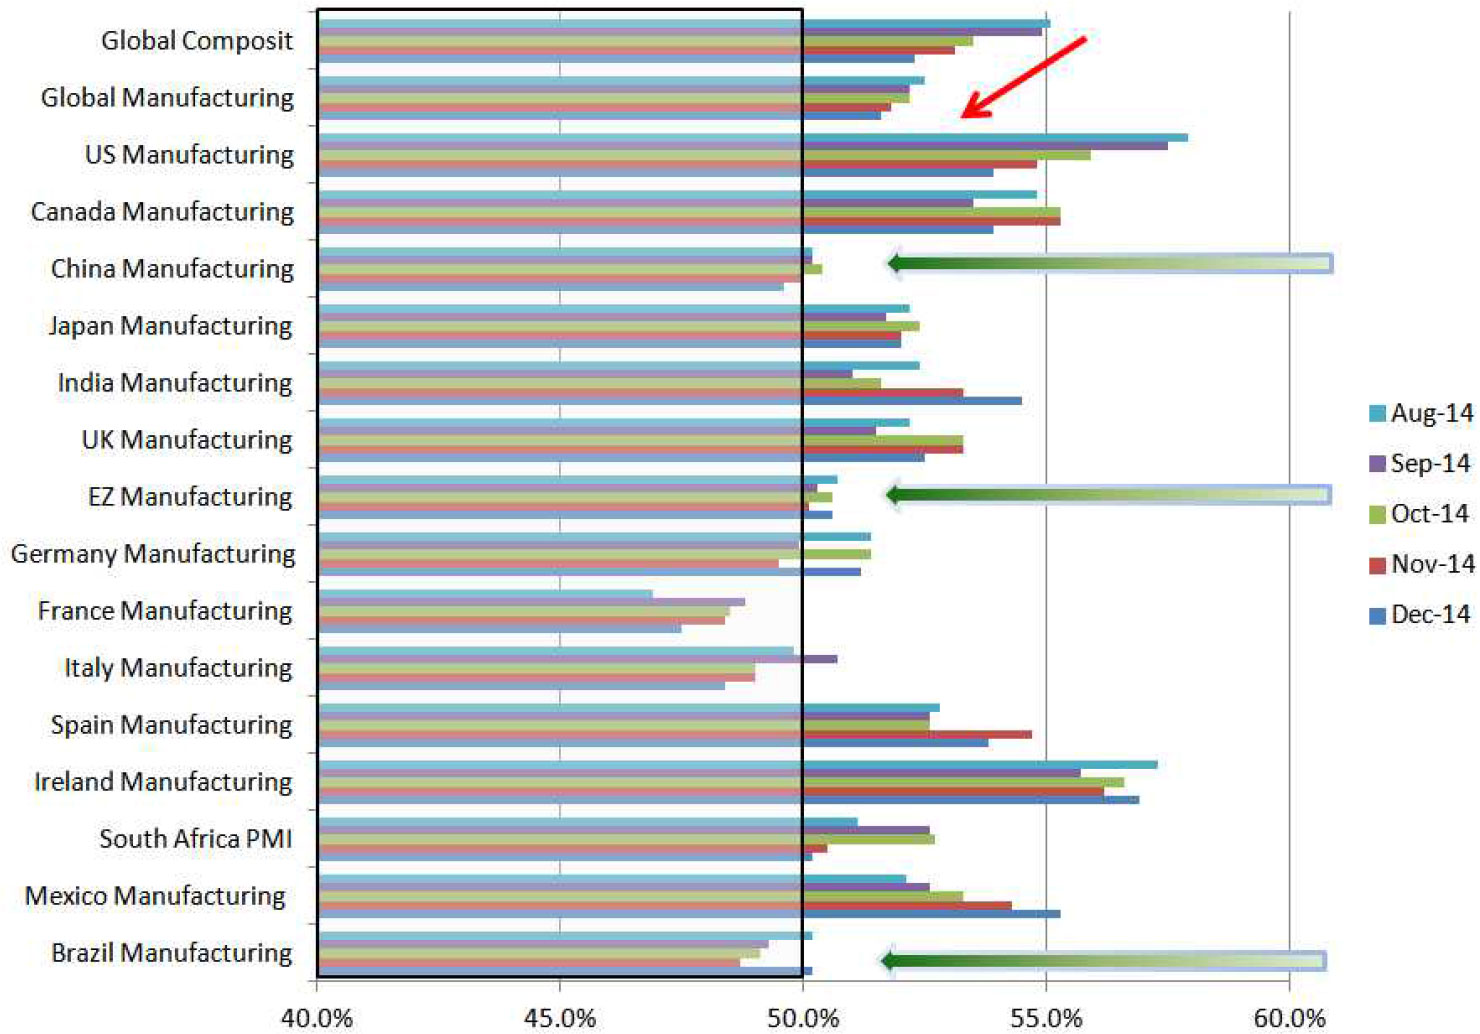
From the PMI surveys provided by Markit, China, Brazil and Europe PMI are hovering around 50, the borderline between expansion and contraction for manufacturing activities.
The Chinese “Engineered” Slowdown
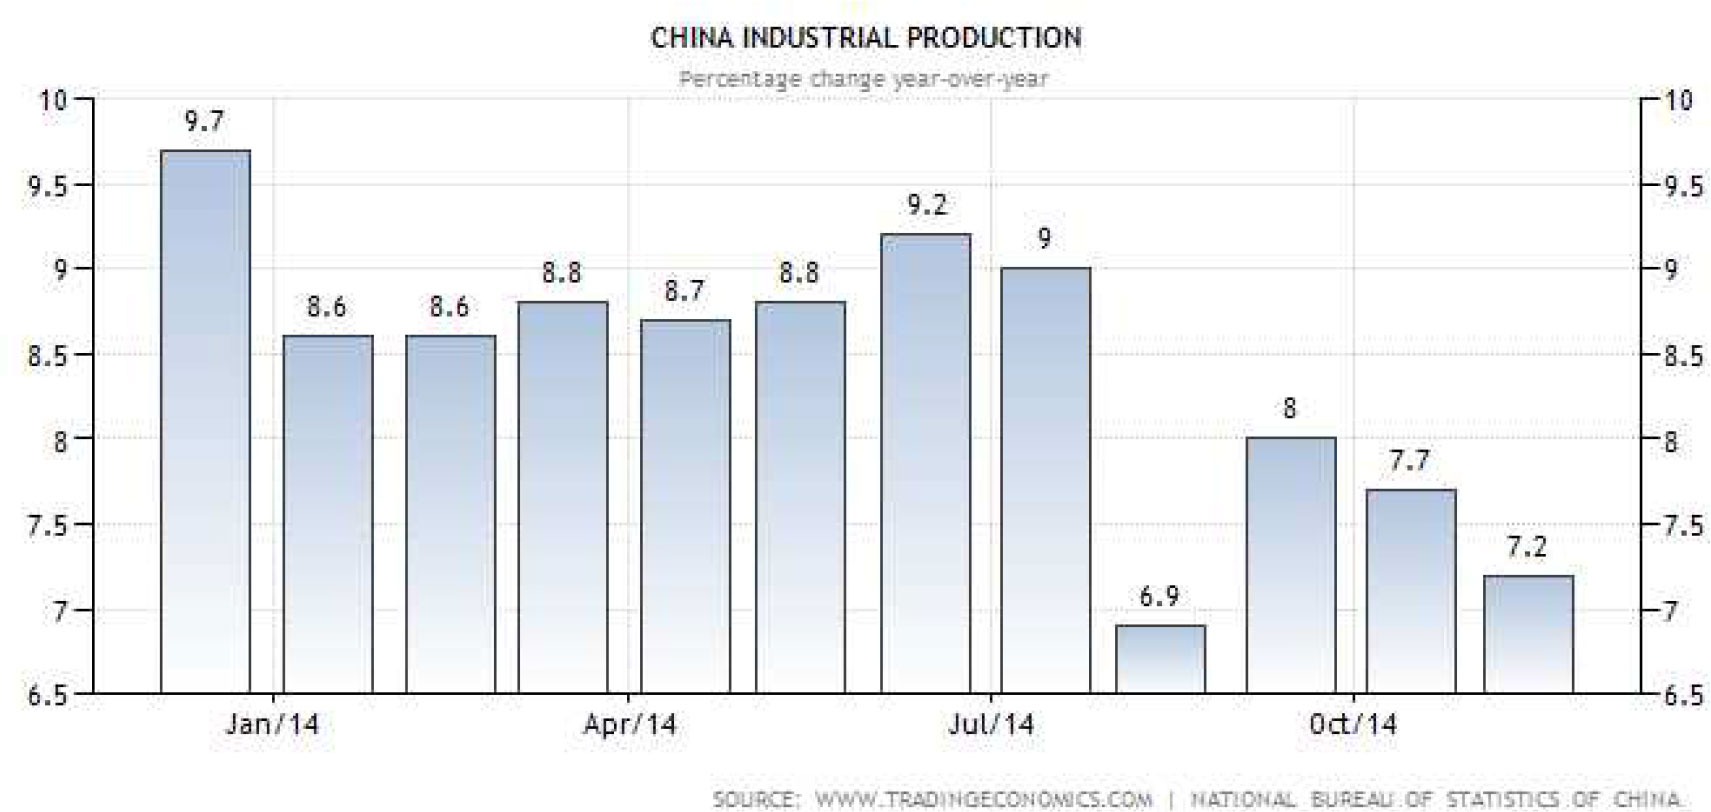
The multi-year slowing in China endures as the government continues to engineer an economic soft landing. After over three decades of double digit growth based on infrastructure spending, property investments and export dependent manufacturing, the world’s second-largest economy is now dealing with industrial overcapacity, inefficient or wasteful allocation of resources, misappropriate of debt and a slumping property market. Not to mention that2014 is expected to have grown at the 7.4% official rate while many economists believe that the real GDP rate is closer to 7% or below. China’s industrial production data continues to slow.
China has a number of tools to manage its economy. In November, China cut its interest rate to spur borrowing. At the same time, The National Bureau of Statistics (NBS) data4 shows December’s new home prices fell an average 4.3% year-on-year in 66 of the 70 major cities it monitors. It is important to note that, real estate investment accounts for 15% of China’s economic growth. The January NBS report also shows that the resale residential market is also week with 60 of the 70 cities showing a price decline. The necessary and continuing move by China from an outward, dependent export (30% of GDP) driven growth model to a domestic consumption driven model will take many years (perhaps decades) to accomplish. This change has significant impact on commodity prices, producers and world trade.
Low Rates Are Everywhere
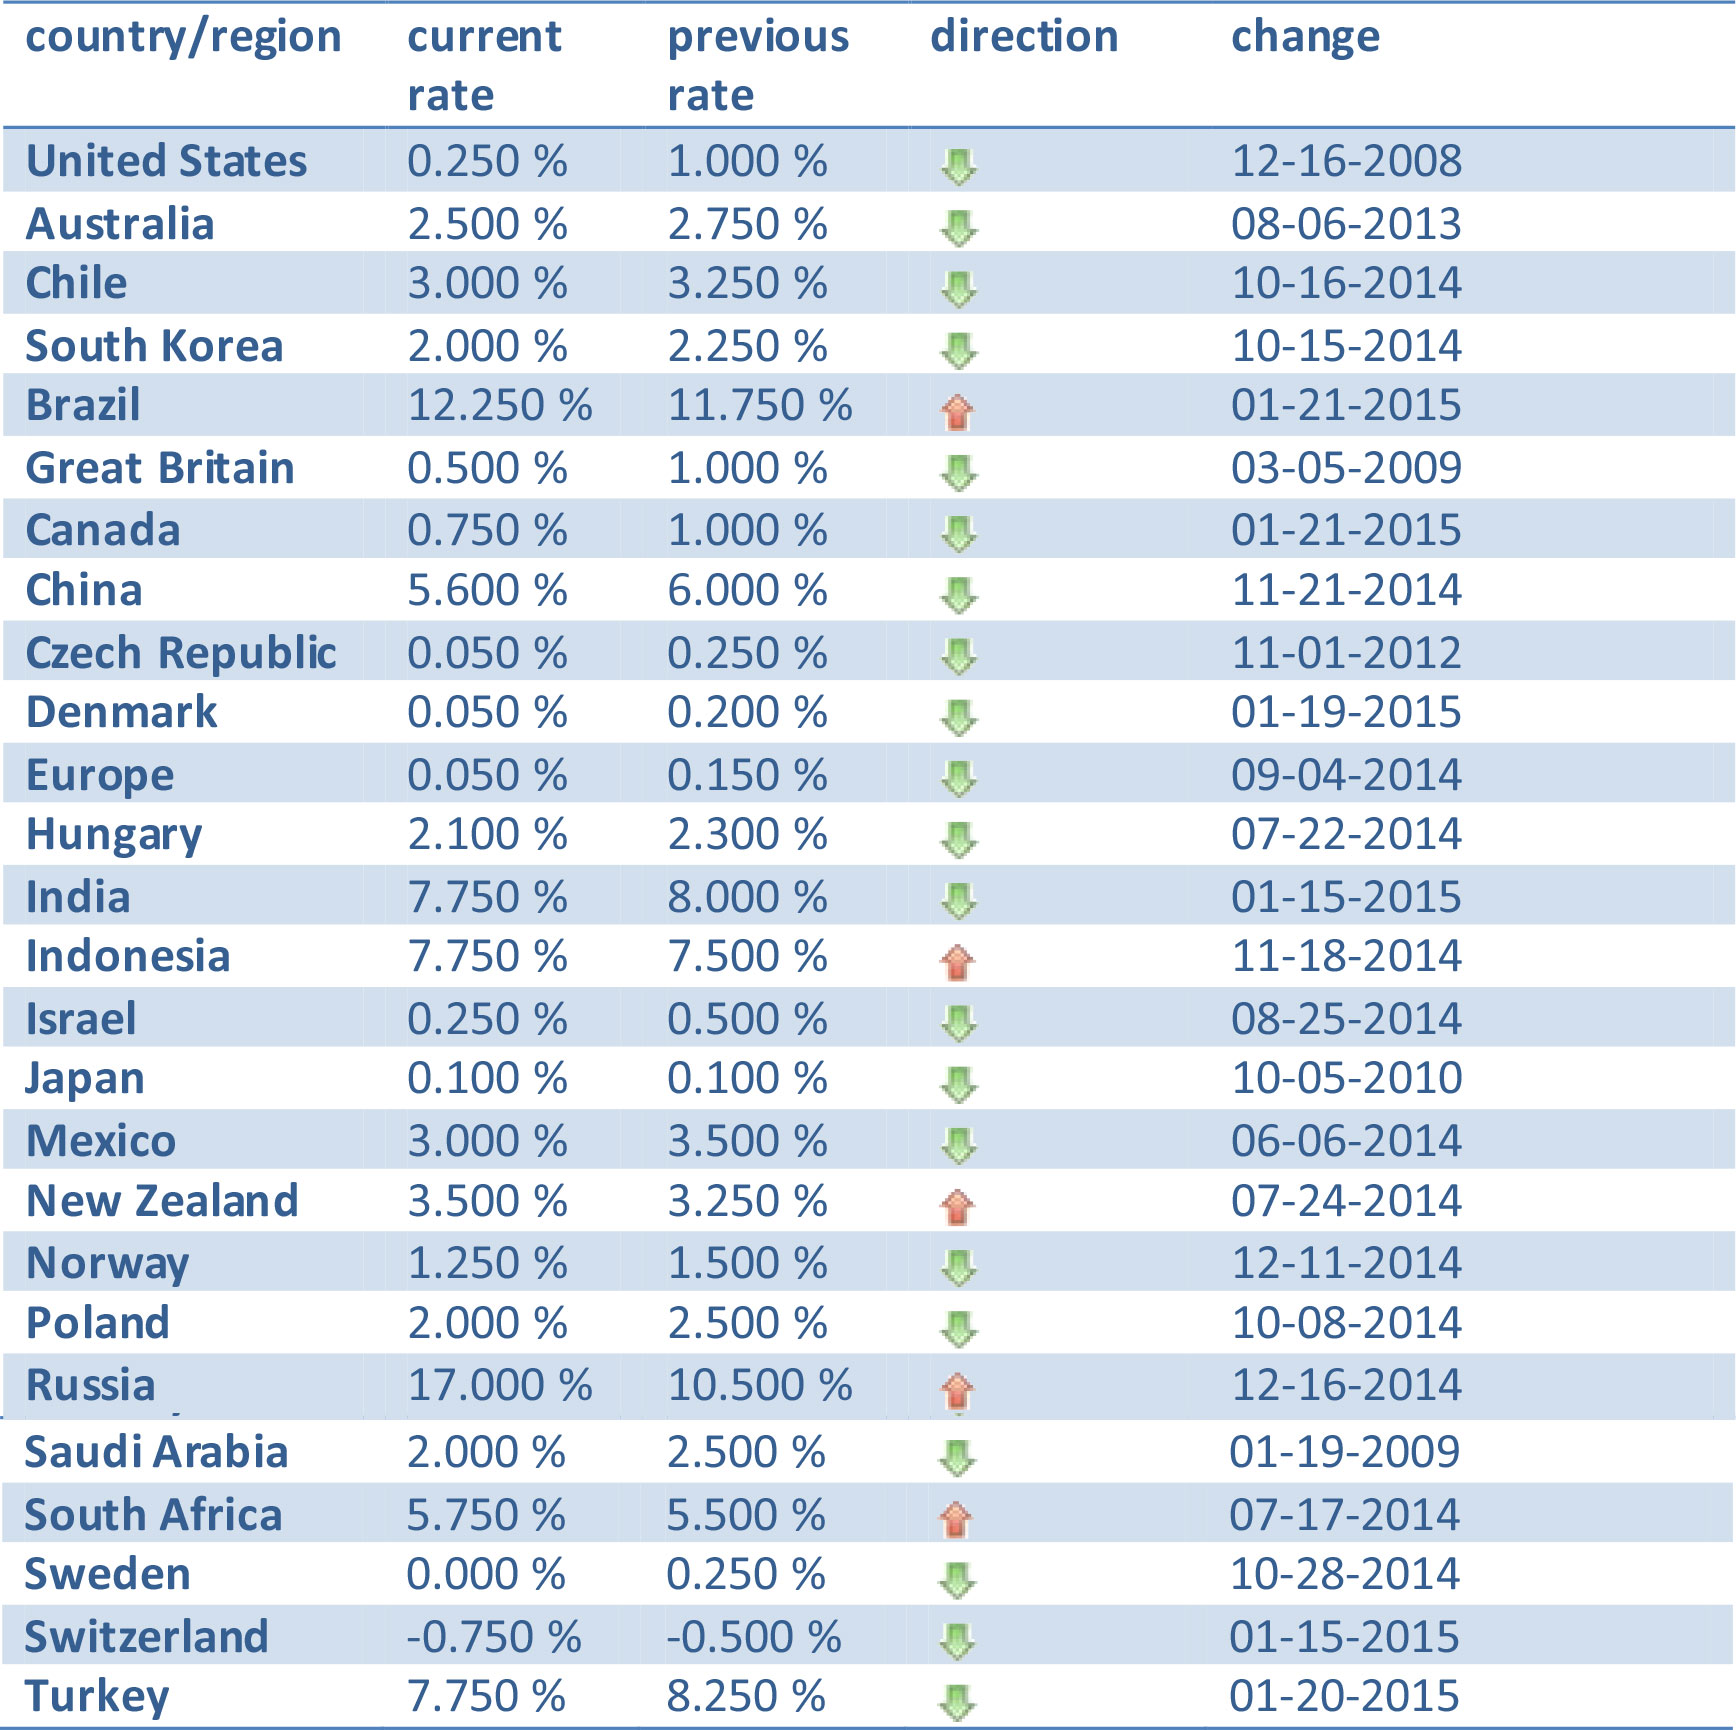
In a summary of current interest rates of 26 central banks, 21 countries experienced a rate cut from the last central bank action with Singapore recently announcing a drop in their interest rate as well. Of the remaining countries that raised rates, three are members of the Fragile Five5 – the Brazilian real, the Indonesian rupiah, and the South African rand. They did this in order to defend their currency and to take action against capital flight. Russia in an extreme case of self preservation to protect its currency from a significant drop in oil prices (thus revenue) and the world sanction against theirmeddling of eastern Ukraine. In fact, its central bank has just announced that they will reduce rate signaling and that their recent actions of significant interest rate increaseshave been ineffective in supporting their currency from collapsing.
http://www.global-rates.com/interest-rates/central-banks/central-banks.aspx
The Super Mario Bazooka
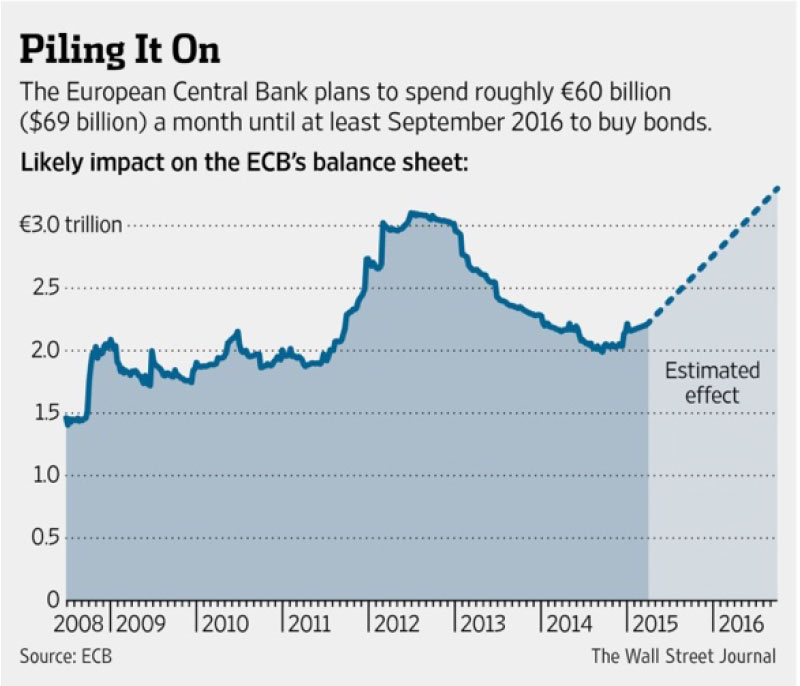
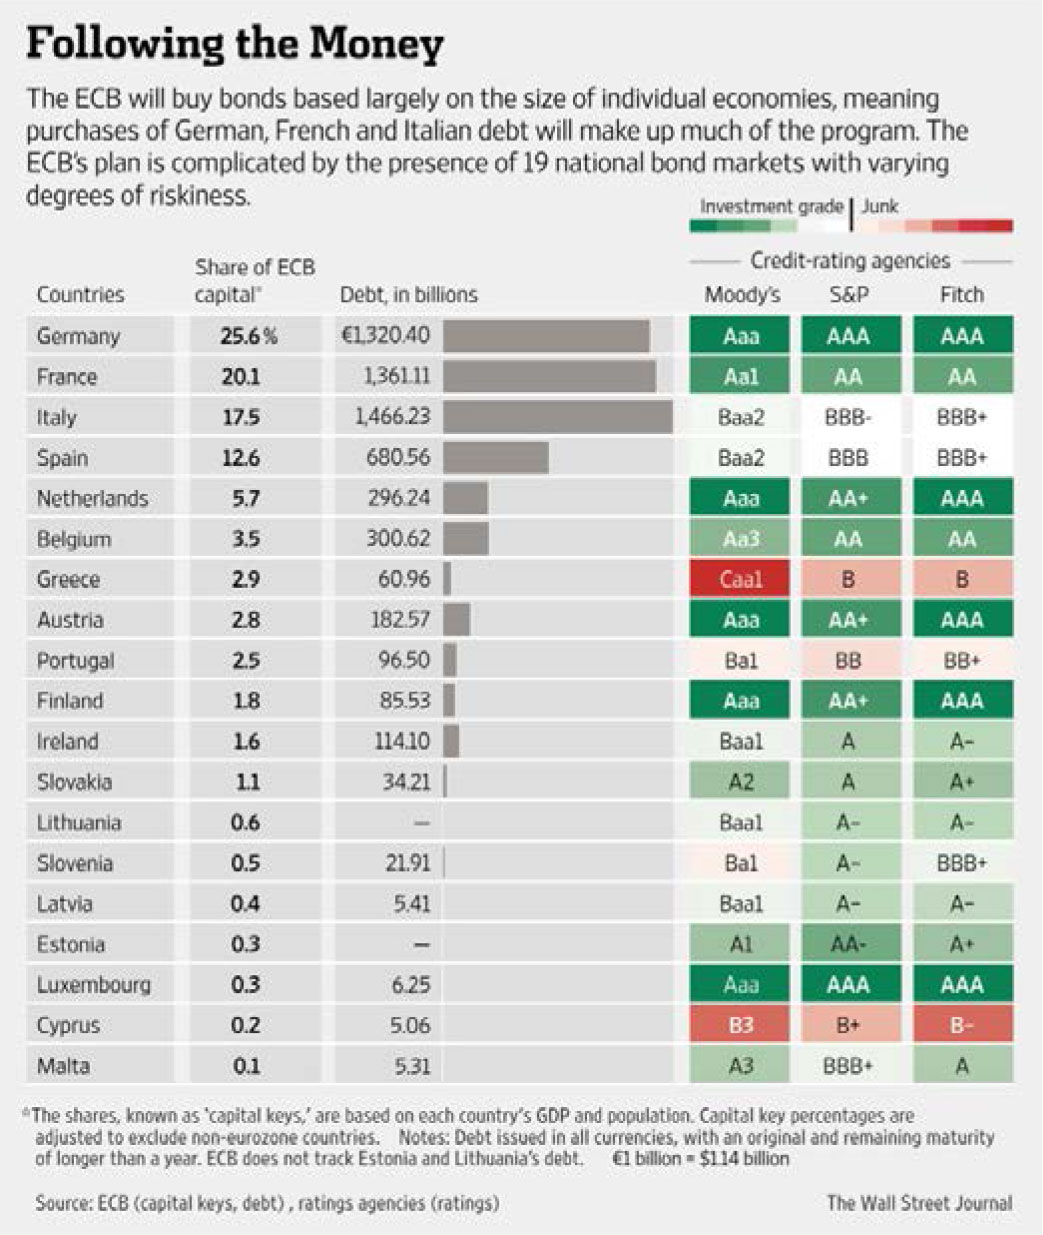
On January 22, 2015, Mario Draghi, the European Central Bank (ECB) President, announced during his press conference6 after the conclusion of the Governing Council that the ECB will begin an open-ended €1 trillion QE program. Beginning in March, the combined monthly purchases of public and private sector securities will amount to €60 billion. These purchases are intended to be carried out until the end of September, 2016, but will be conducted until a sustained adjustment in the path of inflation which is consistent with the ECB’s aim of achieving inflation rates below, but close to, 2% over the medium term. The Eurosystem will start to purchase euro-denominated investment-grade securities issued by euro area governments and agencies and European institutions in the secondary market. The purchases of securities issued by euro area governments and agencies will be based on the Eurosystem National Central Banks’ (NCB) shares in the ECB’s capital key7 . Moreover, the ECB has decided to keep the key ECB interest rates unchanged.
29 months after the “ECB is ready to do whatever it takes to preserve the euro” speech at the Global Investment Conference in London, Mario Draghi launched the much anticipated bazooka. Mario Draghi cited two unfavorable developments that contributed to the Governing Council actions:
1) Inflation dynamics have continued to be weaker than expected. While the sharp fall in oil prices over recent months remains the dominant factor driving current headline inflation, the potential for second-round effects on wage and price-setting has increased and could adversely affect medium-term price developments. This assessment is underpinned by a further fall in market-based measures of inflation expectations over all horizons and the fact that most indicators of actual or expected inflation stand at, or close to, their historical lows. At the same time, economic slack in the euro area remains sizeable and money and credit developments continue to be subdued.
2) While the monetary policy measures adopted between June and September last year resulted in a material improvement in terms of financial market prices, this was not the case for the quantitative results. As a consequence, the prevailing degree of monetary accommodation was insufficient to adequately address heightened risks of too prolonged a period of low inflation.
In an effort to appease those that reject debt mutualization and are concerned about redistribution of financial risks, the new program will limit risk sharing to bonds issued by European Union institutions. NCBs will buy their own government bonds and new bonds issued by European Institutions such as the European Investment Bank. This will account for 12% of QE. The ECB will buy 8% of the same bonds. The combined 20% there will be risk sharing.
Mario Draghi made clear at the end of his press conference stating:
“Monetary policy is focused on maintaining price stability over the medium term and its accommodative stance contributes to supporting economic activity. However, in order to increase investment activity, boost job creation and raise productivity growth, other policy areas need to contribute decisively. In particular, the determined implementation of product and labour market reforms as well as actions to improve the business environment for firms needs to gain momentum in several countries. It is crucial that structural reforms be implemented swiftly, credibly and effectively as this will not only increase the future sustainable growth of the euro area, but will also raise expectations of higher incomes and encourage firms to increase investment today and bring forward the economic recovery. Fiscal policies should support the economic recovery, while ensuring debt sustainability in compliance with the Stability and Growth Pact, which remains the anchor for confidence. All countries should use the available scope for a more growth-friendly composition of fiscal policies.”
This sounds just like the Japanese 3-Arrow approach of monetary, fiscal and structural reform. After two years, Japan has not succeeded. To effect the necessary changes on a timely basis in the common currency area consisting of 19 countries should be that much more difficult. In the mean time, peripheral countries are cheering and bankers and the financial economy are applauding. At the same time, Denmark cut its main interest rate for the second time in a week and the Swiss Central Bank, in anticipation of QE, scrapped its cap on the Swiss franc’s exchange rate against the euro. These and other actions and reactions are adding uncertainty, fear and volatility to the financial markets globally as currency war is on full throttle.
Syriza – L’Enfant Terrible
It should not be a surprise that the leftwing populist party, Syriza, won the general election in Greece on January 26th. After 4 years of instituting a fiscal austerity program as an agreement to the Greek bailout imposed by the Troika, Greece’s economy remains in shambles with high unemployment and no end in sight. The Greeks, rightly or not, are tired of the economy and social conditions they are under and demand change. This is an anti-austerity (budget cut and tax increase), “I can’t take it anymore” vote rather than a vote for communism or left wing extremism. Nonetheless this strengthens the position of other radical parties in Europe, from the right-wing National Front in France to the newly formed left-wing Podemos party in Spain. Alexis Tsipras, the new prime minister of Greece has promised a spending package aimed at Greece’s struggling poor, a roll back on reforms, and to win forgiveness of some of Greece’s public debt (175% of the Greek 2014 GDP). Just three days after the election, the new finance minister stated that Greece will no longer cooperate with the Troika and not accept an extension of the bailout program (€172 billion)that expires at the end of February. This in effect will shut off any ECB funding to its banks. Further, the finance minister pledges to freeze privatizations, rehire workers and restore minimum wage to the pre-austerity level.
The added level of uncertainty is that the Syriza government is populated with inexperienced players. It is not clear whether the newly elected officials are positioning themselves this way as a negotiation tactic or if they intend to meet their promises to the electorate. Either way, the calmness in the euro area is now over. The world will have to experience the next chapter of the monetary union experiment.
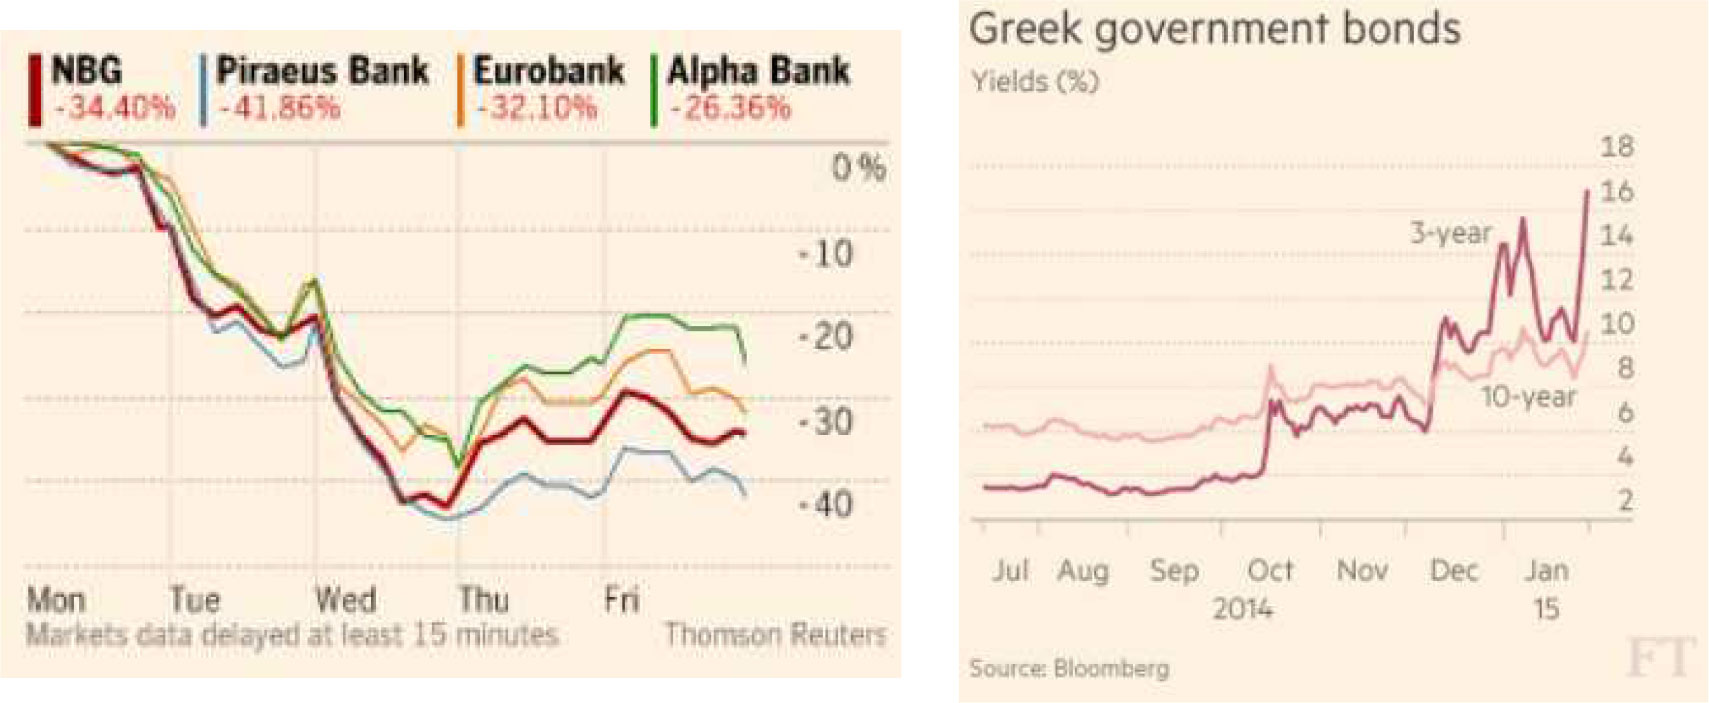
The market fear of Greece abrogating its debt and leaving the euro is evidenced by the plummeting value of Greek banks and the spiking of the Greek bond yield.
The bigger fear is that this potential “credit event” can have spillover effects politically and financially. It threatens the very existence and cohesiveness of the European Monetary Union while stoking the fire of discontentment among many citizens who have yet to recover from the financial crisis. In many ways, the global financial and banking system are much stronger and would likely be able to withstand a Greek default and contain its fallout, but it is also clear that central banks around the world are out of policy bullets if the credit event turns out to be more significant. These are risks, real or perceived, and add to market volatility.
U.S. Dollar – The Giant among Dwarfs
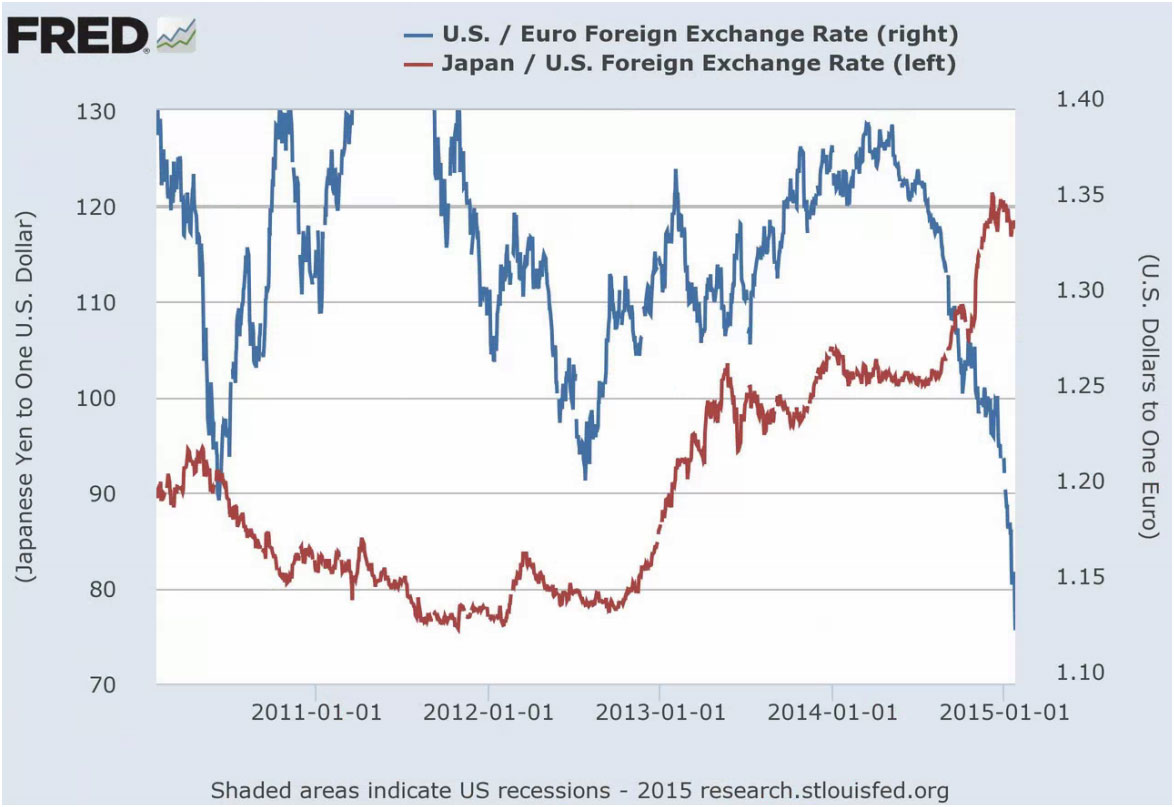
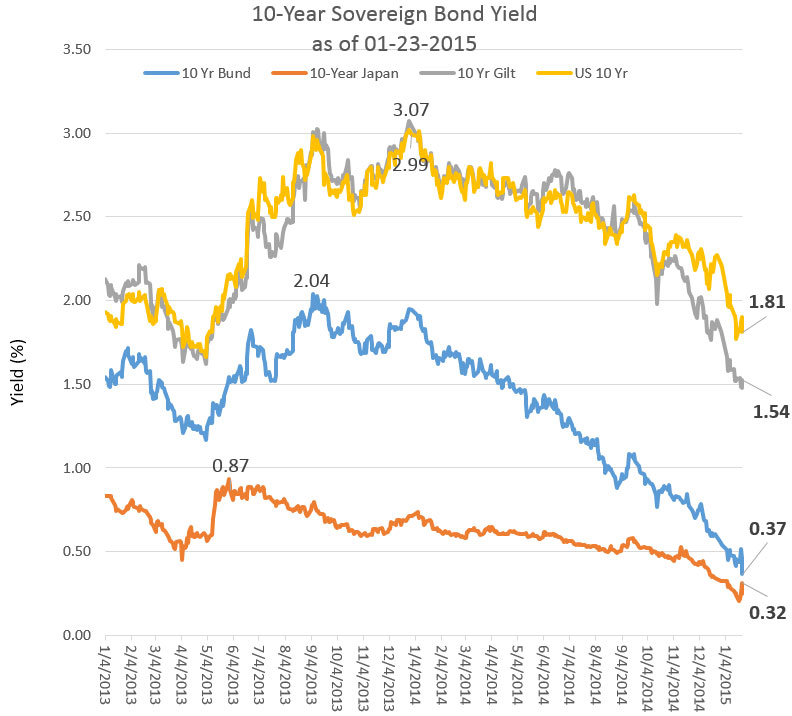
The strength of the U.S. dollar is a result of the relative positive economic performance of the U.S. and the geopolitical risks globally. The 10-year sovereign bond yields for Germany (bunds), Japan, UK (Gilt) and the U.S. show that they are all trending downwards. A part of this is a result of monetary policies to drive interest rates lower to support and grow their respective economies. Another part is the absence of inflation or the presence of disinflation (some even deflation) around the world, but the lower rates are also due to a “flight” to safe assets from different regions of the world where geopolitical risks and debasement of local currencies are encouraging flight capital. In the case of the U.S. treasury, even the sub-2% 10 year financial repression yield is superior to all other safe haven yields. This helps to further supportU.S. dollar strength. The barriers of 120 (Japanese yen to the USD) /1.20 (USD to euro) have been crossed, and with an expected strengthening of the U.S. economy and the Federal Reserve’s (Fed) tightening posture, the U.S. dollar is expected to continue its ascend. Even if the U.S. economy does remain in the sub 3% range, the relative economic performance and the expected continuing geopolitical issues will continue to support the U.S. dollar strength. The beneficiaries are U.S. consumers, but U.S. exporters and U.S. companies deriving income from overseas will face increasing headwinds.
Even though U.S. export represents 13% of the U.S. economic output, signs of dollar strength are showing in the current corporate earnings as multi-national U.S. companies are reporting or projecting a slowdown in foreign revenue. In the short term, this is sustainable, but if the dollar continues its rise as the rest of the world attempts to devalue its way out of economic malaise, it will have impactful economic consequences. Furthermore, a strong dollar in a consumption driven economy is disinflationary and works very much against the efforts of the Fed for price stability.
Can the U.S. Inflation Boat Float?
The second mandate for the Fed is to promote price stability. This means keeping the U.S. economy not too cold (i.e. recession and deflation) and not too hot (i.e. inflation). The challenge with price stability is all about expectation. Although the Fed continues to suggest that inflation expectation is well anchored around the targeted 2% annual rate, there is no assurance that this would continue to be the case even though the inflation outlook is typically hard to alter.
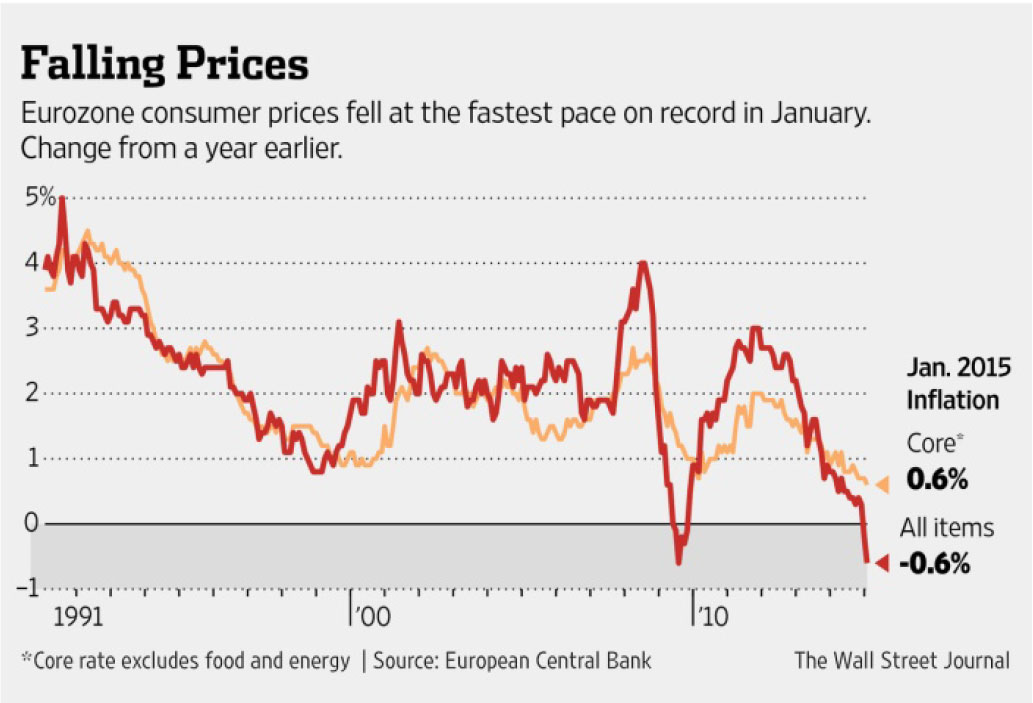
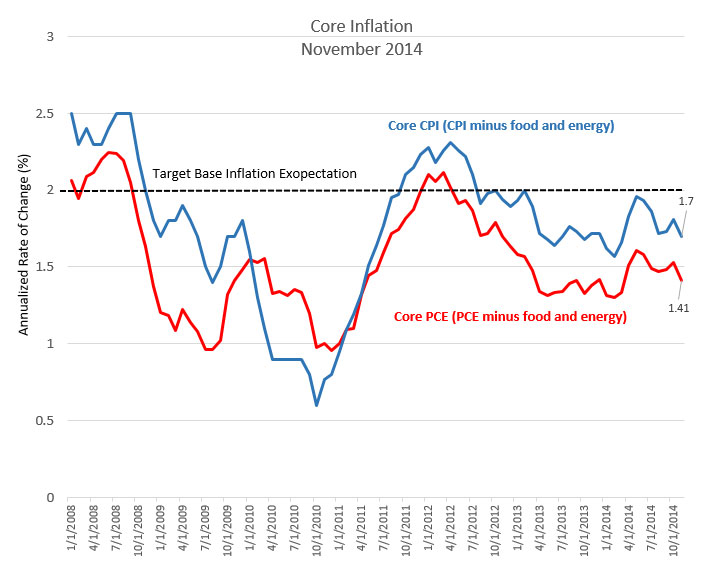
The core (exclude food and energy) CPI and the core Personal Consumption Expenditure (PCE) are both showing a downward trend recently after a brief rise. The Fed uses the PCE as a main gauge for inflation and it is stubbornly below the 2% target. Although the Fed believes that the current oil price collapse will bring the headline inflation rate down and is in fact likely to be negative in the upcoming quarter, the core inflation rate will likely remain unaffected. The negative oil impact is deemed transitory. The question which remains for the Fed is how to assure price stability or bring inflation back 7 year after the Financial Crisis. The single biggest driver for U.S. inflation is likely to come from real wage growth. As more jobs are created while unemployment rate continue its slide, economists are expecting real wage pressure soon. This will start the spending cycle and hopes to bring core inflation back to 2%.
What the FOMC Does, Matters
The U.S. remains the most dominant superpower in the world. Our currency is the world reserve currency with the deepest and broadest market. With our military strength and our economic size, the U.S. treasuries are deemed safe haven assets. A significant portion of global trades are denominated in the dollar and just about every financial instrument is priced against the U.S. treasury as a way to assess and compensate for risks. In modern portfolio science, the U.S. treasury is known as the risk free asset, and the Fed Fund rate is known as the risk free rate. The U.S. treasury yield curve can be thought of as the foundation to price other assets. The Fed brought the Fed Fund rates down to near 0% and held the rate at that level since the end of 2008 and instituted Large Scale Asset Purchase programs (Quantitative Easing or QE) to bring down the treasury yield curve, and all assets are re-priced in response. These actions are serious with intended and unintended ramifications. The extraordinary monetary actions were necessary to truncate the free fall mortgage-led crisis and to restore confidence and to buy time for financial and economic recovery. The zero bound monetary policy and the massive Fed balance expansion pushed investors to take risk again, but investors can very easily get comfortable with this risk depressed highly liquid environment, and the longer it persists the more investors become dependent. In fact, since 2009,each time the economy began to fall back, the financial market waited for a new round of QE. When the monetary spigot is turned on, the market recovered. Like a Pavlovian dog, the market is conditioned and craves for the “treat”,so, when the real economy showed signs of weakness, the stock market rallied in anticipation of larger and longer QE. Then came the temper tantrum in 2013which showed how not only the U.S. but world investors have came to rely on the central bank’s loose monetary policies. The reaction of a selloff for all assets took the Fed by surprise and it learned to better prepare the market with its forward guidance.
With new job creation improving through 2014 and the steady recovery of the broader economy, the Federal Open Market Committee (FOMC) is looking to move away from the zero bound interest rate environment and to begin the long awaited normalization process. The FOMC took the first step in November to wind down the QE bond buying program while also maintaining its bloated balance sheet by continuingreinvesting principal payments from the Fed’s holdings of agency debt and agency MBS in agency MBS and of rolling over maturing Treasury securities at auction. This maintains pressure in the longer end of the treasury yield curve to support lower interest rates for mortgages and lending in general.
In its January 28, 2015 release of the FOMC meeting minutes, the Committee confirmed that the U.S. economy is expanding at a solid pace and its labor market has witnessed strong job gains with a lower unemployment rate. Underemployment and labor slack continue to diminish. Household spending is on the rise boosted further by the recent declines in energy prices. Even though inflation has declined, inflation expectation appears to remain well anchored. On a forward looking basis, the Committee expects economic activity to expand at a moderate pace with the labor market to move towards maximum employment. However, inflation is expected to decline further in the near term but rise towards the 2% target in the medium term as the labor market improves further while the transitory effects of energy prices and other factors dissipate. The Committee affirmed the zero bound target interest rate policy.
“In determining how long to maintain this target range, the Committee will assess progress bothrealized and expected toward its objectives of maximum employment and 2 percent inflation. This assessment will take into account a wide range of information, including measures of labor market conditions, indicators of inflation pressures and inflation expectations, and readings on financial and international developments. Based on its current assessment, the Committee judges that it can be patient in beginning to normalize the stance of monetary policy. However, if incoming information indicates faster progress toward the Committee’s employment and inflation objectives than the Committee now expects, then increases in the target range for the federal funds rate are likely to occur sooner than currently anticipated. Conversely, if progress proves slower than expected, then increases in the target range are likely to occur later than currently anticipated.”
In the press release for the December 2014 meeting, the Committee removed the statement that it likely will be appropriate to maintain the 0 to 1/4 percent target range for the Fed funds rate for “a considerable time following the end of its asset purchase program” and replaced it with the current language of “patience”. The December release amplified that:
“[w]hen the Committee decides to begin to remove policy accommodation, it will take a balanced approach consistent with its longer run goals of maximum employment and inflation of 2 percent. The Committee currently anticipates that, even after employment and inflation are near mandate consistent levels, economic conditions may, for some time, warrant keeping the target federal funds rate below levels the Committee views as normal in the longer run.”
We believe that:
- The Committee has no idea (but desire as to) when it will raise rates even though Chairman Yellen suggests that it “will be appropriate to begin raising the target range for the federal funds rate in 2015” and not doing so for at least a couple of quarters back in 2014.
- The Committee is very cautious about the risks of moving too soon. By acting too soon, it may have a material impact on the economic recovery and financial markets that stalls the desired outcome of full employment and price stability.
- The Committee is very cautious about the risks of moving too slow. By delaying its action, it may have inadvertently fallen behind the inflation curve and has to respond with more aggressive action.
- For the Committee to strike a balance (best guess) of the timing risks is to be totally data dependent, and when the Committee decides to act (sooner rather than later), it will do slowly and over a long period of time.
The general consensus is for the Fed to raise rate in this summer. In reality this type of speculation is foolish. This assumes that the Fed has a definite game plan and just simply not telling us. In reality, the Fed is reviewing the economy in real time as we are and making informed decisions as they balance the too soon and too late risks. There is no question that the zero bound policy should not be with us for an extended period of time. The Committee must normalize the target rate so that it restores some of its policy tools to combat future economic crisis.
The Safety Net Is Gone
2015 is another opportunity to witness the process of the final handoff from the public sector to the private sector after years of post financial crisis support. With the end of QE in November last year and the expectation of the gaining of interest rate normalization, we expect a return of market volatility and uncertainty. The training wheels must come off soon or later.
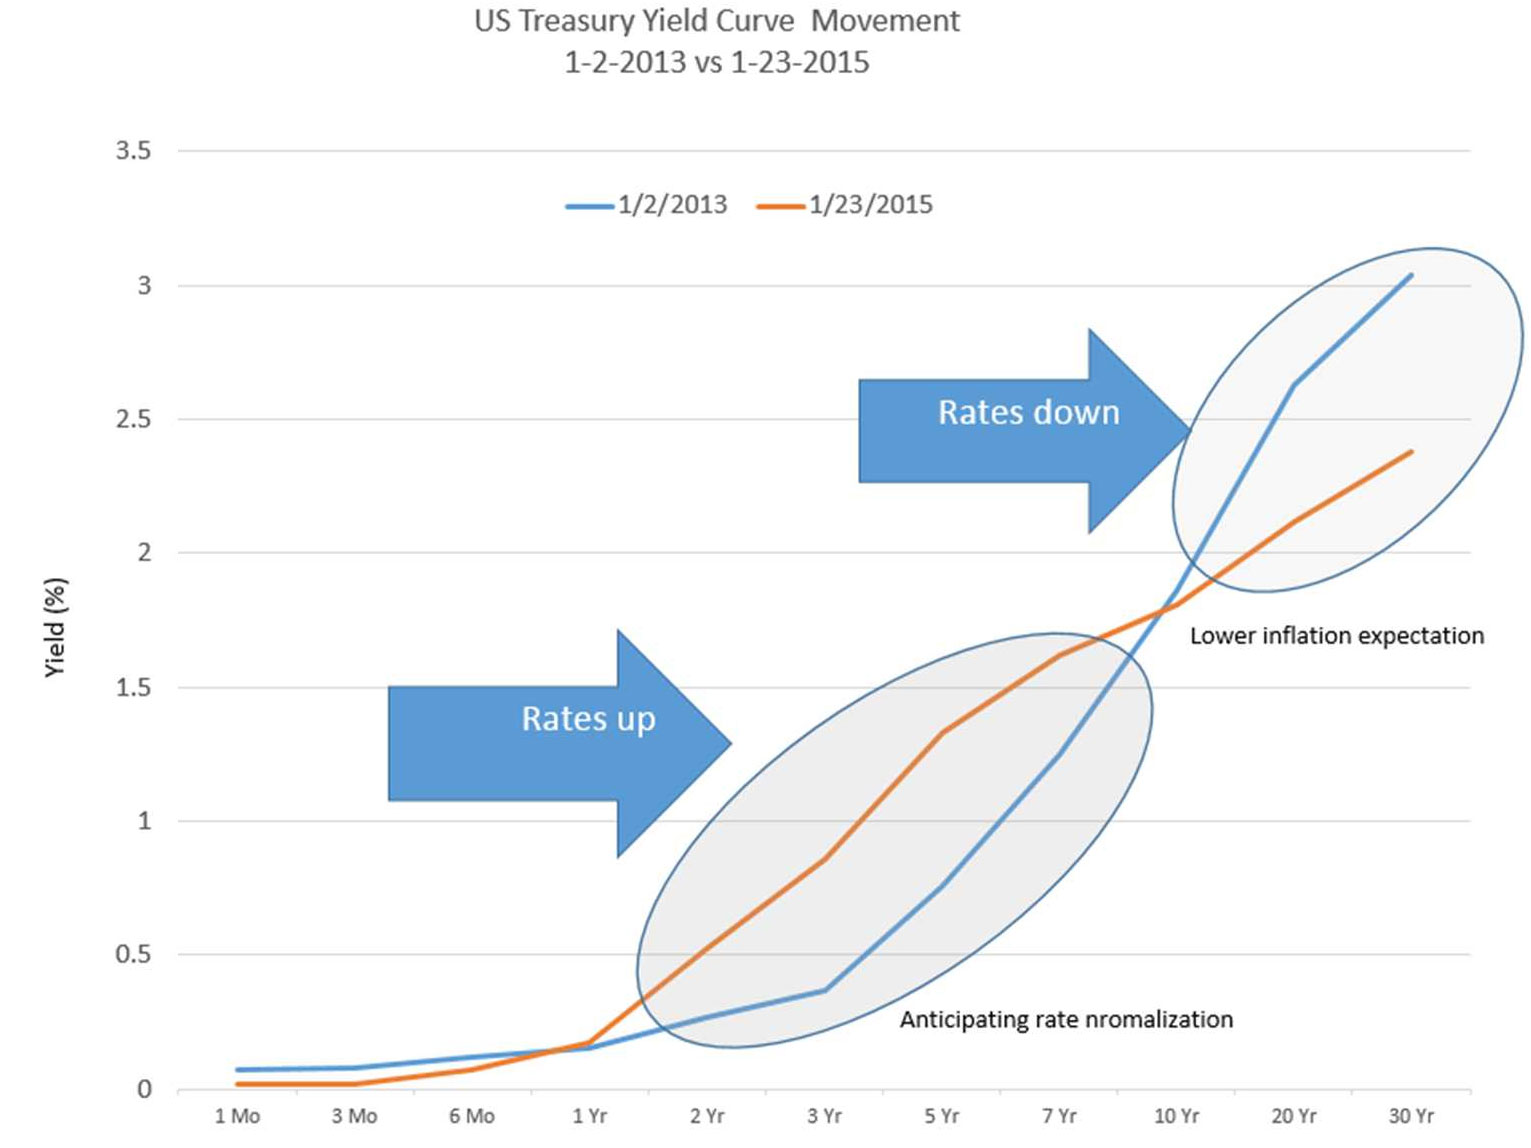
The shorter end of the treasury yield curve has already begun responding while the longer end is expressing the market’s sentiments regarding a lack of inflation (or the presence of disinflation) and the favorable U.S. economic environment (flight to safety). Interestingly, the pivot point is at the 10-year treasury (this is a bear flattener) where mortgage and other lending rates are pegged. The market continues to price the forward yield curve below the stated expectation for yields by the FOMC. It is impossible to know if the market or the Fed is right. Fed decisions are data dependent, and if history is a guide, the Fed has been wrong about their economic forecast for some time. The market has also been wrong by expecting the Fed to raise rates sooner rather than later. One thing is for sure: more uncertainty adds more risks which lead to a higher degree of volatility (outcome variability) as we continue our journey to “normalization”; except, this time we have no Fed QE to save us all!
- OPEC member countries: Algeria, Angola, Ecuador, Iran, Iraq, Kuwait, Libya, Nigeria, Qatar, Saudi Arabia, United Arab Emirates and Venezuela. www.opec.org
- http://phx.corporate-ir.net/phoenix.zhtml?c=79687&p=irol-rigcountsoverview
- The Organization for Economic Co-operation and Development’s (OECD) mission is to is to promote policies that will improve the economic and social well-being of people around the world. The 34 member countries are: Australia, Austria, Belgium, Canada, Chile, Czech Republic, Denmark, Estonia, Finland, France, Germany, Greece,
Hungary, Iceland, , Ireland, Israel, Italy, Japan, Korea, Luxembourg, Mexico, Netherlands, New Zealand, Norway,
Poland, Portugal, Slovak Republic, Slovenia, Spain, Sweden, Switzerland, Turkey, United Kingdom, and United States http://www.oecd.org/ - http://data.stats.gov.cn/english/swf.htm?m=turnto&id=5
- Fragile Five – Troubled emerging market currencies under most pressure against the U.S. dollar. And each o has a significant current account deficit problem.
- https://www.ecb.europa.eu/press/pressconf/2015/html/is150122.en.html
- In order to safeguard the ECB’s independence from political influence, it has its own capital, subscribed by the national central banks. The total subscribed capital currently amounts to 10.83 billion euro. Each national central bank accounts for a fixed percentage of this – the capital key. The key is calculated according to the size of a member state in relation to the European Union as a whole, size being measured by population and gross domestic product in equal parts. In this way, each national central bank has a fair share in the ECB’s total capital. The figures used to calculate this are supplied by Eurostat, the EU statistics agency. If, for instance, a country accounted for 10% of the EU’s total population and produced 20% of its total economic output, then its capital key would be 15%. For Germany, the most populous country and strongest economy in Europe, the key for the subscription of ECB capital is currently 17.9973%.The capital key is recalculated every five years, the most recent calculation having taken place as at 1 January 2014. The capital shares are also adjusted whenever a new member joins the European System of Central Banks (ESCB). Source: Deutsche Bundesbank – http://www.bundesbank.de/Redaktion/EN/Topics/2014/2014_01_16_understanding_the_capital_key.html

