Off Go the Training Wheels
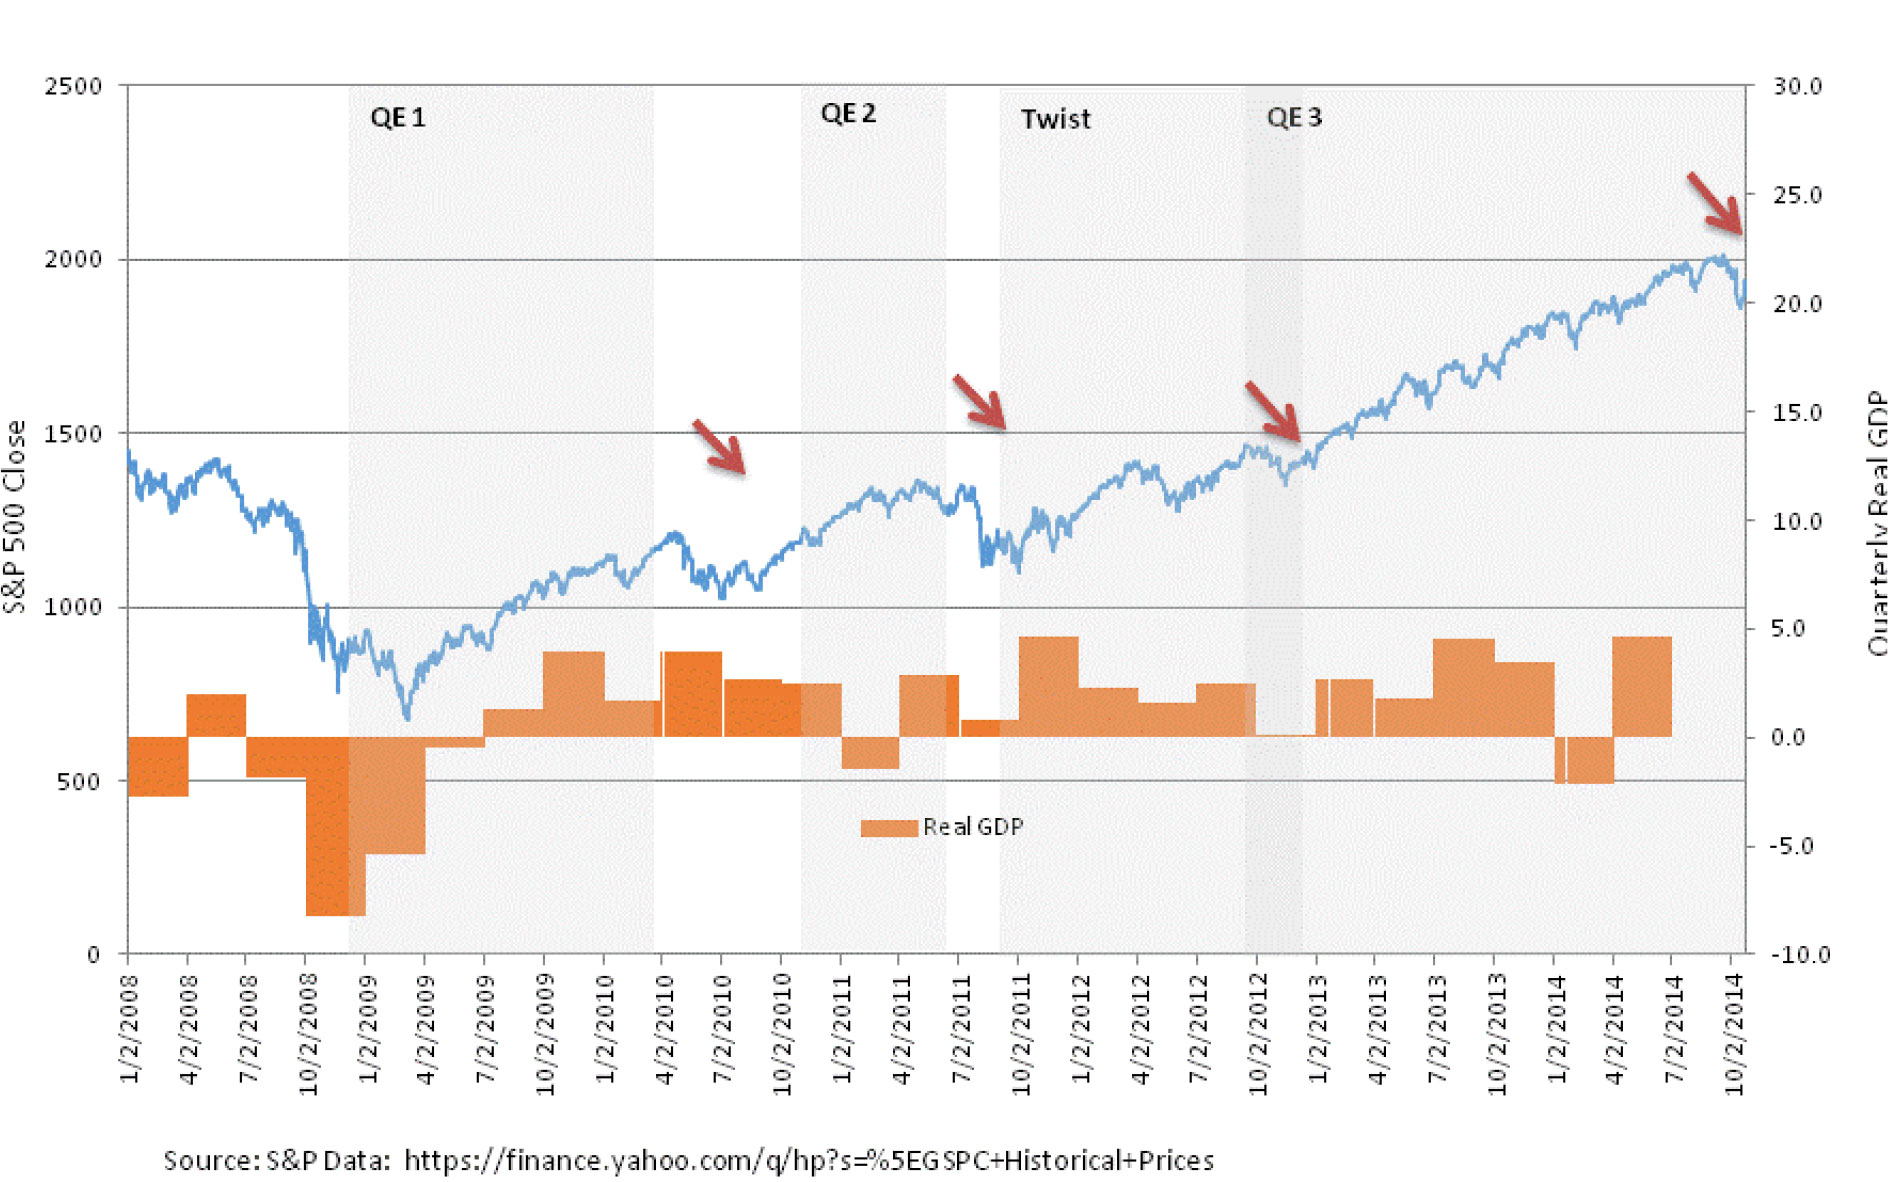
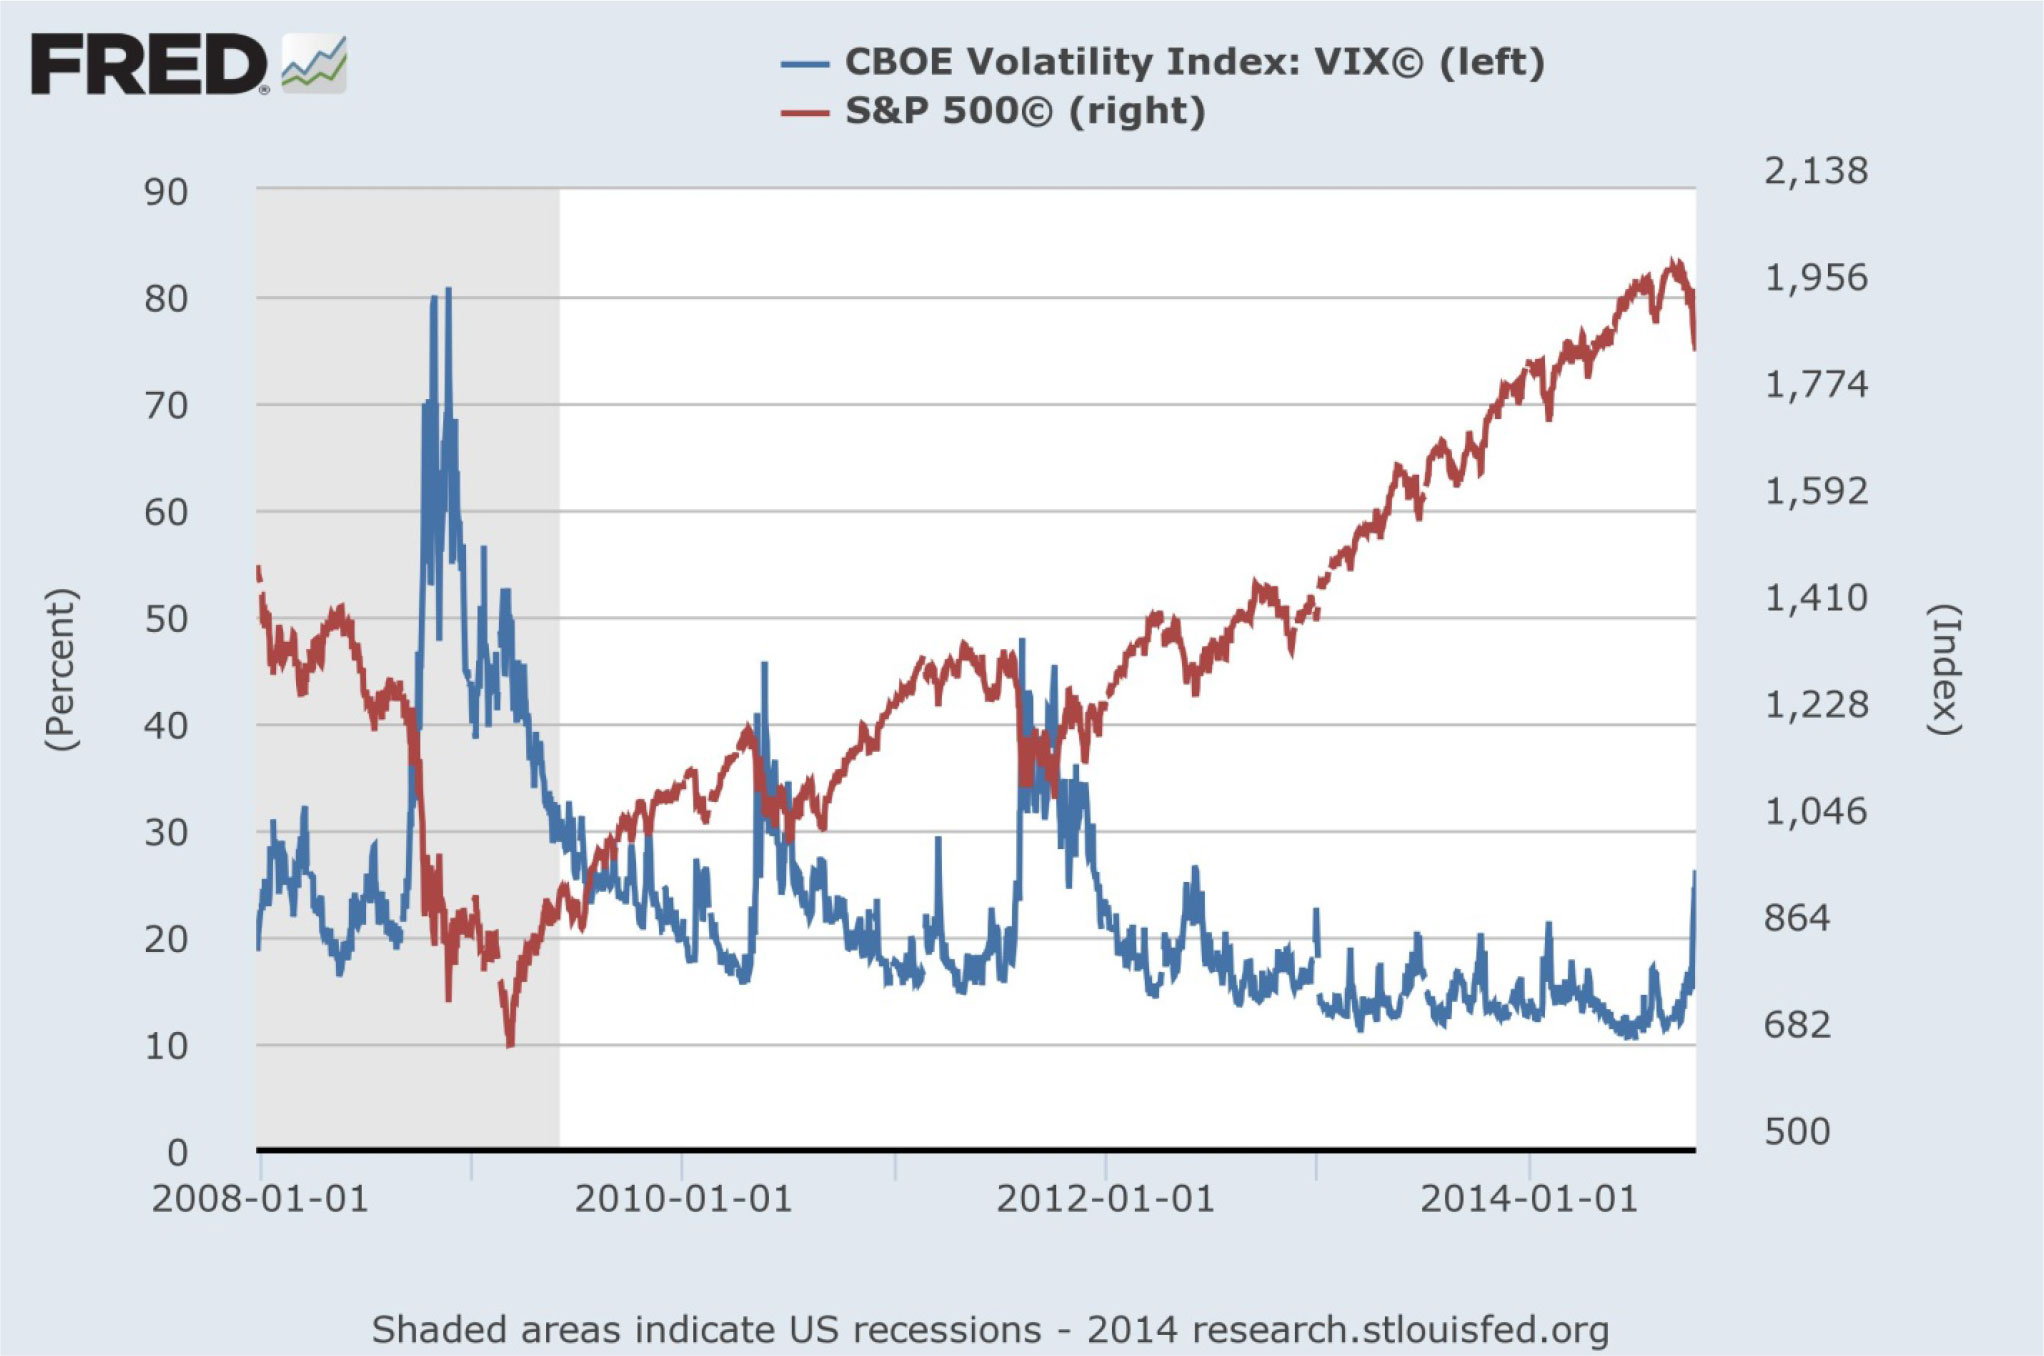
The short lived October market volatility is fresh on the minds of investors. Questions are being posed as to the volatility being a sign for a serious correction yet to come or simply a bump along the road to higher highs. The stock market rise since 2013, using the S&P 500 Index as a proxy, has decoupled from economic fundamentals while coinciding with the third round of Quantitative Easing (QE3) by the Federal Reserve. At the end of last year, the Federal Open Market Committee (FOMC) announced the beginning of tapering for its mortgage and Treasury bond buying program which is to end this month. The following chart plots the movement of the S&P 500 Index and the quarterly real GDP change. A pattern seems to emerge that, each time when a QE program comes to an end, the stock market retreats. The end of the bond buying program under QE3 does not mean that the Federal Reserve will begin to shrink its bloated balance sheet or to stop reinvesting all the interests back into bonds. Yet, it appears that investors are again feeling fearful that the withdrawal of the unlimited support and liquidity they have grown accustomed to and dependent on will re-price all assets.
All About US Labor – the Two Handed Economist
Janet Yellen’s speech1 at the August Jackson Hole economic symposium sponsored by the Kansas City Fed was all about the labor market and the monetary response. She is clearly concerned about the “slack” in the labor market even though there have been significant improvements since the Great Recession. To foster maximum employment is one of the two monetary objectives of the Federal Reserve. Therefore, monetary policy must reflect an ongoing assessment of a wide range of information in the context of the Federal Reserve’s ever-evolving understanding of the economy.
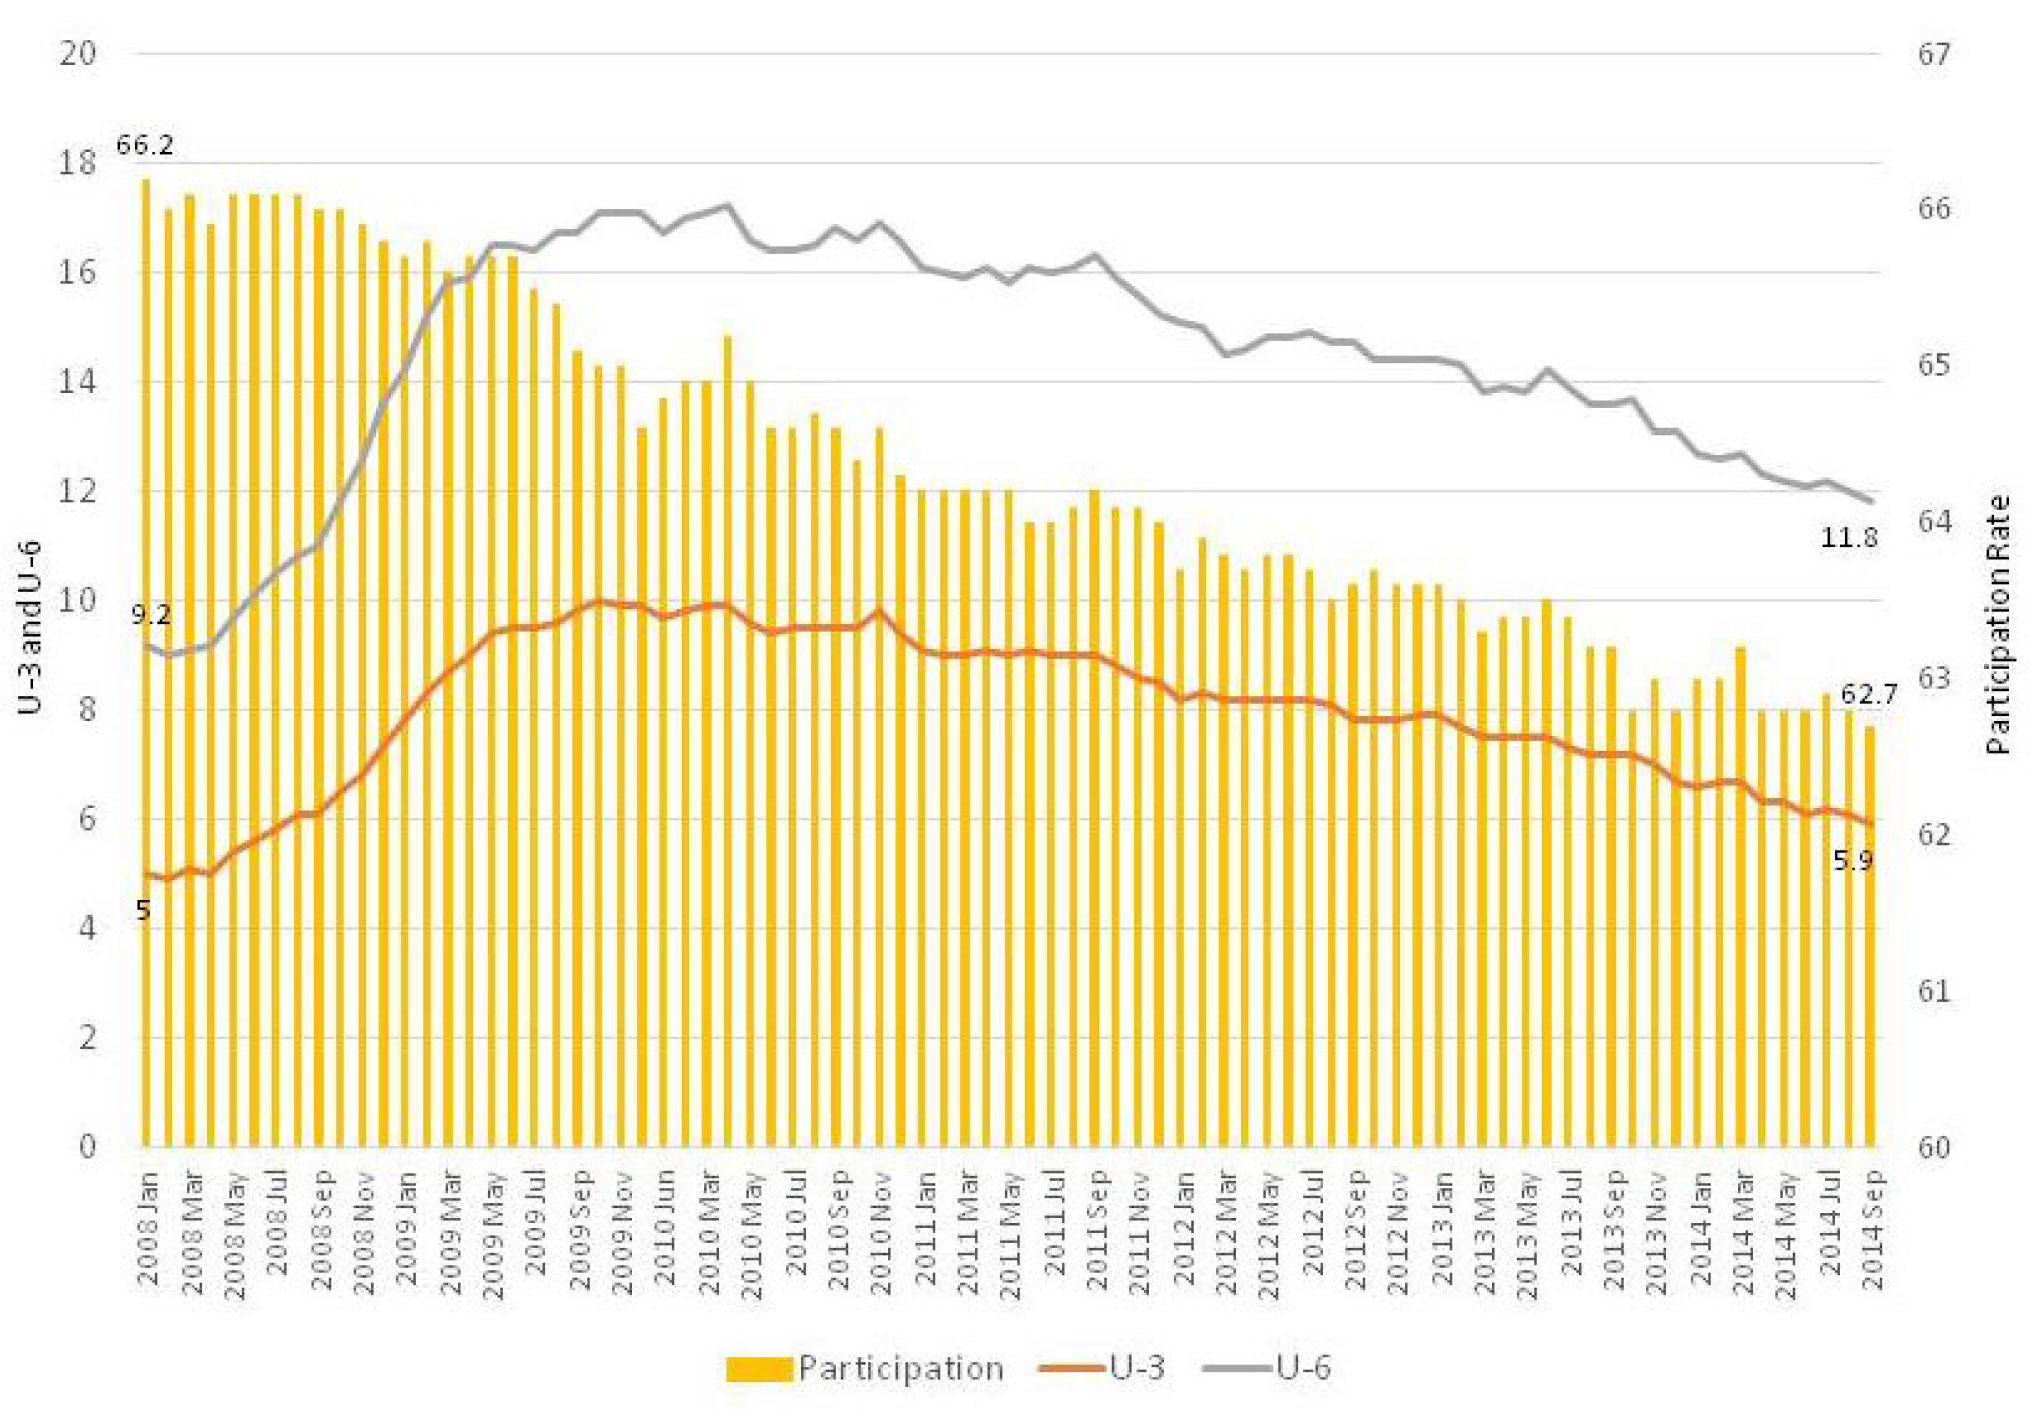
One of the difficulties in estimating labor slack is the judgment about the magnitude of cyclical and structural influences affecting the labor market variables. Cyclical factors such as labor participation rate, part-time employment the paces of hires and quits, and structural factors such as aging workforce and workforce polarization of hollowing out middle-skill jobs must all be taken into account. The chart below shows the U3 unemployment rate started at 5% in January 2008 and in September was at 5.9%2. This has exceeded the 6.5% threshold which the Federal Reserve has abandoned as a possible trigger for rate normalization. However, the broader U6 rate remains in double digit territory at 11.8%. The U6 rate includes total unemployed rate of U3, plus all persons marginally attached to the labor force, plus total employed part time for economic reasons, as a percent of the civilian labor force plus all persons marginally attached to the labor force.
At nearly 5% of the workforce, the part-time workers desiring full-time work is a sign of slack in the labor force, but this may be reflecting the misalignment of skills needed and jobs available. The continuing decline of middle-skill jobs may be a structural rather than cycle condition. It is this stubbornly high U6 rate with a progressively lower participation rate (66.2% in January 2008 to 62.7% in September 2014) that is disconcerting to the Federal Reserve. There is some evidence that the participation rate drop has began to flatten out. As the economy continues to recover, the improving labor demand is expected to pull an increasing share of discouraged workers back into the labor market. One structural factor is the systematic pull-forward of future retirees in a weak economy since the Great Recession. The Federal Reserve staff has developed a composite using 19 labor market indicators. This broad based metrics continues to suggest that the decline in the U3 rate somewhat overstates the overall improvement in the labor market conditions.
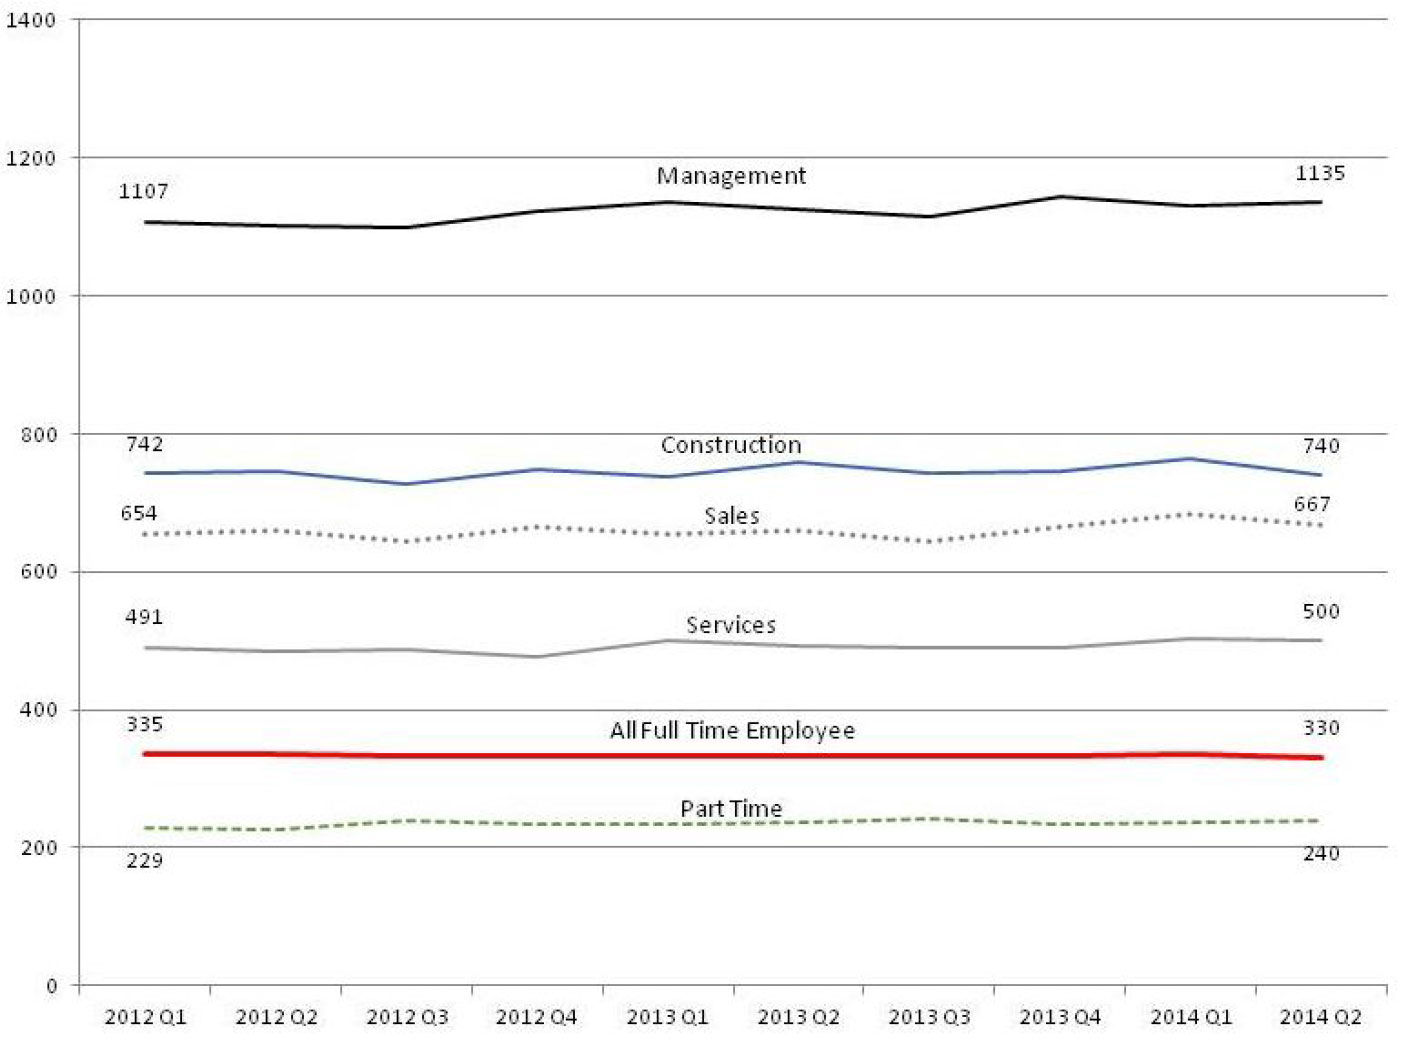
Another indicator is wage growth, which has been flat. Using “median usual weekly earnings – in constant (1982-84) dollars” data (excluding self-employed) from the Bureau of Labor Statistics, the following graph shows a flat line for real wage growth across all job categories except management. In fact, the real wage growth for all full-time employees is a slight negative since 2012. Since real wage movements have historically been sensitive to tightness in the labor market, this recent trend points to a weaker labor market than what the decline in U3 rate would indicate otherwise. It is important to note, however, that the flat wage growth may partially be explained by downward nominal wage rigidity or wage deflation. This means that employers were reluctant to cut wages during the recession and now are slow in raising wages as the economy recovers.
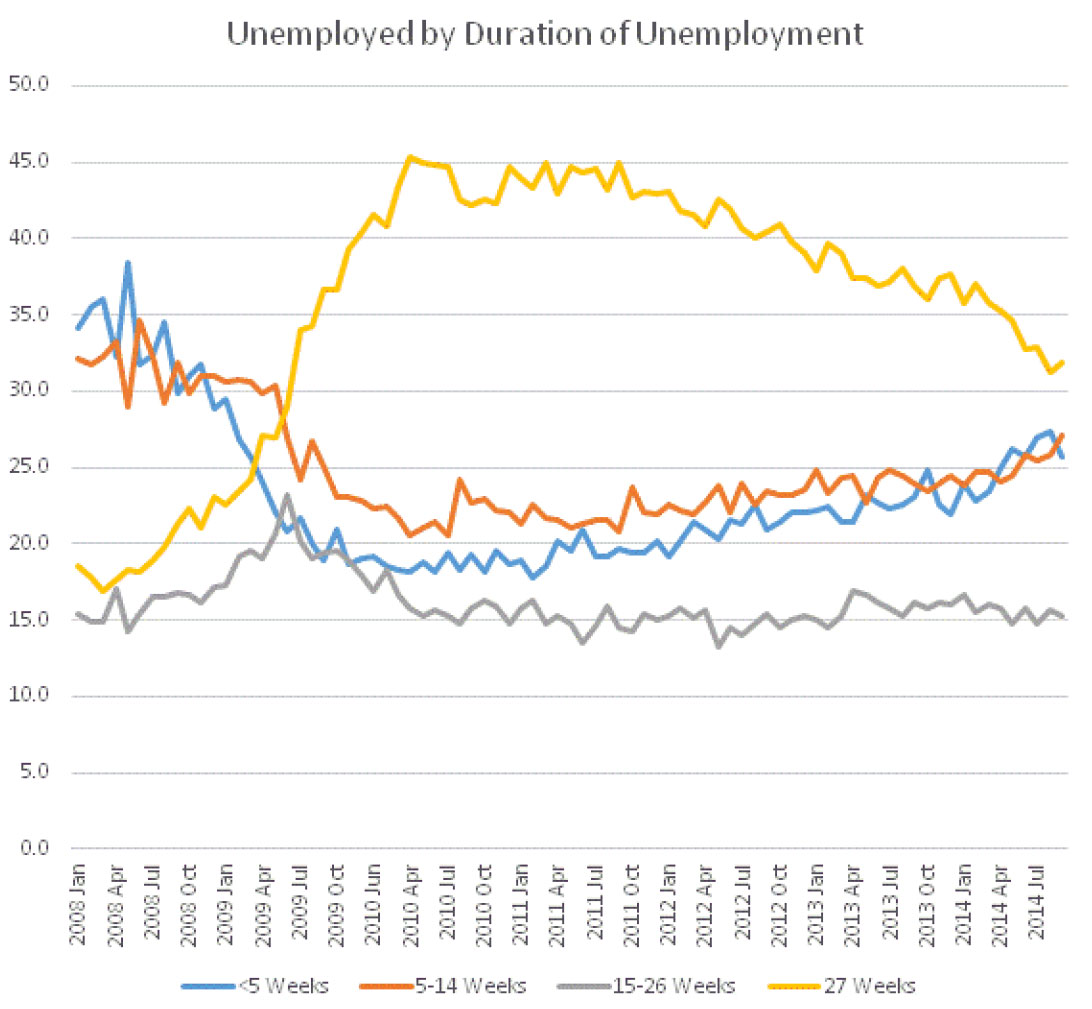
Another indicator is the duration for the long-term unemployed. Most recent data from the Bureau of Labor Statistics informs us that, although the long-term unemployed (as defined by being out of work for 27 weeks or longer and still looking for work) has gradually reduced from early 2010, it remains stubbornly high at over 30% of the total unemployed population. Although there is no clear answer if this is caused by cyclical or structural factors, it is clear that the longer workers are unemployed, the less they will reenter the labor force. This may be evidence to skill mismatch or the lack of mid-skill jobs.
Ultimately, the issue of labor slack has ramifications for price stability or inflation. Historically, labor slack has only accounted for a small portion of inflation. More broadly, however, the lead-lag relationship between a tightening labor market and rising inflation pressure may have altered as a result of the aftermath of the Great Recession. On the one hand, the delay in observing real wage growth and the increased pace in labor slack reduction could contribute to a delay in the Federal Reserve tightening sooner even though this may cause the tightening to be more abrupt (thus potentially disruptive) when inflation pressure suddenly appears when meaningful real wage growth materializes. On the other hand, as real wage increases, that would draw more unemployed back to the labor force and continue to put downward pressure on real wage growth. As such, tightening monetary policy as soon as the target inflation floor of 2% is reached may prevent a full labor market recovery sooner.
FOMC – Steady as it goes
The statement3 issued at the end of the two day meeting on September 17th was more of the same. The economy continued to expand moderately while the labor market improved somewhat with significant underutilization remaining. The FOMC affirms the continuing reduction in bond purchases as the QE asset purchase program is systematically being wound down by next meeting (this week) while continuing to maintain its oversized balance sheet. The much anticipated change in the forward guidance language regarding interest rate normalization failed to materialize. FOMC “continues to anticipate, based on its assessment of these factors, that it likely will be appropriate to maintain the current target range for the federal funds rate for a considerable time after the asset purchase program ends, especially if projected inflation continues to run below the Committee’s 2 percent longer-run goal, and provided that longer-term inflation expectations remain well anchored.” Furthermore, the “Committee currently anticipates that, even after employment and inflation are near mandate-consistent levels, economic conditions may, for some time, warrant keeping the target federal funds rate below levels the Committee views as normal in the longer run.”
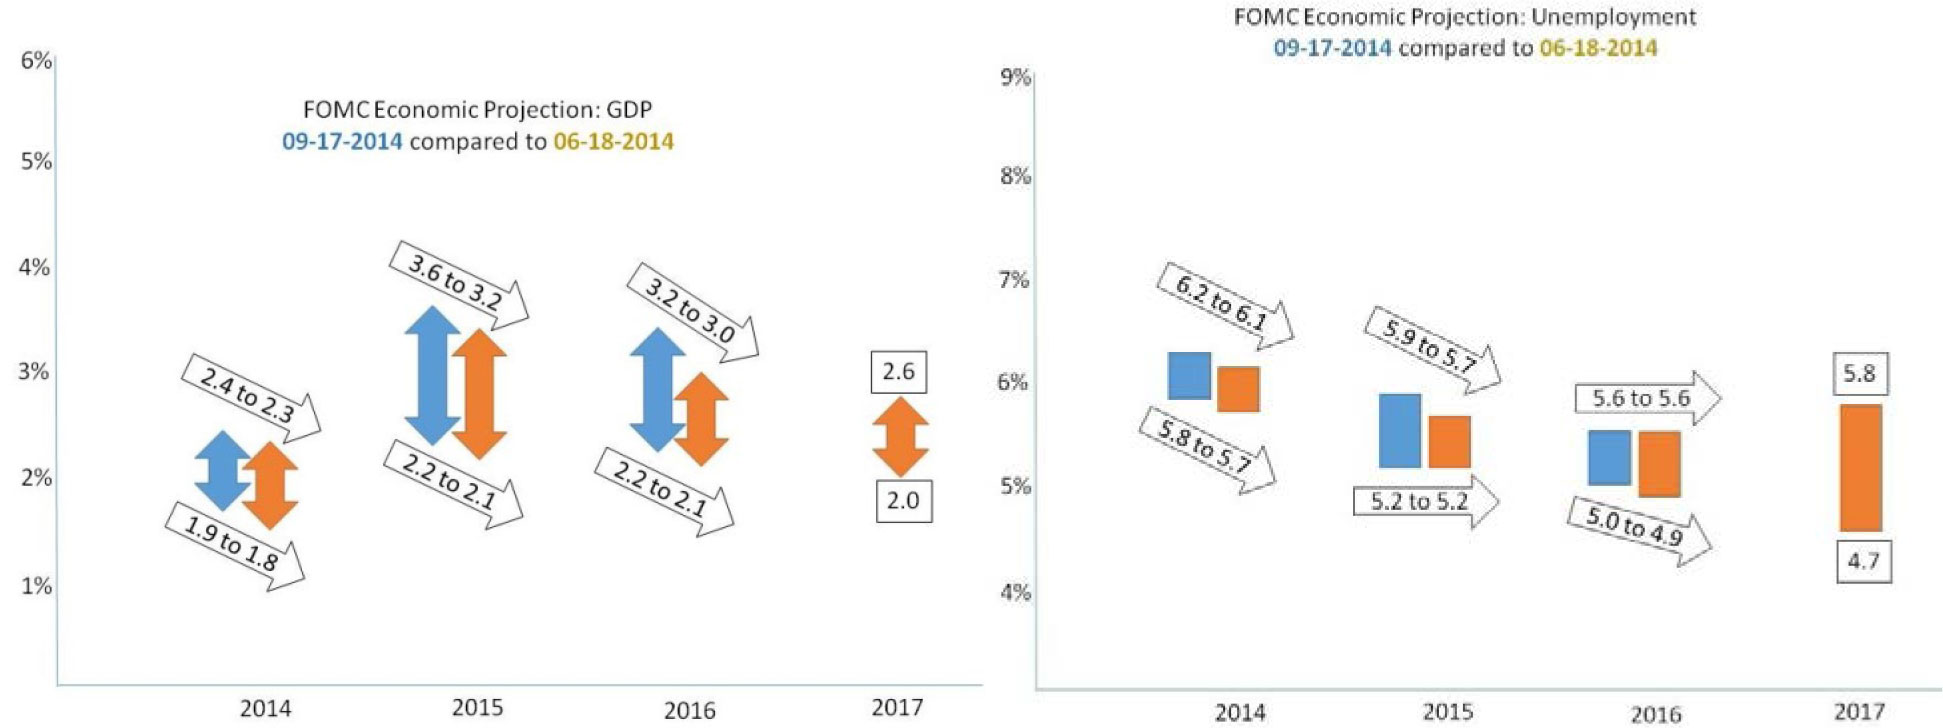
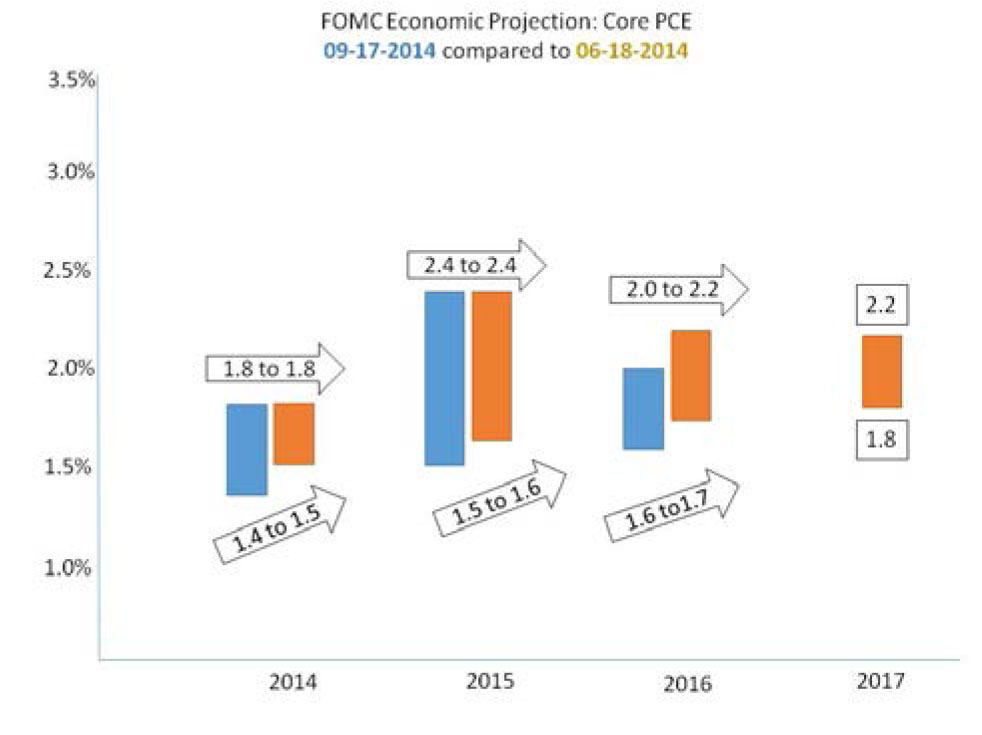
Four times a year, the FOMC releases a Summary of Economic Projections4 which offers the range of projections by each participant regarding forward looking (expectation) about real GDP, unemployment rate, PCE inflation and core inflation rate. It is important to note that these are individual estimates and do not necessarily reflect the view of the FOMC. The following is a graphic summary of the most recent projections:
The unemployment (U3) rate range is expected to drop from a 6.1%-5.7% to 5.8%-4.7% range in 2017. The range shows higher lows and lower highs which suggest the unemployment rate is expected to improve slowly. GDP is expected to range from 1.8%-2.3% this year to 2%-2.6% in 2017. This revision downward is in line with the overall projection of an even more moderate expansion going forward. In the case of core inflation as measured by the core PCE rate, the range is getting closer to the 2% target in 2016 and beyond.
Finally, the 16 FOMC participants’ assessment for appropriate timing of policy firming (begin to normalize interest rates) is as follows:
| 2014 | 2015 | 2016 | |
|---|---|---|---|
| Number of participants | 1 | 12 | 3 |
The statement issued from the FOMC meeting that concluded on October 29 is unchanged from the statement issued from the prior meeting as so expected – steady as it goes!
Legacies, Clouds, Uncertainties
On October 8th, the meeting minutes5 for the September 16th-17th meeting were released. As a part of summarizing the participants’ views regarding economic activity abroad and its possible impact on the U.S. economic outlook, a number of uncertainties and risks were identified:
- Foreign exchange value of the USD has appreciated (may slow economic expansion and inflation).
- The persistent shortfall of economic growth and inflation in the euro area
- Slowing economic growth in China and Japan
- Unanticipated events in the Middle East or Ukraine
In advance of the 2014 annual meetings of World Bank and IMF in Washington, the IMF released its World Economic Outlook6. The sub-title of the report is “Legacies, Clouds, Uncertainties.” In short, the uneven global growth is slowing. The global growth rate has been revised down from 3.4% to 3.3% for 2014 and 4% to 3.8% in 2015. In the advanced economies, the growth rate is projected to be 1.8% for 2014 and 2.3% for 2015 as compared to 4.4% and 5% for the emerging and developing economies. The report identifies the following risks:
- Short-Term Risks
- Worsening geopolitical tensions
- Geopolitical risks have risen and the impact to the macro economy has been contained within those regions. The spillover effects are real with potential widespread disruptions.
- A state of complacency
- As evidenced by a reversal of recent risk spread and volatility compression in financial markets in the past 12 months, the implication and pace of the central bank tightening created risks have not been fully priced in by the market.
- Worsening geopolitical tensions
- Medium-Term Risk
- Stagflation and low potential growth in advanced economies
- A decline in potential growth in emerging markets
Show Me the Money – Late is Better than Never
European Central Bank President Mario Draghi’s speech on July 26, 2012, at the Global Investment Conference in London7 included the now famous line: “Within our mandate, the ECB is ready to do whatever it takes to preserve the euro. And believe me, it will be enough.” Since then we have witnessed the compression of borrowing rates for even the peripheral European countries, labeled PIIGS, to be back to “normal”. What is even more spectacular is that all of this was accomplished without any real action by the ECB. Well that has run its course. The eurozone economic recovery has recently grinded to a halt and the economic psyche has been further spooked by the ongoing Russian aggression against Ukraine. The slowdown also resurfaced the danger of a Japan-like deflation scenario.
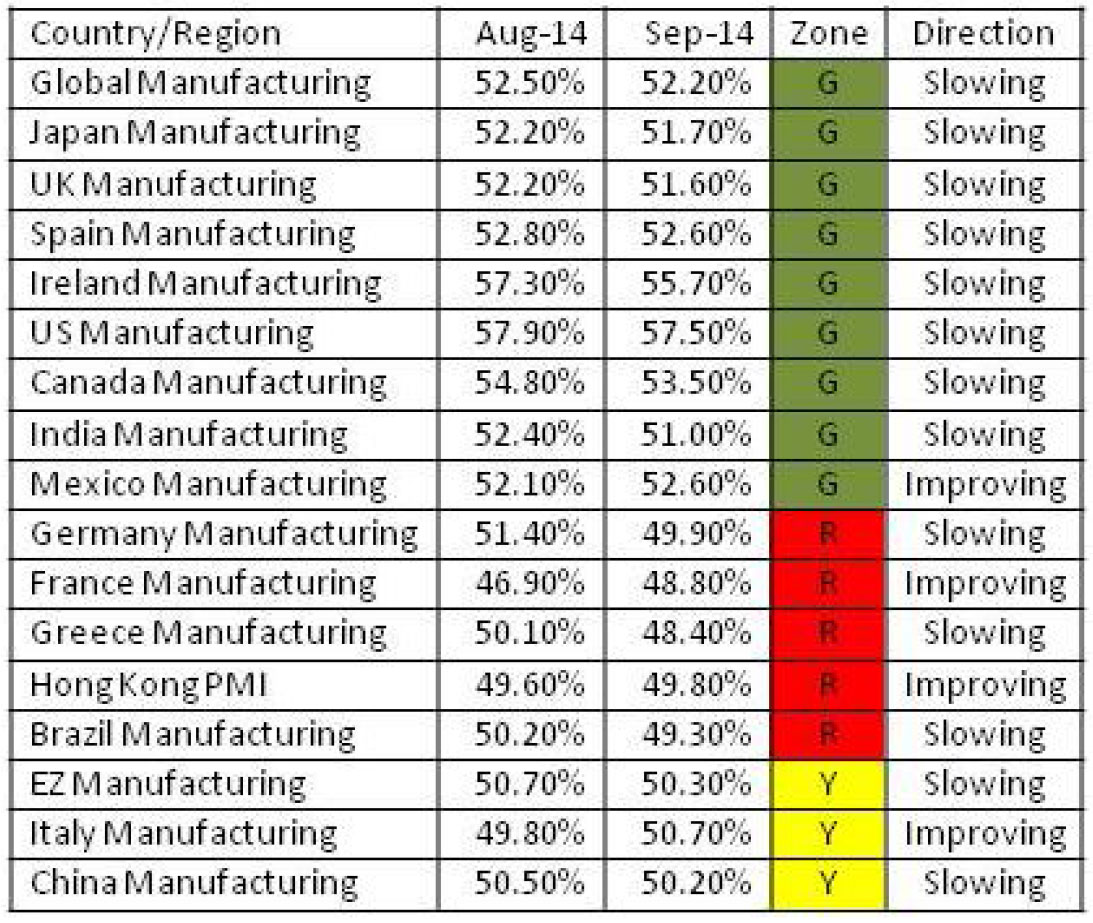
The PMI data provided by Markit over the past two months shows a definitive slowing in manufacturing production in various countries and regions. The green zone includes countries/regions that are in the positive growth (51 or above). Red zone includes countries/regions in the contraction (sub 50) mode. Yellow zone includes countries/regions that are on the edge of possible economic contraction. Additionally, the direction of the indicator is also important. Most of the countries/regions reported by Markit are slowing. In fact, every green zone country/region is slowing.
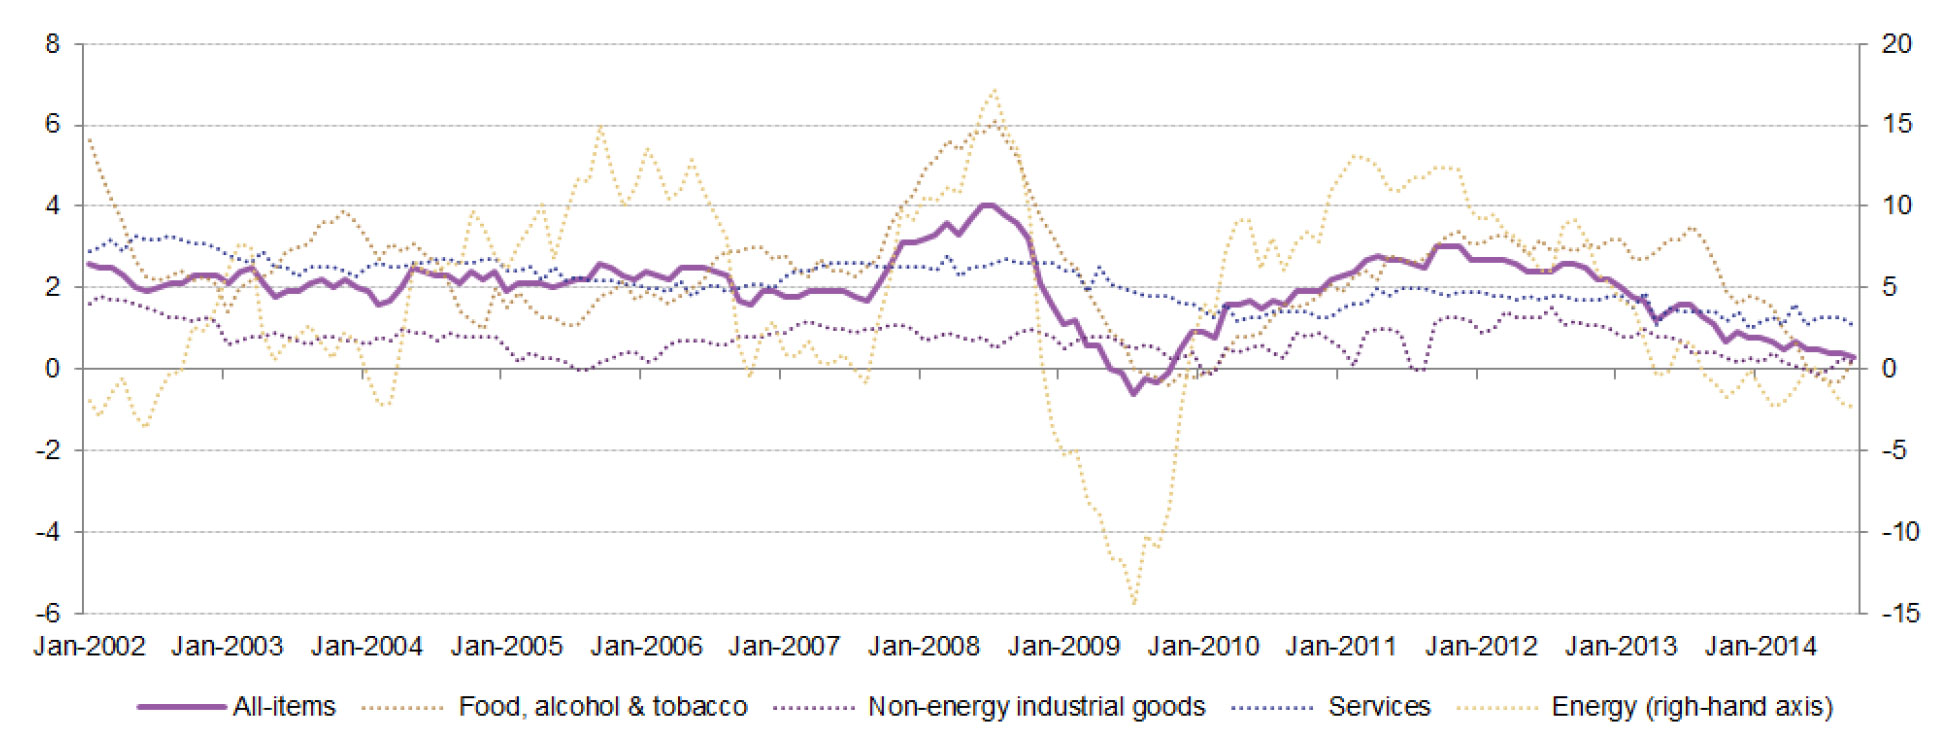
To further confirm the slowing economic activities in the Euro area is the gradual disappearance of inflation. According to eurostat8, the Euro area annual inflation was 0.3% in September 2014, down from 0.4% in August. A year earlier the rate was 1.1%. This is the lowest inflation reading since the depth of the financial crisis in 2009.
In June this year, as a part of Mario Draghi’s effort to spur lending and ultimately economic activities in the eurozone, the ECB cut the rate on its deposit facility for banks from 0% to a negative 0.10%. The idea is to make banks so uncomfortable to keep deposits with the ECB and start lending. The ECB also cut its main interest rate to 0.15% from 0.25%, and cut the rate on its marginal lending facility to 0.4% from 0.75%.
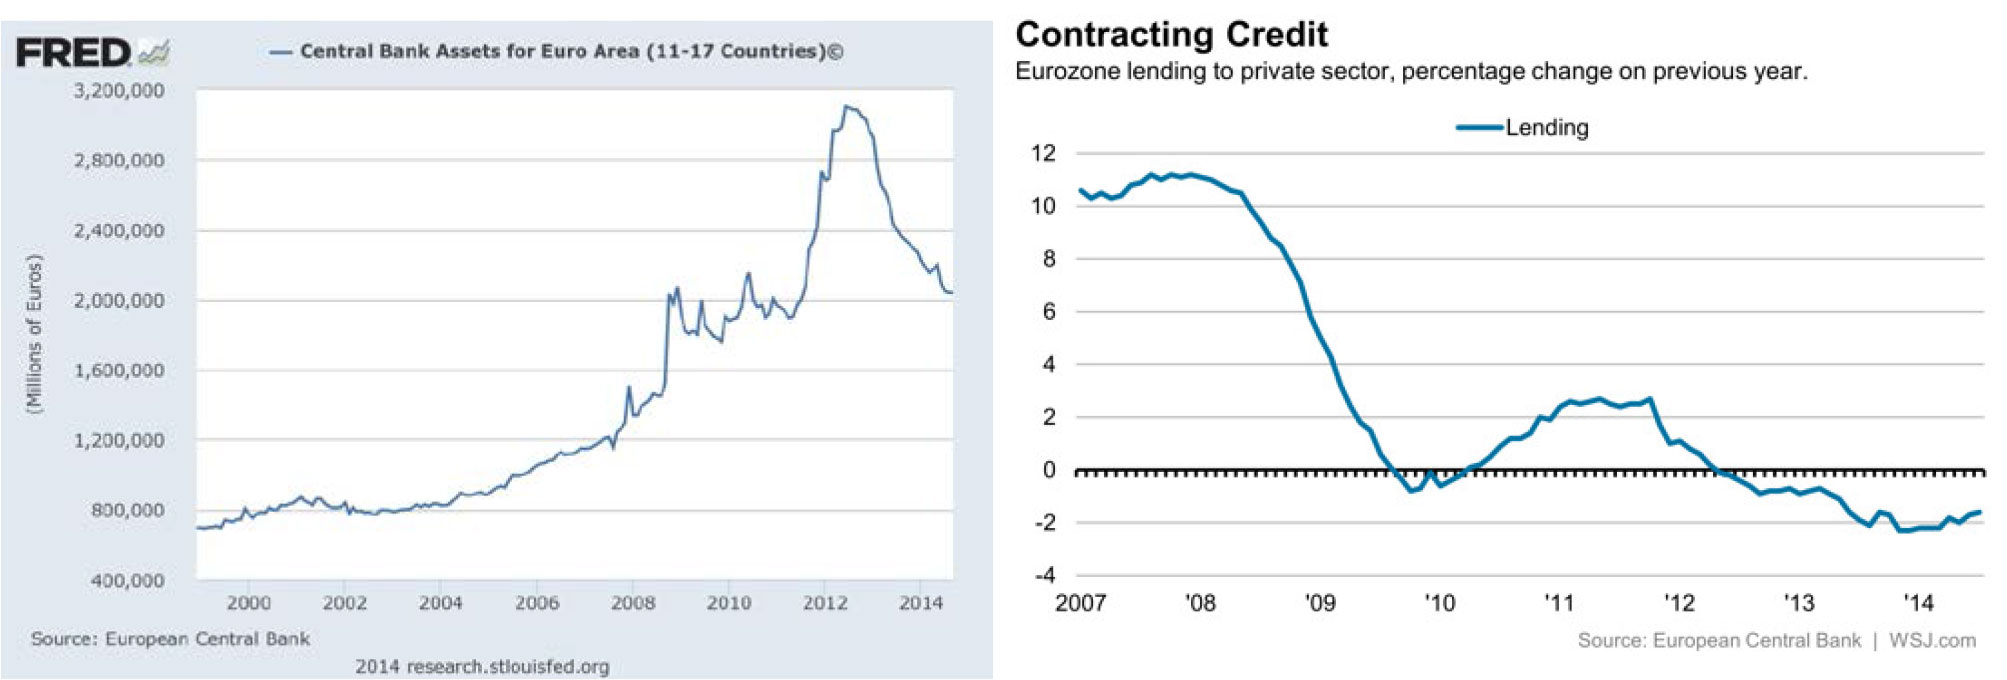
Additionally, the ECB is looking at ways to bring cash/liquidity to the banks as an added effort to push banks to lend to Euro area companies. (Unlike the US, where there is a large public debt/commercial bond market, Europe has always relied on commercial banks to provide financing to companies.) Long-Term Refinancing Operations (LTRO) is one such mechanism. During the height of the eurozone crisis, LTRO was launched to stabilize the banks. Again in 2012, 1 billion euro in low cost LTRO was made available to banks and most of them took the low cost loans to purchase sovereign debt of their own countries and have since been aggressively repaying the loans. At the same time, private sector borrowing has plummeted.
The ECB balance sheet has contracted since its June 2012 value at over 3.1 trillion euros. As of September this year, the balance sheet is at a little over 2 trillion euros.
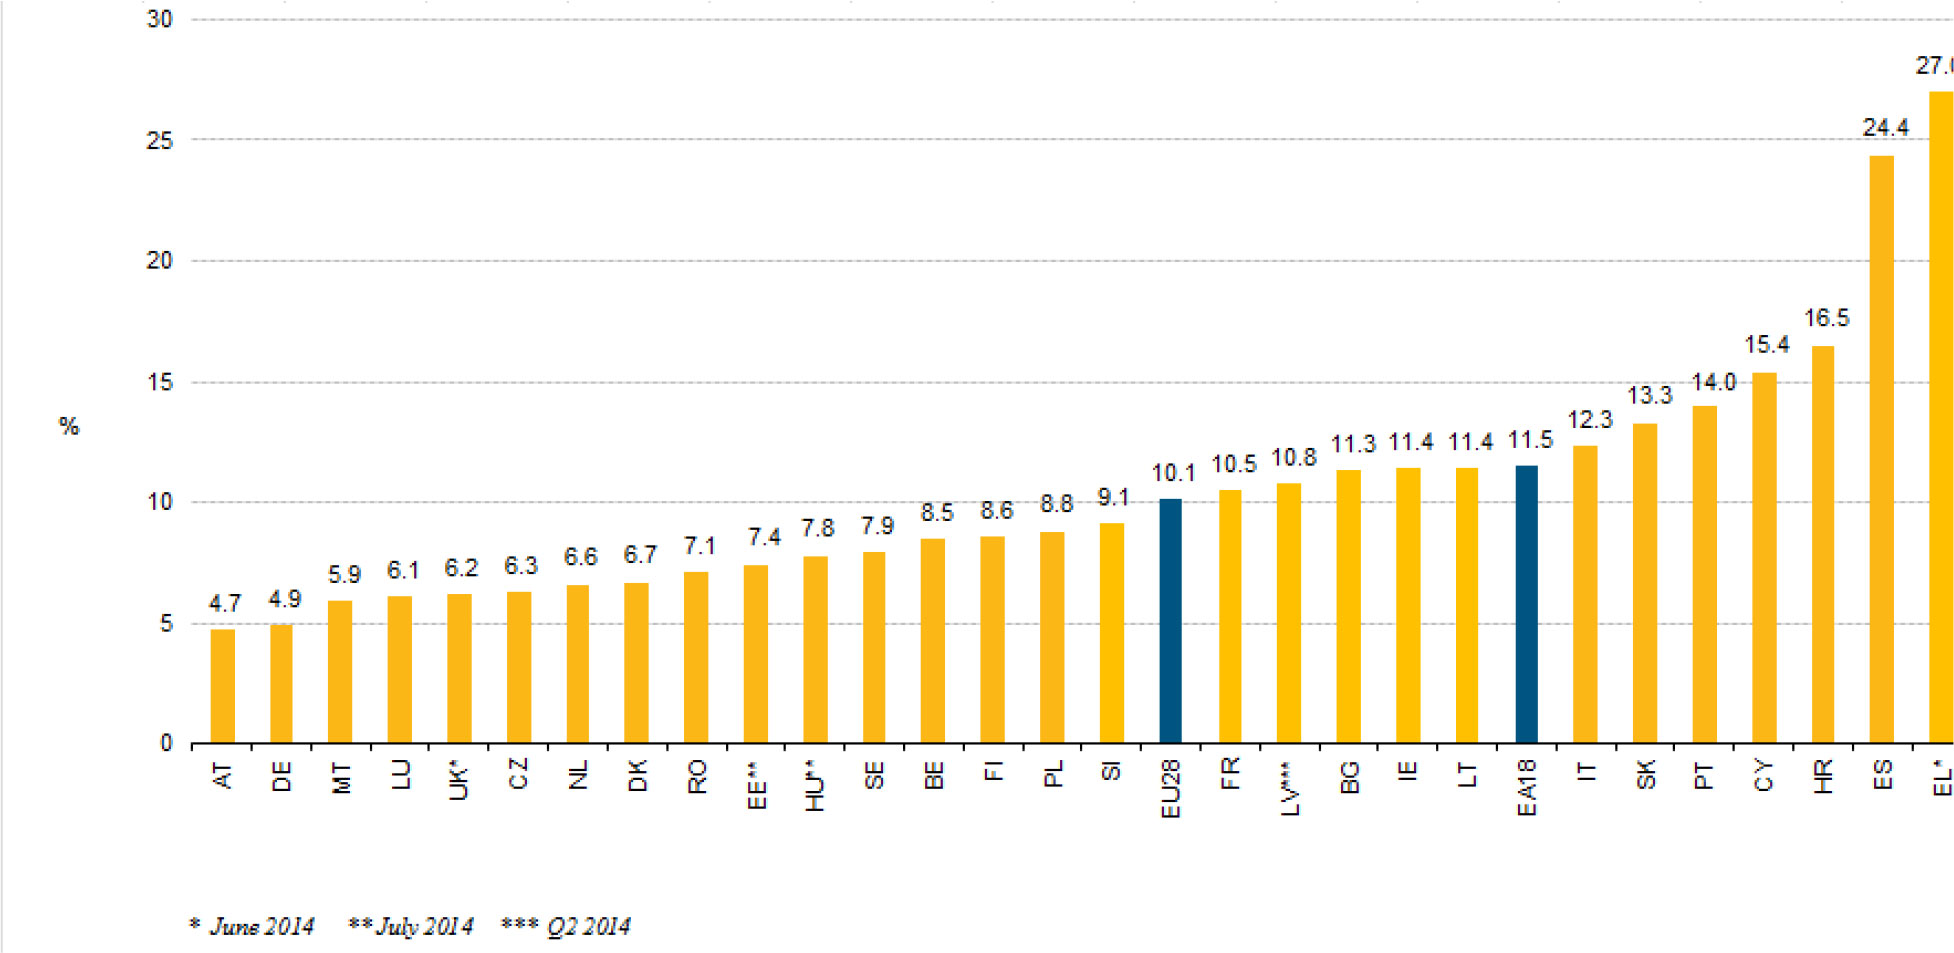
Although full employment is not one of the mandates for the ECB, price stability is ever more challenged when the unemployment rate remains high. In the euro area of 18 countries, the unemployment rate is 11.5%9. In the entire European Union of 28 countries the rate is 10.1%. Eurostat estimates that 24.642 million men and women in the EU-28 (compared to 20 million at the beginning 2000), of whom 18.326 million were in the euro area (EA-18), were unemployed in August 2014. 6 years after the financial crisis and Greece unemployment remains at 27% and 24.4% for Spain. In August, almost 5 million people under age 25 have no jobs in the 28 European Union countries of which 3.3 million are within the euro area 18 countries.
On October 2, Mario Draghi announced the much anticipated large scale asset purchase program10. According to Mario Draghi, up to 1 trillion euro of bonds are eligible for purchase. This is expected to further enhance the functioning of the monetary policy transmission mechanism, facilitate credit provision to the broad economy and generate positive spillovers to other markets. Beginning in the middle of October, ECB will begin purchasing broad portfolio of euro-denominated covered bonds11. The purchases of these bonds will be distributed across the euro area and will be carried out progressively by means of direct purchases conducted in both the primary and secondary markets. Also in October, ECB will begin an asset-backed securities purchase program12 by buying senior and guaranteed mezzanine tranches of asset-backed securities (ABSs) in both primary and secondary markets with ratings of a second-best credit assessment of at least CQS3, currently equivalent to an ECAI rating of BBB-/Baa3/BBBl. Greek and Cypriot bonds will be eligible. These programs will continue for at least two years. Together, with the series of targeted longer-term refinancing operations to be conducted until June 2016, these purchases are expected to bring the balance sheet back to the 2013 June level.
The Mighty Dollar
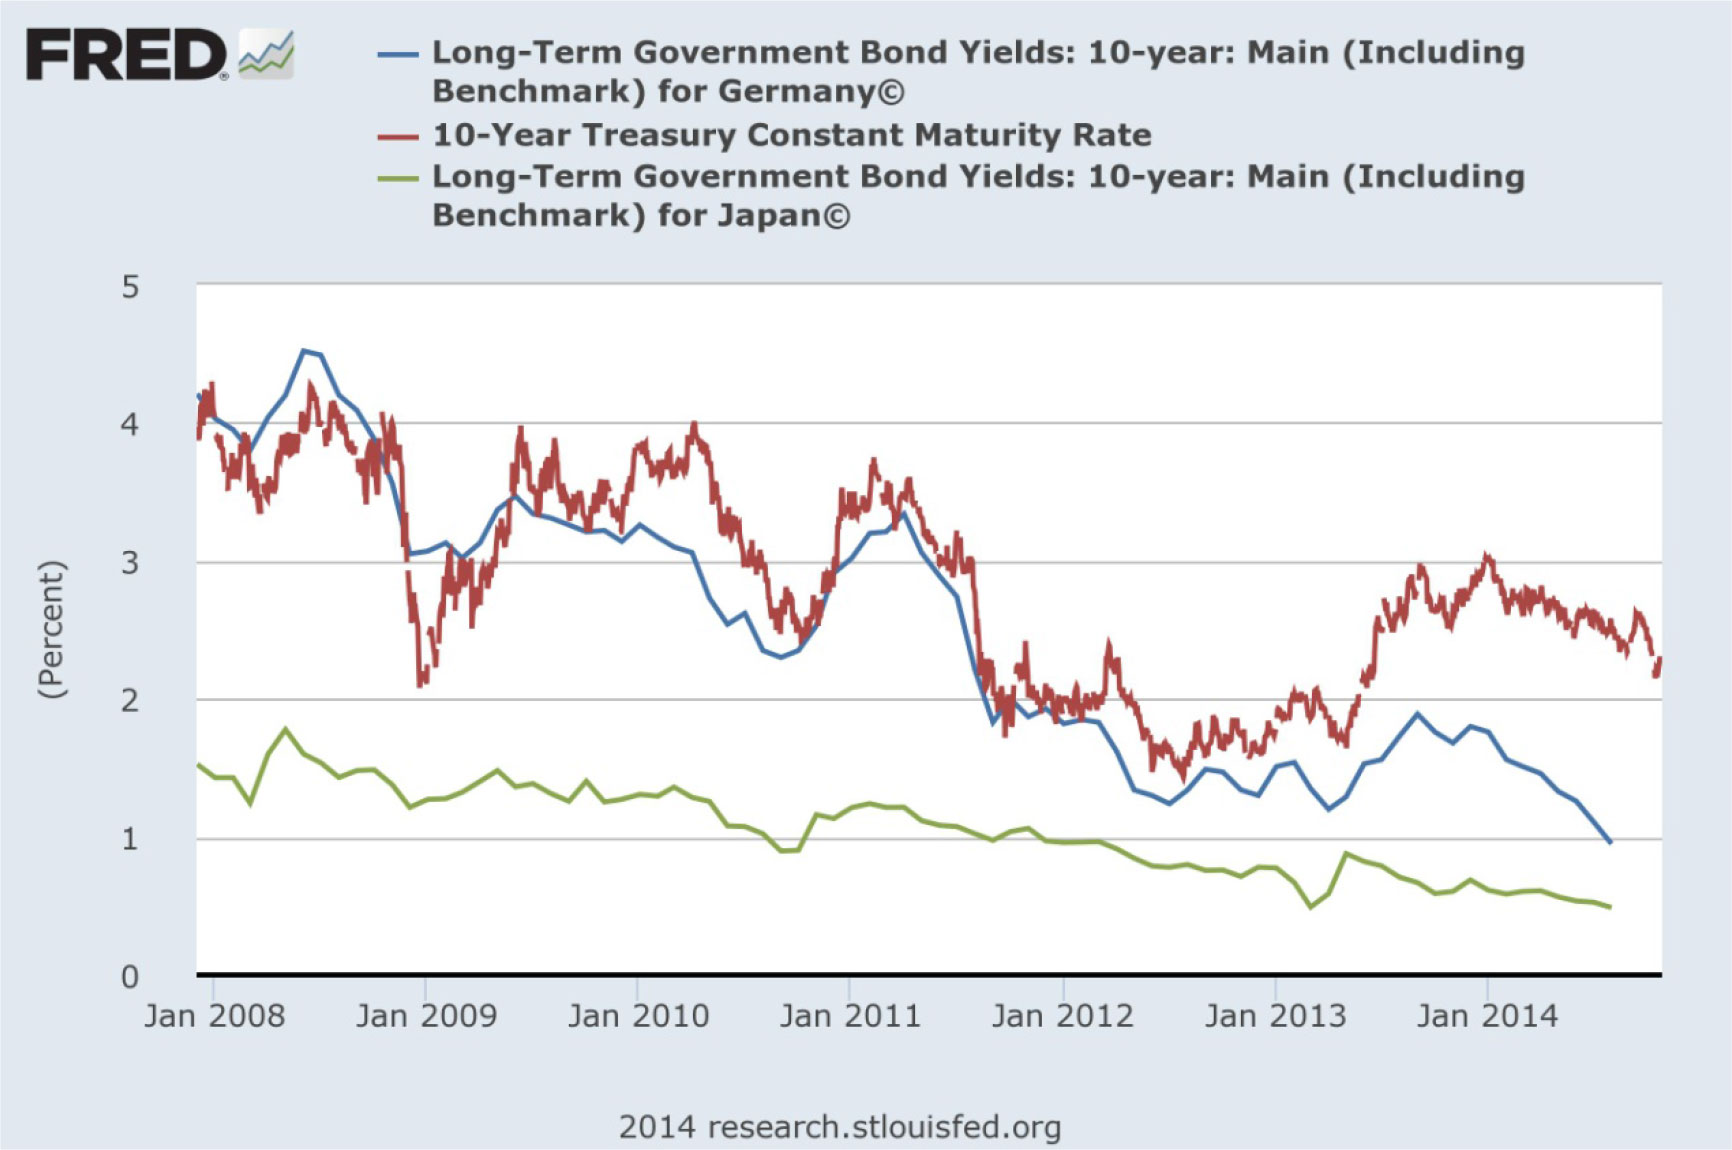
“The cleanest dirty shirt in the laundry” remains the operative phrase for the US when compared to the rest of the developed world. Geopolitical conflicts in Eastern Europe and the Middle East, saber rattling in the South China Sea, and the fear of an Ebola outbreak have all contributed cyclically to safe assets. Although the US 10-year rate has reached almost 2% recently, it is a “great” safe yield when compared to the German Bunds at a low of 0.76% on October 15 and 0.47% yield today for the Japanese government bonds.
On October 14, the German government announced a revision of growth for 2014 from 1.8% to 1.2%. This is a huge revision when there is only 2.5 months remaining in the calendar year. The 2015 growth rate is also revised down from 2% to 1.3%. With fear of deflation and disinflation in Europe and the perennial economic malaise in Japan, interest rates in these regions will continue to remain low for extended periods of time. Due to the disparity of where each region is in the economic cycle and the different stages of central bank policies, the US, and thus US assets, are better positioned. This leads to a reasonable conclusion that US dollar strength is likely to continue next year and beyond.
Oil Based Economy
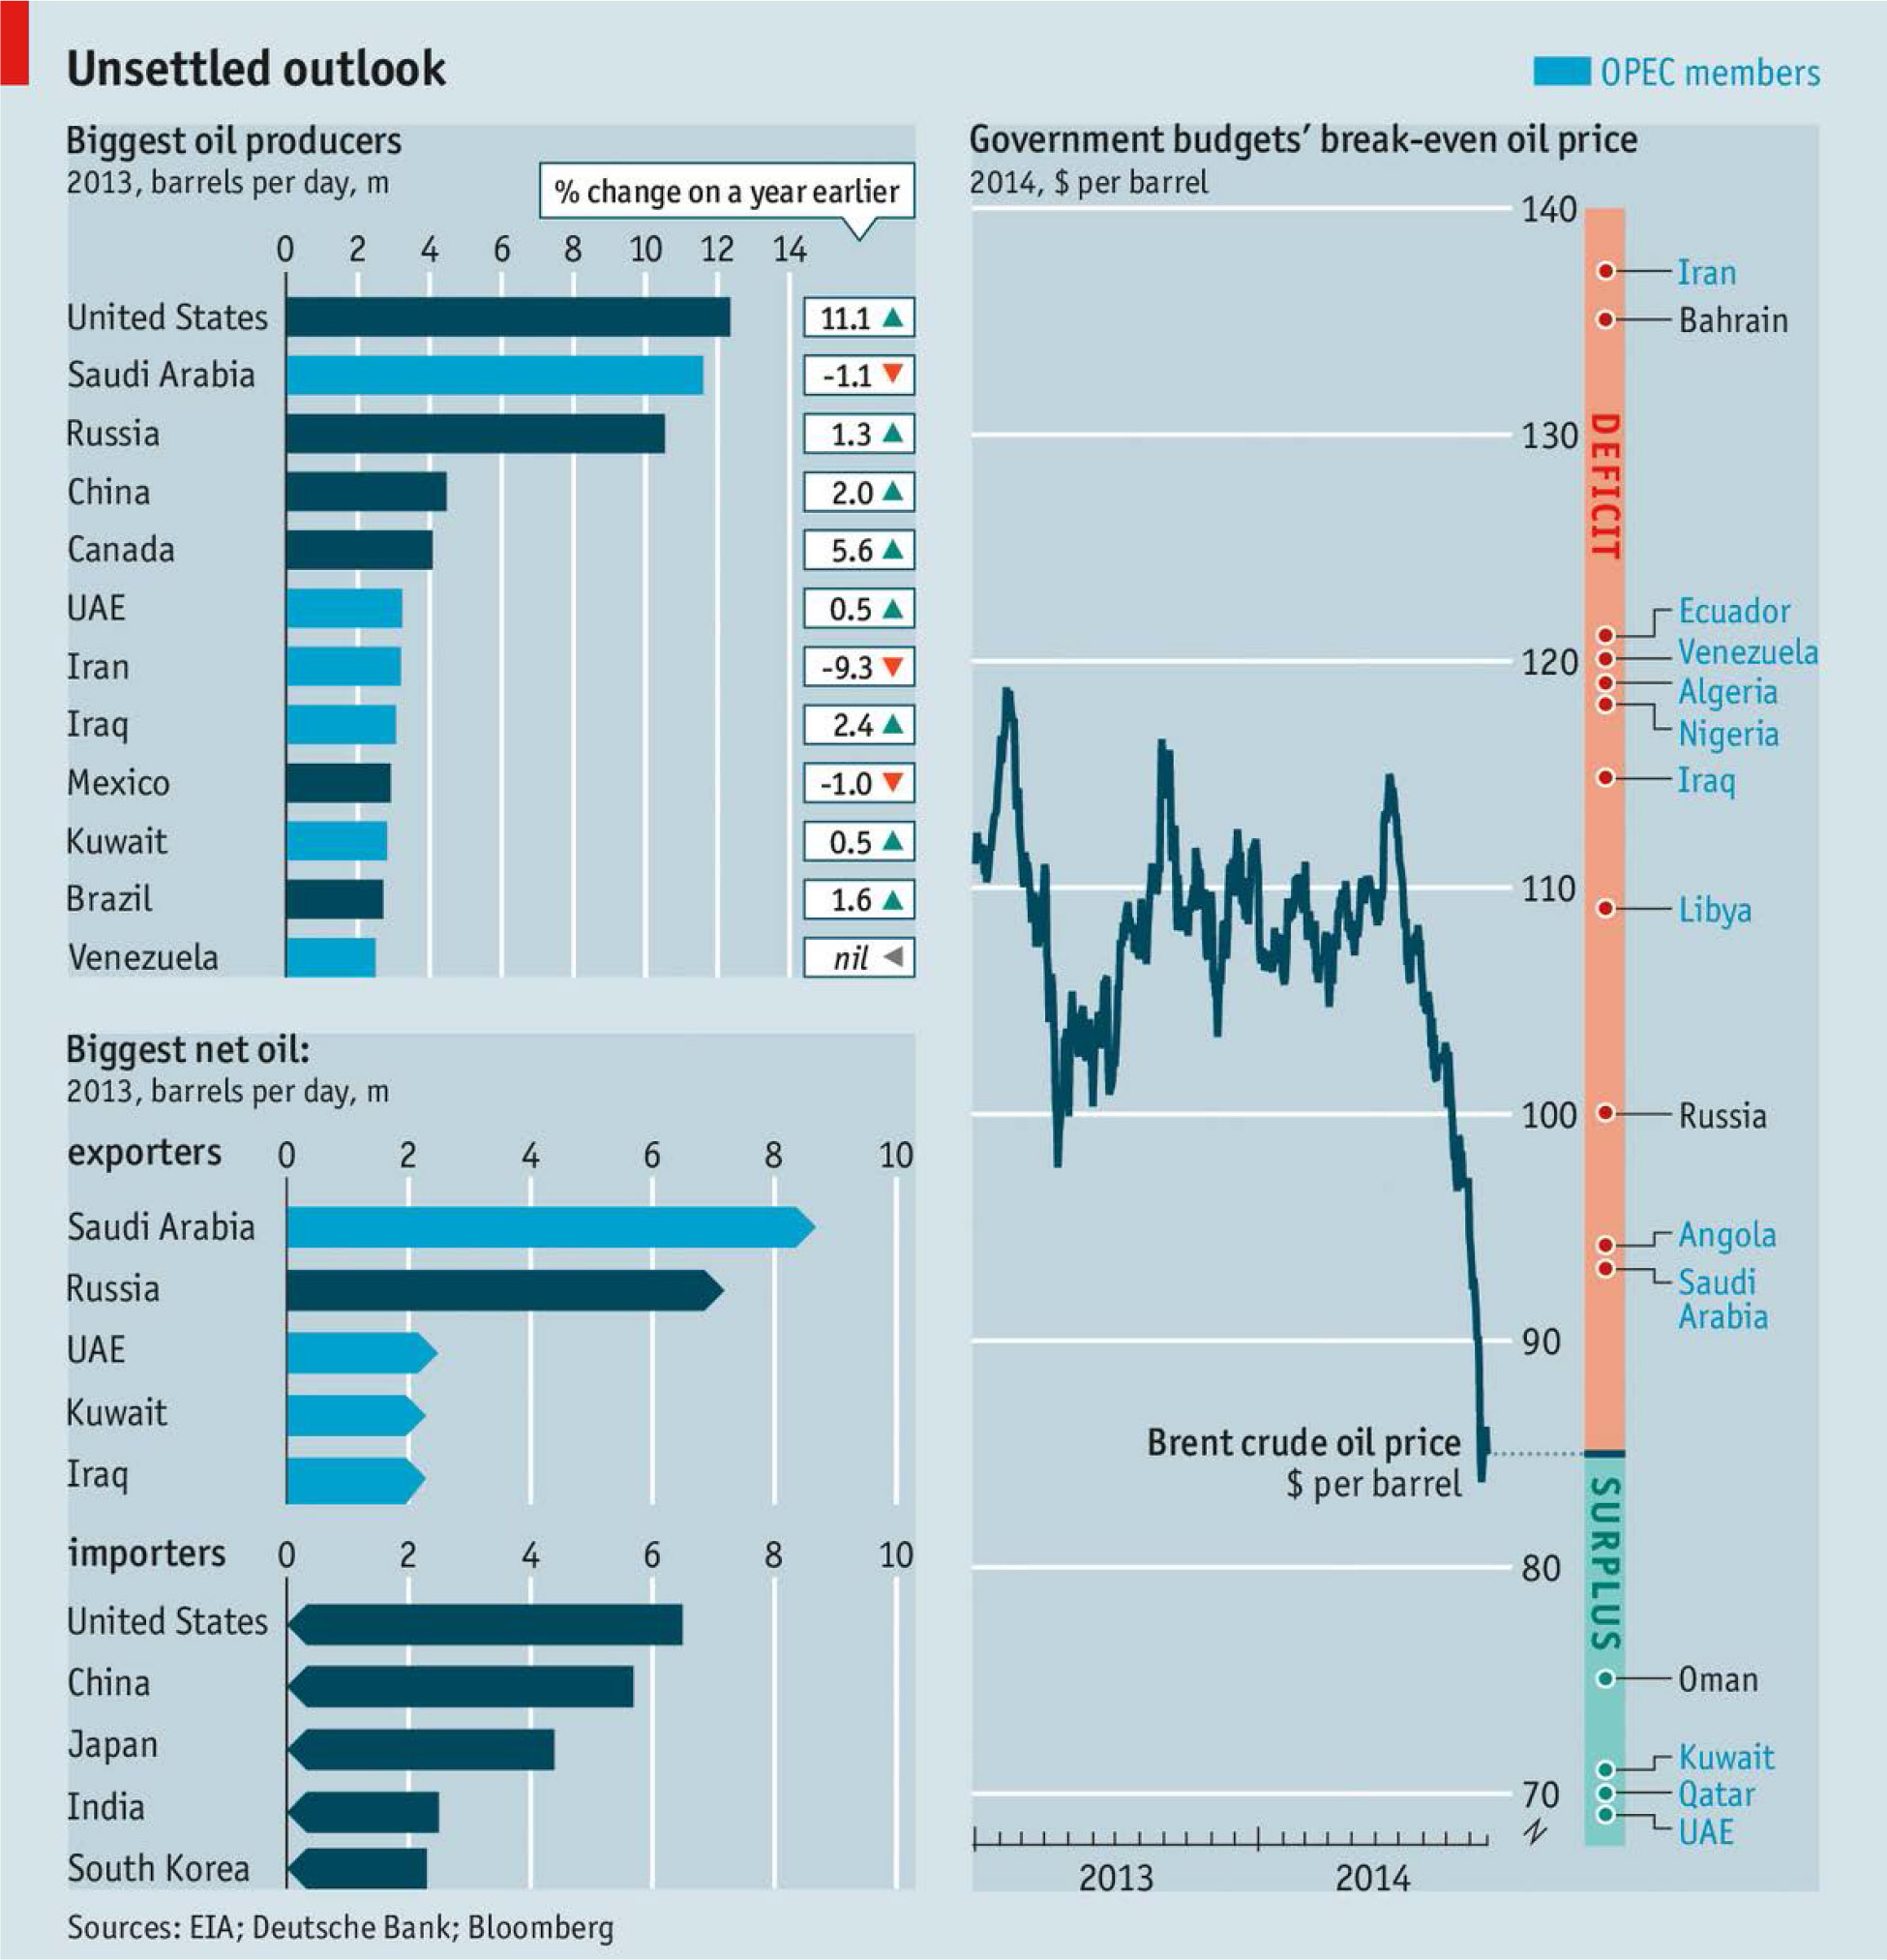
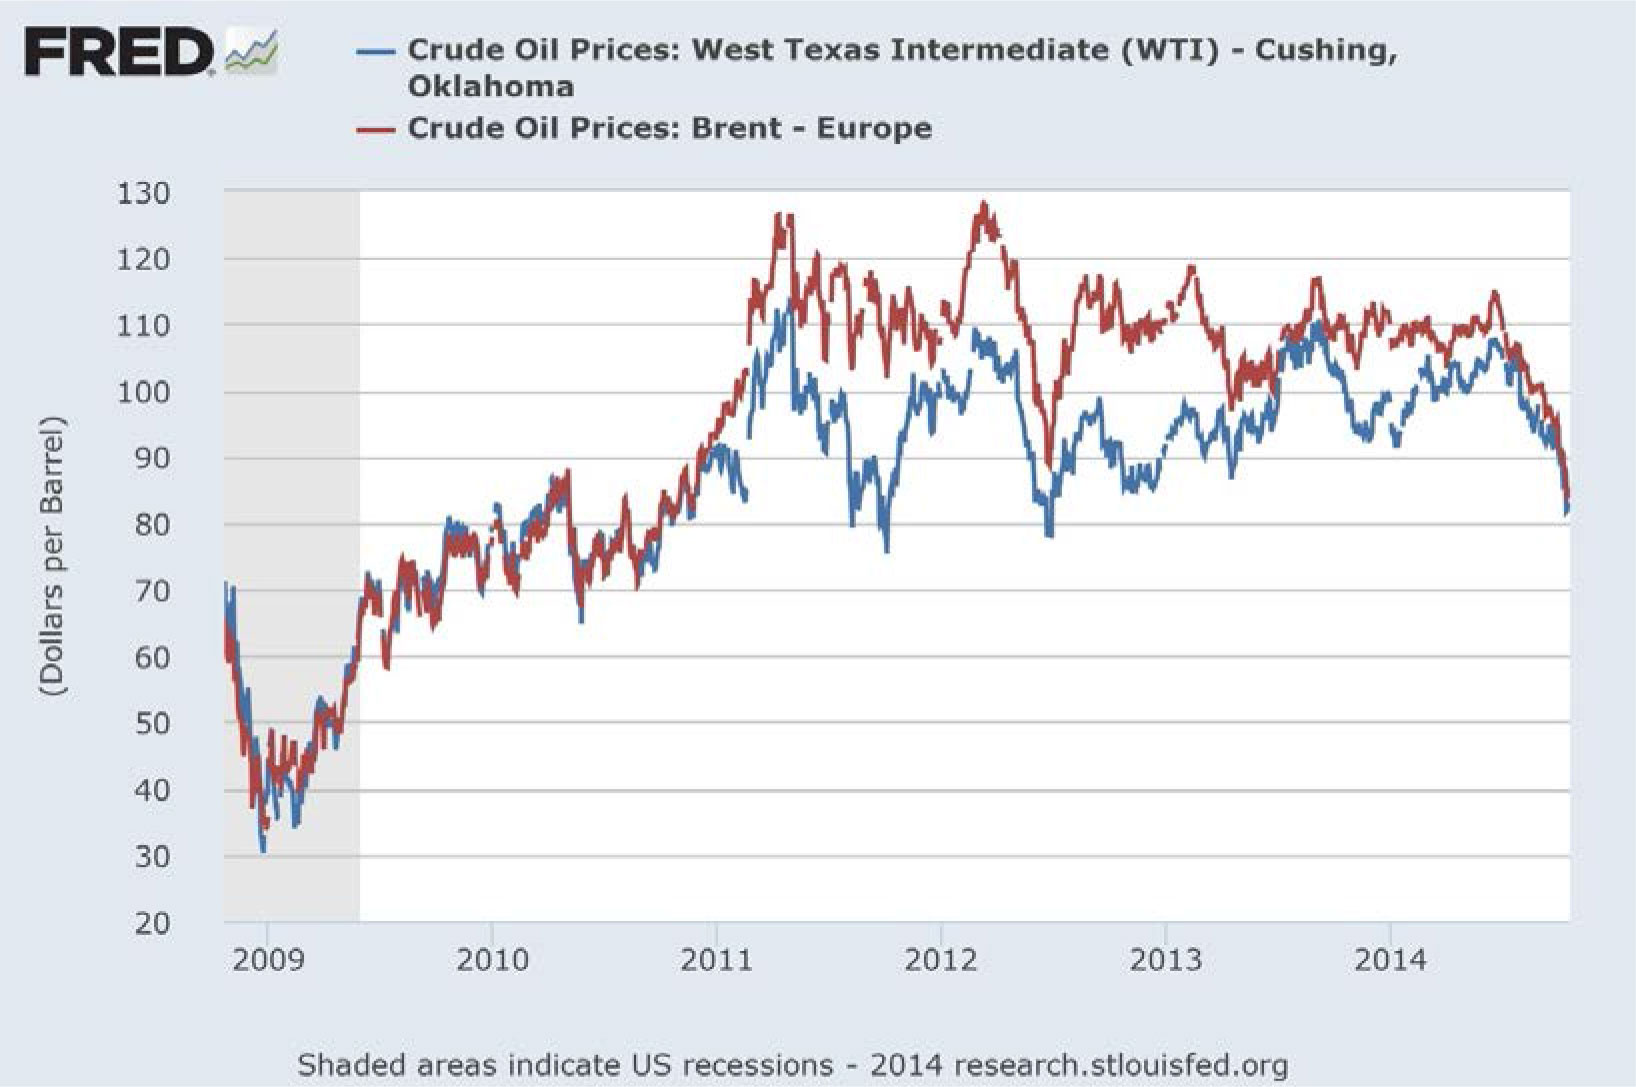
A combination of oversupply and lower demand has driven oil prices to cyclical lows. The winner is the consumers and the losers are OPEC and non-OPEC producers, like Russia. National budgets of major oil producing countries are based on the price of oil and a prolonged price deflation is problematic. Perhaps the OPEC countries are willing to subsidize the lowering oil price to discourage US drillers to bring more competition and to hasten US energy independence. For now, there is a restriction on crude oil export from the US, but if this is lifted, the old rules of geopolitics and oil will no longer apply. This could lead to further instability and tension globally.
As for the consumers, this is grand news. In the US alone, the current lowered oil price, if sustained, could have the equivalent impact of the tax holiday we had a few years ago, keeping more money in everyone’s pockets. However, this may also mean less oil produced by the US and less investment in the oil and gas sector, but it should be a net positive for the US consuming economy and will be especially true as we head towards the holiday season.
Conclusion
The US economy continues to grow moderately. Although the US is expected to grow at a 3% forward looking basis, 2014 will end substantially below the 3% level due to a poor showing in the first quarter due to transitory reasons. Regardless of using the core CPI or the PCE, the US and, to a much greater extent, the developed economies globally, are experiencing sub-2% year-on-year inflation. But with short rates at or near 0%, financial repression (robbing savers to help borrowers) continues to be the dominant theme.
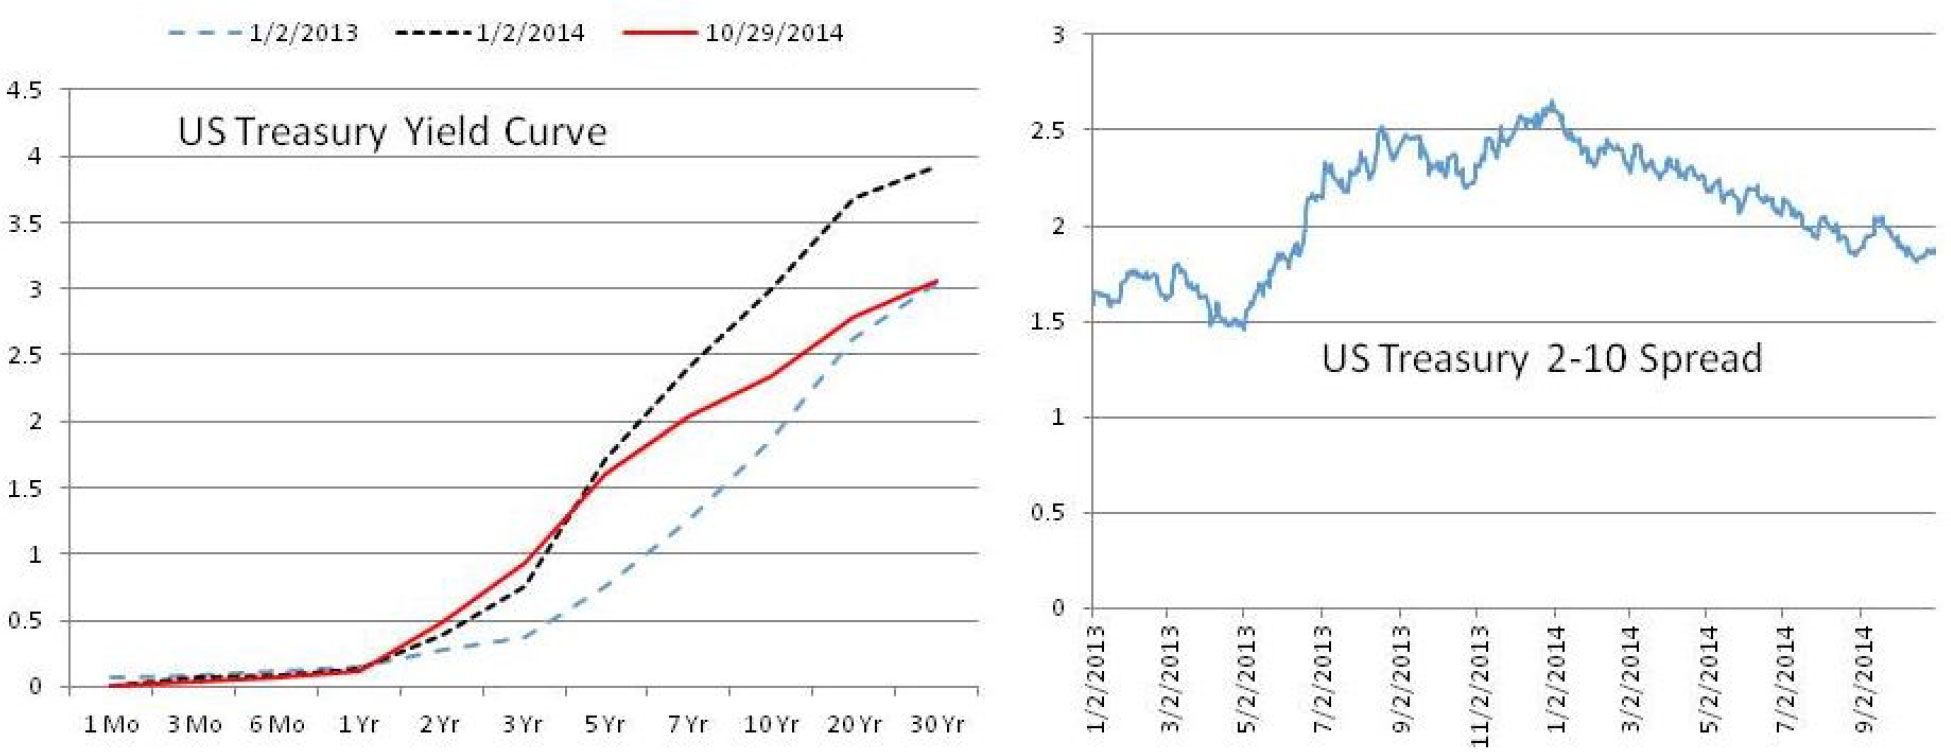
Quantitative Easing is coming to an end and the Federal Reserve will rely on forward guidance to manage public expectations regarding the first rate hike. We are expecting a 25bp move a year from now and with significant dovishness in FOMC’s forward guidance. With the history of the Great Depression and the two Lost Decades of the Japan experience, central bankers are very reluctant to “pull the trigger early”. As such, the probability is strong that the FOMC will act late and slowly and over an extended period of time. Further, the world is slowing and that lowers aggregate demand and consumption globally. This affects oil and commodity prices and contributes to disinflation. As such, the Federal Reserve will be really challenged in meeting its price stability mandate. For now, according to the FOMC, the 2% inflation expectation is well anchored. The movement of the yield curve and the interest rate spread between the US Treasury 2 and 10 year bonds is instructive. The yield curve shows a bear flattener that means the shorter end of the curve is moving up while the longer end of the curve is move down or staying low. This represents a forward looking view that the market is expecting a rising rates in the short end of the curve but, without inflation or escape velocity in the US and to a lesser extent the global market, the longer end of the curve will remain low from a historical perspective.
The US is still the best place, on a risk adjusted basis, to invest. If rates are expected to stay low or even if rates move but are expected to move up very slowly, the US fixed income market may not be so terrible. This is especially true in the time of global stress. Europe, on a fundamental basis, is in a bad place with high unemployment, little to no structural reform, high government debt, disinflationary or deflationary environment and slowing growth, but with the materialization of “do what it takes”, the financial markets may decouple with the fundamentals. As such, the equities and bond markets’ returns may surprise us all on the upside in Europe.
None the less, the global uncertainty in a multi-track central banker world causes many investors to think about assets being repriced. The October experience of market volatility (not a correction since the stock market did not correct more than 10%) is a sign of the unprecedented calmness in all asset classes which may be finally giving way to a more normal market behavior. With the completion of QE in the US, the market psychology will adjust and become more jittery. After all, the QE experiment of the past 6 years has lifted all financial assets and decoupled with the fundamental economy. The rate of positive change for the financial markets has been much, much greater. Now that QE is behind us, it is the hope that the handoff is successful and the economy will soon recover enough to catch up to the financial markets. Otherwise, the financial market must adjust (go down) to meet the economic fundamental reality.
Gauti Eggertssony and Neil Mehrotra in their June 2014 paper, A Model of Secular Stagnation13 , discuss how they would model secular stagnation. Based on an overlapping generations model with nominal wage rigidity, savings will increase (as Boomers age they save more and spend less) and spending will decrease because the young have a limited capacity to borrow and spend. They concluded that, in a post financial shock environment of deleveraging and financial inequality, real interest rates can stay negative for a very long time until the residual of the shock is eliminated. Although we are not suggesting that the US will experience Japan-like, multi-decade disinflation and balance sheet repair, this paper points out certain structural issues that all high debt nations with an aging population will need to confront. It is clear that the road back to “normal” is still long way off.
The bottom line is that normalization of this economy, interest rate, labor market and inflation expectations do not happen in a straight line. Now the QE training wheels are off and we are watching to see how the US economy and markets will behave. There are many bumps and uncertainties to come along the way. When this is placed in the context of an interconnected global economy with unknown shocks and dislocations, the future gets cloudy and unpredictable quickly. Since the 2008 crisis, the financial plumbing is significantly improved and the system is much stronger and more able to withstand shocks. There are some concerns regarding market liquidity (not to be confused with central bank liquidity) due to the constraints created by the Dodd Frank Act. This has already caused higher bond spreads in secondary markets, so expect more normalized (increased) market volatility as well as equity continuing to do well (not great like 2013 however).
We continue to favor the “cleanest shirt in the laundry”, and so does the rest of the world.
- http://www.federalreserve.gov/newsevents/speech/yellen20140822a.htm
- http://www.bls.gov/news.release/empsit.t15.htm
- http://www.federalreserve.gov/newsevents/press/monetary/20140917a.htm
- http://www.federalreserve.gov/monetarypolicy/fomcprojtabl20140917.htm
- http://www.federalreserve.gov/monetarypolicy/files/fomcminutes20140917.pdf
- http://www.imf.org/external/pubs/ft/weo/2014/02/
- http://www.ecb.europa.eu/press/key/date/2012/html/sp120726.en.html
- http://epp.eurostat.ec.europa.eu/statistics_explained/index.php/File:Euro_area_annual_inflation_and_its_main_components,_2002-2014-09-p.png#file
- http://epp.eurostat.ec.europa.eu/statistics_explained/index.php/File:Unemployment_rates,_seasonally_adjusted,_August_2014.png
- http://www.ecb.europa.eu/press/pr/date/2014/html/pr141002_1.en.html
- http://www.ecb.europa.eu/press/pr/date/2014/html/pr141002_1_Annex_2.pdf?0ba2a520b8a2b7ad8ff6bfb99333ba25
- http://www.ecb.europa.eu/press/pr/date/2014/html/pr141002_1_Annex_1.pdf?c4144e9908c29df066a053246f81d1ff
- Eggertson-Secular-Stagnation.pdf

