What a difference a quarter makes
At the end of the second quarter, the consensus view was that the U.S. economy was humming along with an ever improving labor market. Even though we were still longing for better productivity scores and return of wage inflation, the general view was that the Federal Reserve would raise rates for the first time in almost a decade. After turning the global attention away from Grexit (a “move-along-nothing-to-see-here” can-kicking exercise) to the ongoing global commodity pricing collapse and the related currency realignments, all eyes were on China. The spectacular correction of the Chinese stock market and its decision to allow its currency to “adjust” or devalue in August served as the poster child for global economic slowdown and perhaps signaling a new round of competitive currency devaluation and adding to disinflation/deflation pressure globally. These events were sufficient enough for the FOMC to keep its zero bound interest rate policy for another meeting, or two.
The members of the FOMC to include Chair Yellen maintain that a 2015 lift off is still in the cards even as new data appears to suggest further weakness globally with more disinflation and deflation risk and tendencies. In fact, the U.S. economy and labor markets have shown some softness, leading many to suggest that the Federal Reserve has missed the lift off window and instead there may be a need for more quantitative easing (QE) or pushing rates into negative territory to support a slowing economy. While others believe that there is no rush to raise rates and that the economic fundamentals and the lack of inflation support a ZIRP policy for longer.
At of the end of the third quarter, the market performance was a good indicator of the investor sentiment globally – a big thumb’s down.

For the first 9 months this year (gray bars), the Barclays US Aggregate Bond Total Return Index (a popular investment grade bond index) was the only asset class among the major indexes that gave a positive return, and for the third quarter, the Barclays US and Barclays Global Aggregate Bond Total Return Index and the FTSE U.S. real estate index were the only assets that delivered a positive return. This chart shows that, for most assets, the third quarter has turned them into net losers for the year. The risk-off effects were fast and furious.
Since then, the broad market remains schizophrenic and on edge. On the one hand, investors are positive when new U.S. and foreign data suggest growth and evidence of sustainable recovery. It is less a sense of euphoria and much more a sense of relief that we are not marching towards global recession and contributes to a positive investor sentiment – market rises. On the other hand, such indications would support a rise in U.S. interest rates which has an overall dampening effect on risk assets which contributes to poor investor sentiment – market sells off. Then if data from Europe and Japan are weak which require more unconventional monetary actions are taken would lead to positive investor sentiment – market rises.
September: the “Same Old Same Old”
In its September 17, 2015, press release, the FMOC stated the following in pursuing the Federal Reserve’s mandate of fostering maximum employment and price stability:
Economic Backdrop
Positives
- Labor market continued to improve, with solid job gains, declining unemployment, and underutilization of labor resources has diminished since early this year.
- Economic activity is expanding at a moderate pace.
- Household spending and business fixed investment are increasing moderately.
- Housing sector has improved further.
- Survey-based measures of longer-term inflation expectations have remained stable.
Negative
- Net exports have been soft.
- Labor market indicators show that Inflation has continued to run below the Committee’s longer-run objective, partly reflecting declines in energy prices and in prices of non-energy imports. Market-based measures of inflation compensation moved lower.
- Recent global economic and financial developments may restrain economic activity somewhat and are likely to put further downward pressure on inflation in the near term.
Expectation
- The risks to the outlook for economic activity and the labor market as nearly balanced.
- Inflation is anticipated to remain near its recent low level in the near term, but expect inflation to rise gradually toward 2 percent over the medium term as the labor market improves further and the transitory effects of declines in energy and import prices dissipate.
Decision
- Reaffirmed its view that the current 0 to 1/4 percent target range for the federal funds rate remains appropriate.
- Maintain its existing policy of reinvesting principal payments from its holdings of agency debt and agency mortgage-backed securities in agency mortgage-backed securities and of rolling over maturing Treasury securities at auction.
Forward
- Data Dependent – The Committee anticipates that it will be appropriate to raise the target range for the federal funds rate when it has seen some further improvement in the labor market and is reasonably confident that inflation will move back to its 2 percent objective over the medium term.
- Rates Lower for Longer – Even after employment and inflation are near mandate-consistent levels, economic conditions may, for some time, warrant keeping the target federal funds rate below levels the Committee views as normal in the longer run.
Clear As Mud
The Federal Reserve has been broadcasting that it intends to raise rates in 2015 in response to the positive data on the U.S. economy and the rapidly improving labor market. More importantly, the Federal Reserve does not want to be behind the curve on inflation which would drive a more rapid increase in rates and negatively impact the economy. The September meeting was greatly anticipated by the market when the FOMC will lift off from its zero interest rate policy (ZIRP).
In Chair Yellen’s press conference that followed the September FOMC meeting, she highlighted the continued strengthening in the U.S. economy and particularly in the labor market. However the no lift off decision was primarily due to 1) Inflation has continued to run below FOMC’s 2 percent objective, partly reflecting declines in energy and import prices, and these factors on inflation remains transitory and 2) the “outlook abroad appears to have become more uncertain of late, and heightened concerns about growth in China and other emerging market economies have led to notable volatility in financial markets. The drop in equity prices, the further appreciation of the dollar, and a widening in risk spreads have tightened overall financial conditions to some extent. These developments may restrain U.S. economic activity somewhat and are likely to put further downward pressure on inflation in the near term.”
For many Fed observers, the goal post to lift off continues to move outward, and the introduction of an increased weighting on global factors adds more uncertainty to understanding FOMC’s policy decision matrix and the weighting of all economic data.
The U.S. Economy – Moderate Pace
The first half GDP continued to be revised upward. The Labor Department announced in late September that the “third” estimate for second quarter GDP increased at an annual rate of 3.9%, and in the first quarter, real GDP increased 0.6%. This set of numbers is good news about the U.S. economy. The much dreaded first quarter did not contract as the first and second estimates reported (-0.7% and -0.2%). The average annualized real GDP for the first half is 1.9% and the GDP is expected to continue in a 2% to 2.5% New Normal range.

US Dollar & Export
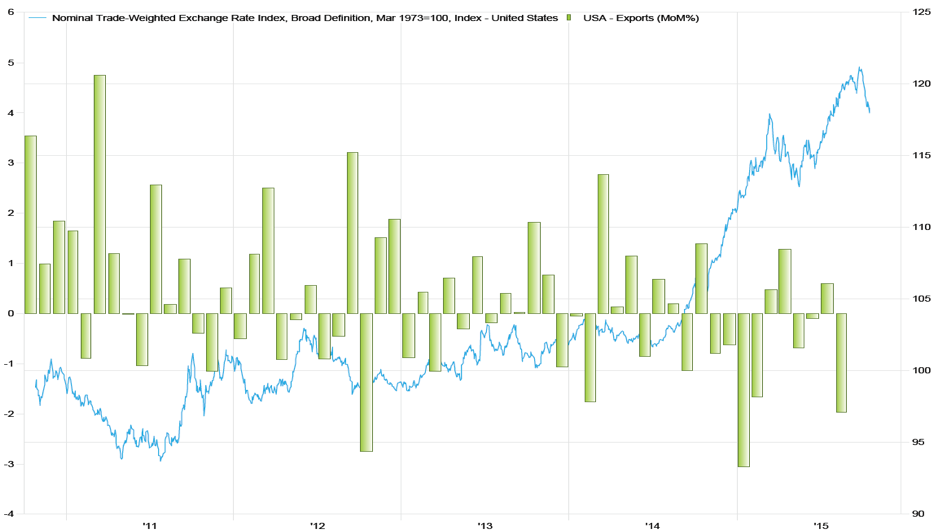
The U.S. dollar has gained significantly over the past two years. Since its August 26th high, the dollar retreated some, but from a trailing 1-year period, the dollar has gained almost 12%. The September FOMC decision to not raise rates has put short-term downward pressure on the dollar. The announcement of possibly more and longer quantitative easing in Europe and the possibility of FOMC raising rates this year will again push the dollar higher. For now, the U.S. corporations with significant foreign sales are showing a negative impact on overseas earnings due to dollar strength. Although the smaller U.S. companies selling domestically appear to be immune, it is a matter of time before the cheaper foreign imports will begin to impact their earnings as well. The strength in the U.S. currency is an expression of the relative strength in the U.S. economy (multi speed world), change in monetary policies (divergence), and the EM slowdown-commodity implosion led disinflation or deflation environment – the cleanest shirt in the dirty laundry is getting even cleaner!
The Labor Market
According to the Bureau of Labor Statistics, U.S. total nonfarm payroll employment increased by 142,000 in September, and the unemployment rate was unchanged at 5.1%. Primarily, job gains occurred in health care and information, while mining employment continued to fall. The 142,000 new payroll came at the heels of a 173,000 August increase. Both months are now in the sub-200,000 monthly reading. Although the labor market has been the bright spot in this extended economic recovery, it is beginning to show signs of a down shift. Almost 10 million jobs have been created since Oct 2010 as compared with the almost 7 million jobs lost between January 2008 and October 2010. After 5 years of job gain, this slowdown in job creation is not unusual. As such, this does not necessarily portray a slowdown in the U.S. economy, but more data is needed before a trend can be ascertained. At this late stage of an economic cycle, the unemployment rate should continue to fall even at 142,000 job creation level, but unemployment data alone does not complete the puzzle of the labor economy. The systematic recovery, as represented in the official unemployment rate – U3 and the more comprehensive unemployment-underemployment rate – U6, should be viewed alongside with the participation rate. A declining participation rate has contributed to the improving U3 and U6 rates.

At the same time, the initial jobless claims are at a 30-year low. The declining unemployment number masks the systematic downward shift in labor participation rate.

The latest reading on participation is 62.3% (seasonally adjusted) which is reaching a historical low with 94.61 million[1] people exiting the workforce. Baby Boomer retiring does not sufficiently explain this exiting rate. Teens (16 to 19) and women (age 20 and over) are participating even less according to the latest BLS report. The above right graph shows the troubling sign that almost every productive age group participation rate is also declining, with adults
20-24 leading the way downwards.

Another set of problems is a lack of labor productivity and real wage growth. Labor productivity is defined as “real output per labor hour”, and growth in labor productivity is measured as the change in this ratio over time. Labor productivity growth is what enables workers to produce more goods and services than they otherwise could for a given number of work hours. As productivity increases, so do wages. U.S. labor productivity has been on a decline for many years and many factors have been attributed, and the exact causation, thus action for reversal, is uncertain. According to the Bureau of Labor Statistics (BLS)[2], the real wage growth was an anemic 0.1% in September.
 Real average hourly earnings increased 2.2%, seasonally adjusted, from September 2014 to September 2015.

As of the second quarter, the trailing 1 year labor productivity is only 0.78% even after a rebound of 3.3% for the second quarter after a -2.2% in the first quarter.
Inflation, Disinflation and Deflation

If we use the Core CPI, it is almost at the 2% inflation target set by the Fed, but the Personal Consumption Expenditure Index (PCE), which is favored by FOMC, tells a different story. The core PCE is at 1.31% which is far below the 2% mark.

It appears that the general risk to the Core PCE is on the downside even though it is stable at 1.31% currently. The movements for the components[3] that make up the PCE during the first two quarters are as follows. The percentage change for gasoline and other energy goods is so wide that it is not included in the graph but provided in a table form.
| 2015 | ||
| I | II | |
| Gasoline and other energy goods | -63.1 | 37.3 |

This two quarter data suggests that prices of the service components of the economy are rising with financial services and insurance leading the way at the end of the second quarter while durable goods and recreational goods and vehicles show contractions. However, the general downward pressure on reflation can be attributed to a strengthening U.S. dollar, a collapse in commodities and moderate or slowing economic activities globally.
Long term price stability or inflation is driven by consumer sentiment. The CPI and PCE data are, by definition, backward looking and can be predictive of the near term price stability and may not be mirroring the consumer sentiment for the long term. It is this sentiment that central bankers have little control over.

The University of Michigan surveys, as of 09-30-2015, show the 12-month inflation expectation to be at 2.8% and remain steady this year, but the 5 year inflation expectation is down to 3% reflecting a general down trend since 2013.
Super Mario Works His Magic
The October 22, 2015, press conference by Mario Draghi discussed[4] the Governing Council’s latest monetary policy decisions. The European Central Bank (ECB) kept the key ECB interest rates unchanged and continued the non-standard monetary policy measures of asset purchases. However, the Governing Council is concerned regarding the downside risks to the outlook of growth and inflation. This is reflecting the heightened uncertainties regarding developments in emerging market economies (EM), which have the potential to further weigh on global growth and foreign demand for euro area exports. Also, the financial markets are reflecting this uncertainty and may cause negative effects for domestic demand.
As such, Mario Draghi dovishly stated that “the degree of monetary policy accommodation will need to be re-examined at our December monetary policy meeting, when the new Eurosystem staff macroeconomic projections will be available. The Governing Council is willing and able to act by using all the instruments available within its mandate if warranted in order to maintain an appropriate degree of monetary accommodation. In particular, the Governing Council recalls that the asset purchase program provides sufficient flexibility in terms of adjusting its size, composition and duration. In the meantime, we will continue to fully implement the monthly asset purchases of €60 billion. These purchases are intended to run until the end of September 2016, or beyond, if necessary, and, in any case, until we see a sustained adjustment in the path of inflation that is consistent with our aim of achieving inflation rates below, but close to, 2% over the medium term.”
Mario Draghi is signaling that the ECB is willing and able to extend and expand the current Quantitative Easing (QE) program partially in response to the economic slowdown, weakening commodity prices and financial market woes and the exchange rate impacts. Further, the euro zone (EZ) is still facing economic growth and labor challenges which aggravate price stability.

China – We Are All Linked

China’s Shanghai exchange lost over 40% of its value over a two month period. The mostly domestically traded index plummeted from its high of 5,166 on June 12th to its low of 2,927 on August 26th with all major exchanges lost value as well. In an effort to support the stock market from continuing free fall, the Chinese government started to buy shares, halted trading on half of the listed companies on the exchange, controlling shareholders prevented from selling shares for 6 months, stopped IPOs, increased investors’ ability to use a wider array of collateral for margin trades, announced a $40 billion stimulus plan, and sped up infrastructure spending.
One factor believed to have significantly contributed to the market turmoil was the sudden change in China’s currency position. On August 11th, Chinese Central Bank loosen (devalued) its currency trading range against the U.S. dollar by allowing its currency, the Renminbi (RMB), to move 2% above or below the “daily fixing”. The official explanation for this relaxation is China’s gradual relaxation of its currency exchange band to become more market-driven. Historically, China has “pegged” its currency with the U.S. dollar which has caused a progressively larger deviation between the on-shore and the off-shore RMB exchange rate over time since the currency has decoupled with Chinese economic fundamentals. In order for RMB to be considered a currency within the IMF’s special drawing rights (SDR) basket, China has to make its currency more market driven. This may have been the reason for the China Central Bank to take action, but the timing could not have been worse. Market speculation was that China is using the SDR as an excuse to boost its own economy by devaluing the RMB and to serve as a source of psychological support to its stock markets. Globally, the fear was that China would begin a new series of currency devaluation that would fuel new rounds of competitive devaluation which ultimately adds to global deflationary pressure.

The reality is that China has been slowing for many years. After decades of export and infrastructure driven double to high single digit growth, China recognizes that its economic model must shift to a more balanced and consumer driven path.
With its currency tracking tightly with the U.S. dollar for years China has seen its own currency appreciated against many trading partners. For China to become a world economic power, this noose must be loosened and eventually removed. Its economy and its currency must stand on their own and have the political and capital structure that offer reliability, confidence and security to investors and trading partners that are worthy of a world power. Thus loosening the daily fixing is likely to be continued over the next few years until the RMB becomes free floating on the world stage allowing the market and trade to decide what RMB’s exchange rates should be. A lower RMB would improve the export economy and produce a positive consequence but at a time when China is turning more towards a consumer and domestic based economy. During this significant economic shift, growth rate should continue to trend down. What has been surprising is how the market and investors have reacted during the third quarter. There is nothing new about a China slowdown and the lack of credibility in the published data in a command and control economy governed by a single party system. Perhaps the confluence of events with the ongoing commodity market collapse, global economic slowdown, and uncertainty with monetary policies. The question of a possible China hard landing is back in the news.
The China Communist Party Central Committee is currently holding its 13th 5-year planning session. The theme is a continuation and confirmation of moving to a lower and more sustainable consumer-based economy with more political and structural reforms. Economic development and fiscal stimulus to support the economy is expected. The Silk Road Economic Belt and the 21st-century Maritime Silk Road initiatives are expended to continue as a part of China’s rise to the status of a major world economic and political power and as a way to support the long term economic vibrancy and influence.
China has and will continue to slow at a moderate pace, but it is a natural and necessary part of an economic maturation and development process. The consequence of this change has been fully displayed in the commodities market and the world is adjusting uneasily to the weight of China.

Global Slowdown
On October 9, the World Bank and the IMF held its annual meeting in Lima, Peru.
IMF’s Managing Director Christine Lagarde’s New Mediocre remains the base case for the world since 2014. Getting the world economic activities back to the old normal remains elusive. In the September IMF’s World Economic Outlook[5] report, the near term world growth is again revised downward. The growth trajectory disparity remains between the emerging/low-income developing economies (ELIDE) and the developed economies (DE). This multi-speed world continues with the slowing of ELIDE even though they account for a growing share of the world output and the recovering DE after years of unconventional monetary policies and financial cleansing. Global growth for 2015 is now adjusted downward by 0.2% to 3.1% from July 2015 estimates. This is 0.3% lower than the world output of 3.4% achieved in 2014. 2016 projected growth now at 3.6% has also been adjusted down again by 0.2% since July (which was adjusted down by 0.2% from April 2015 estimate). The 3.6% is also likely to be too optimistic and future adjustment is expected.

The IMF attributed the following factors to the continuing slowdown in ELIDE:
- Commodity price decline,
- Overhang from past rapid credit growth, and
- Political turmoil.
The New Mediocre of moderate growth suggests “long-run potential output growth may have fallen broadly across economies. Persistently low investment helps explain limited labor productivity and wage gains, although the joint productivity of all factors of production, not just labor, has also been slow. Low aggregate demand is one factor that discourages investment…Slow expected potential growth itself dampens aggregate demand, further limiting investment, in a vicious circle. Aging populations further restrain investment in a number of countries; in some others, institutional shortcomings or political instability are deterrents. In its more extreme forms, political conflict has created a large global stock of displaced persons, both within and across borders.”
From ZIRP to NIRP – Negative Yield May Become More Prevalent
In his October 2013 speech to the International Center for Monetary and Banking Studies, Benoît Cœuré, Member of the Executive Board of the ECB, said that “the main reason for maintaining highly accommodative monetary conditions has been to avert the risk of an economic depression and to counter deflationary pressures. At the same time, given the financial disruptions which led to what is now widely called the Great Recession, the reduction of interest rates has helped to offset the excessive increase in borrowing costs caused by the widening of financial spreads. From this perspective, monetary policy actions have favored borrowers.”
Since 2014, 32 central banks have lowered their interest rates and this trend is expected to continue in an effort to support or stimulate growth, lower their exchange rates, and to fight against deflation
| Rate Name | Current Rate | Change (bp) | Effective Date |
| Swiss Target 3-Month LIBOR Rate | -0.75 | -50 | 15 Jan ’15 |
| Sweden Repo Rate | -0.35 | -10 | 08 Jul ’15 |
| Denmark Lending Rate | 0.05 | -15 | 20 Jan ’15 |
| Eurozone Main Refi Operations Minimum Bid Rate | 0.05 | -10 | 10 Sep ’14 |
| Israel Headline Short-Term Interest Rate | 0.10 | -15 | 02 Mar ’15 |
| Canada Target Rate | 0.50 | -25 | 15 Jul ’15 |
| Norway Key Sight Deposit Rate | 0.75 | -25 | 25 Sep ’15 |
| Hungary Base Rate | 1.35 | -15 | 28 Jul ’15 |
| Poland 7 Day Reference Rate | 1.50 | -50 | 05 Mar ’15 |
| South Korea Base Rate | 1.50 | -25 | 11 Jun ’15 |
| Thailand 1 Day Repo Rate | 1.50 | -25 | 01 May ’15 |
| Romania Policy Rate | 1.75 | -25 | 07 May ’15 |
| Taiwan Discount Rate | 1.75 | -12 | 25 Sep ’15 |
| Albania 1 Week Reverse Repo Rate | 2.00 | -25 | 28 Jan ’15 |
| Australia Target Cash Rate | 2.00 | -25 | 06 May ’15 |
| Morocco Policy Rate | 2.50 | -25 | 16 Dec ’14 |
| New Zealand Official Cash Rate | 2.75 | -25 | 10 Sep ’15 |
| Mexico O/N Target Rate | 3.00 | -50 | 06 Jun ’14 |
| Malaysia O/N Policy Rate | 3.25 | 25 | 10 Jul ’14 |
| Jordan Rediscount Rate | 3.75 | -25 | 09 Jul ’15 |
| China 1 Year or Less Rate On RMB Loans | 4.35 | -25 | 26 Oct ’15 |
| Qatar O/N Lending Rate | 4.50 | -50 | 03 Sep ’14 |
| Serbia Policy Rate | 4.50 | -50 | 14 Oct ’15 |
| Botswana Bank Rate | 6.00 | -50 | 07 Aug ’15 |
| Pakistan Policy Rate | 6.00 | -50 | 14 Sep ’15 |
| Sri Lanka Repo rate | 6.00 | -50 | 15 Apr ’15 |
| India Repo Rate | 6.75 | -50 | 29 Sep ’15 |
| Indonesia BI Rate | 7.50 | -25 | 17 Feb ’15 |
| Turkey 1 Week Repo Rate | 7.50 | -25 | 24 Feb ’15 |
| Egypt O/N Deposit Rate | 8.75 | -50 | 15 Jan ’15 |
| Russia 1 Week Repo Rate | 11.00 | -50 | 03 Aug ’15 |
| Ukraine Discount Rate | 22.00 | -500 | 23 Sep ’15 |
In the U.S., the third round of QE ended in November 2013, and since then the FOMC has relied on forward guidance and economic data to guide the market regarding a lift off. The September non-action was disappointing to many who believe that the extraordinary ZIRP policy should be changed to reflect the significantly improved economic reality since the dark days of the Financial Crisis led Great Recession. Shortly after the September non-action FOMC decision, I was in the audience of Dr. Ben Bernanke in Washington. He suggested that the tightening of financial conditions as the meeting date approached concerned the FOMC. The August market reaction to China’s stock market collapse and the intense focus on China’s slowdown had taken the FOMC by surprise. The members were unsure if the market volatility was reflecting factors and sentiments that were not known or properly weighted by the FOMC or if this was just a momentary market reaction that has no long lasting impact. Dr. Bernanke went on to say that if the economy continues its path and the financial condition reverses by December, he expects a FOMC lift off this year; of course, the decision remains data dependent.

Since the September meeting, the Labor Department reported a disappointing 142,000 net new jobs added in September. Furthermore, the July and August job gains were revised down by a combined 59,000 and average hourly rate declined for the first time since 2014. These new labor and wage numbers are not constructive data for the FOMC to raise rates. Even though the data do not suggest a looming recession, it may be the beginning of a slowing economy after a 7 year recovery. The strength in the dollar and the global economic slowdown may continue to act as the dampening factors tempering U.S. economic activities further.
What is particularly noteworthy is the September released dot plot. For the first time, one member deems a negative interest rate as an appropriate next step for the FOMC and not a lift off. In fact, the negative interest rate policy (NIRP) should extend through 2016.

The Economic Projection release by the FOMC revised down the FOMC’s June projections in GDP, PCE Inflation Rate and Core PCE Inflation Rate for 2016 through 2017:

The FOMC has proven to be a poor forecaster. The following table summarizes the economic projections (rounding up) since September 2013.
| Median Projection | 2013 | 2014 | 2015 | 1016 | 2017 | 2018 | Longer Run |
| Real GDP Change | |||||||
| Sep-15 | 2.10% | 2.30% | 2.20% | 2.00% | 2.00% | ||
| Jun-15 | 1.90% | 2.50% | 2.30% | 2.00% | |||
| Mar-15 | 2.50% | 2.50% | 2.20% | 2.10% | |||
| Dec-14 | 2.40% | 2.80% | 2.80% | 2.40% | 2.20% | ||
| Sep-14 | 2.30% | 2.80% | 28.00% | 2.40% | 2.20% | ||
| Jun-14 | 2.20% | 3.10% | 2.80% | 2.20% | |||
| Mar-14 | 2.90% | 3.10% | 2.80% | 2.30% | |||
| Dec-13 | 2.30% | 3.00% | 3.20% | 2.90% | 2.30% | ||
| Sep-13 | 2.20% | 3.00% | 3.30% | 2.90% | 2.40% | ||
| U3 | |||||||
| Sep-15 | 5.00% | 4.80% | 4.80% | 4.80% | 4.90% | ||
| Jun-15 | 5.30% | 5.10% | 5.00% | 5.00% | |||
| Mar-15 | 5.10% | 5.00% | 5.00% | 5.10% | |||
| Dec-14 | 5.80% | 5.30% | 5.10% | 5.10% | 5.40% | ||
| Sep-14 | 6.00% | 5.50% | 5.30% | 5.10% | 5.40% | ||
| Jun-14 | 6.10% | 5.60% | 5.30% | 5.40% | |||
| Mar-14 | 6.20% | 5.80% | 5.40% | 5.40% | |||
| Dec-13 | 7.10% | 6.50% | 6.00% | 5.60% | 5.50% | ||
| Sep-13 | 7.20% | 6.60% | 6.10% | 5.70% | 5.50% | ||
| PCE Inflation | |||||||
| Sep-15 | 0.40% | 1.70% | 1.90% | 2.00% | 2.00% | ||
| Jun-15 | 0.70% | 1.80% | 2.00% | 2.00% | |||
| Mar-15 | 0.70% | 1.80% | 2.00% | 2.00% | |||
| Dec-14 | 1.30% | 1.30% | 1.90% | 1.90% | 2.00% | ||
| Sep-14 | 1.60% | 1.80% | 1.90% | 2.00% | 2.00% | ||
| Jun-14 | 1.60% | 1.80% | 1.80% | 2.00% | |||
| Mar-14 | 1.60% | 1.80% | 1.80% | 2.00% | |||
| Dec-13 | 1.00% | 1.50% | 1.80% | 2.00% | |||
| Sep-13 | 1.20% | 1.60% | 1.80% | 2.00% | |||
With the exception of underestimating the “robust” recovery in the labor market as represented by U3, PCE Inflation and GDP have been consistently overestimated by the FOMC. Now, the FOMC is projecting a real GDP in the “longer run” to be at 2% from 2.4% just 2 years ago.
There is an ongoing debate about central bank monetary policy. One side takes the U.S. economic data (and now including the global economic data) and suggests that the FOMC needs not raise rates and in fact instigate NIRP with new QE. If at all possible, throw in significant fiscal stimulus through infrastructure projects nationally. This is the view promoted by Larry Summers to combat Secular Stagnation. The other side suggests that a lift off is appropriate and necessary. Although we may be in a New Mediocre, we are certainly not in the dire sharp of the Great Recession. There is no need to keep ZIRP. In many ways this unconventional monetary policy is distorting the economy and the financial markets and if prolonged will give rise to future bubbles and unintended consequences that ultimately cause significant damages to the economy. By increasing rates earlier, the FOMC will be able to fight another recession down the road.
We are hopeful that FOMC will raise interest rate by the end of this year. No rate action is expected during the October FOMC meeting. According to the CME group FedWatch tool (which allows market participants to view the probability of an upcoming Fed Rate hike), the rate hike probability for this October meeting is 5%[6] and a 34% probability for the FOMC’s December meeting. These probabilities are based on CME Group 30-Day Fed Fund futures prices, which have long been used to express the market’s views on the likelihood of changes in U.S. monetary policy. It is not until March 2016 that the probability reaches 56%. We believe that the window of opportunity is closing on the FOMC and that the longer the wait the less likely FOMC will be able to have the data to justify a lift off. However, the two conditions set forth by Chair Yellen to support a lift off may not have been achieved since September: 1) inflation is not likely to improve and 2) economy may show weakness.

This chart shows the US Treasury yield curve on 1-1-2014, 1-1-2015 and today. It clearly shows that 5-year and longer maturity bond yields have dropped since the beginning of 2014 while the shorter end of the yield curve have adjusted higher in anticipation of an interest rate lift off. As the curve flattens it suggests that inflation is not an issue and in fact there is lesser inflation fear. This continuing reduction in term premium is making the intermediate portion of the yield curve more attractive. At the same time, the front end of the yield curve is expected to be more volatile due to the uncertainty of FOMC actions.
Many European sovereign bonds are and have been in a negative interest environment. As of today, Italy’s 2 year bond is in negative territory.

History has demonstrated that a negative interest rate where a depositor has to pay the borrower an income for keeping or using his money has not caused the depositor or lender to exit or find a better outcome en masse. This seems to suggest that lenders or depositors are willing to accept a defined loss to their investment as a cost of maintaining safety, liquidity and certainty. To put it another way, when a central bank invokes NIRP, the desired outcome of pushing savers into riskier assets and investments to stimulate economic activities and risk appetite may not be achieved. This also means that the alternative parking places for savings and investments are not sufficiently attractive to offset the quantified loss of capital under a NIRP. This is truly astonishing from a behavioral finance standpoint as we understand the human tendency of loss aversion. Perhaps the negative rates are simply not severe or painful enough for depositor action.
The potency of unconventional money policy has and will continue to diminish upon the real economy. The intended effect of stimulating borrowing and risk taking has been limited. The impact has been best felt and transmitted in the financial economy and to a lesser degree real assets (such as real estate). The transmission mechanism is inefficient and ineffective as we still have not witness a return to “normal” economic activities, wage growth, and inflation after trillions of dollars in QE and sustained ZIRP and some NIRP globally. In fact, the world is slowing and inflation is not a risk for most. If the U.S. slows next year as this extended economic cycle comes to an end or due to exogenous factors, negative interest rates and QE 4, 5… and more are probable. We are not only in a liquidity trap; we are in a monetary trap.
[1] http://www.bls.gov/news.release/empsit.t01.htm
[2] http://www.bls.gov/news.release/pdf/realer.pdf
[3] http://www.bea.gov/iTable/iTable.cfm?ReqID=9&step=1#reqid=9&step=3&isuri=1&903=67
[4] https://www.ecb.europa.eu/press/pressconf/2015/html/is151022.en.html
[5] https://www.imf.org/external/pubs/ft/weo/2015/02/pdf/text.pdf
[6] http://www.cmegroup.com/trading/interest-rates/countdown-to-fomc.html