The most important non-event in 2012 was the end of the 5,125-year cycle in the Mayan calendar on December 21 which should have ushered in the fiery end of the world. After surviving that scare, we had to endure the much less ominous yet no less out-of-control event known as the Fiscal Cliff. This was the first of a four act play.
The U.S. political theater is gearing up for debt ceiling, sequestration and continuing resolution scenes for all spectators. A new character was briefly introduced just to get everyone’s blood flowing nicely at the beginning of 2013. The idea of minting a one trillion-dollar platinum coin was floated as a possible elixir to immediately (and if successful, on a continuous basis) solve our budget woes. The genesis of such a scheme came from a few key sentences in the 1997 Omnibus Consolidated Appropriations Act that provided the Secretary of the Treasury the option to mint and issue platinum coins in such quantity and of such variety as the Secretary determines to be appropriate. This would have been the ultimate in “can kicking” by our government not to mention conjuring up the devastating images of hyperinflation during the Weimar Republic.
Four Bites at the Budget Apple
As we become well trained by global politicians in the last few years, we have come to expect our lawmakers and elected officials to “save us” each time when we get too close to the edge of any financial abyss. In the U.S., dealing with our national debt and ongoing budget and entitlement costs issues is becoming almost a national pastime. The Republicans want to keep revenue (i.e. taxes) from increasing while the Democrats predictably want to maintain the safety nets (i.e. government programs) for the Middle Class.
In 2013, the Republicans have four bites at the budget fight apple. So far, the first two bites have not created any market reactions. The first bite ended on January 2 and the Fiscal Cliff was averted. The man-made Fiscal Cliff was to force the two parties to seriously address tax revenues as a result of the expiration of the temporary Bush Era tax cuts and to come up with a grand bargain to meaningfully address spending cuts. The American Tax Relief Act of 2012 was signed into law. There was no comprehensive tax reform. Temporary Bush Era tax cuts were made permanent with the exception of increasing the top tax bracket for the highest paid Americans. The temporary reduction in Social Security tax rate for employees was allowed to expire and the increase inMedicare tax rates plus the application of the Medicare tax for the first time on unearned income went into effect. As a result, almost all Americans will be paying more (non income) taxes in 2013. The Medicare tax is earmarked to fund Obamacare, and in theory, the restoration of the Social Security tax is to beef up the Social Security “trust fund”. None of the new revenues generated will be used to offset our budget deficits. The spending cuts remain unaddressed, and they, in essence, have “kicked the can down the road”.
The second bite at the budget fight apple is the debt ceiling negotiation. On December 31, 2012, the U.S. government officially reached its then authorized borrowing limit — i.e. the debt ceiling — of about $16.4 trillion. Treasury Secretary Timothy Geithner notified Congress that by using “extraordinary measures” he would be able to push a possible U.S. default to mid-February or early March. With House Speaker John Boehner’s failure to gain the 218 Republican votes he needed to secure the “No Budget No Pay” measure, on January 23, the House passed a 4-months extension of the debt ceiling expiring on May 18th. The U.S. will not default on its debts for now. They have “kicked the can down the road”.
The third bite at the budget apple is to deal with the blunt budget cutting instrument known as sequestration. The bipartisan majorities in both the House and Senate voted for a series of automatic, across the board defense and non-defense spending cuts known as sequestration which resulted in the Budget Control Act of 2011. The Sequestration Transparency Act of 2012 requires the President to submit to Congress a report on the potential sequestration triggered by the failure of the Joint Select Committee on Deficit Reduction to propose, and Congress to enact, a plan to reduce the deficit by $1.2 trillion. According to the Office of Management and Budget, the current calculation of total annual reduction is as follows (in $billion):
| Joint Committee savings target | $1,200,000 |
| Deduct debt service savings (18%) | -$216,000 |
| Net programmatic reductions | $984,000 |
| Divide by 9 years to calculate annual reduction | $109,333 |
| Split 50/50 between defense and nondefense functions | $54,557 |
Unless alternative actions are taken, $1.2 trillion across-the-board cuts over 10 years will take effect on March 2.
The fourth bite at the budget fight apple is known as the continuing resolution. Each year around February the President submits his budget to the Congress for approval for the new fiscal year beginning in October that year. If any portion of the budget or appropriation is not approved on a timely basis, then certain parts of the government or federal programs are subject to “shutdown”. Continuing resolution becomes the way to provide temporary funding to keep the government operating. President Obama signed the last continuing appropriations resolution (H.J.Res. 117) that provided funding for the federal government and extended the federal pay freeze through Wednesday, March 27, 2013. Republicans have made clear that they will let the government shut down to force spending cuts or changes to entitlement programs to bring deficit and spending into control in the long run.
If history is any guide, an eleventh hour deal will be struck to either kick the can down the road for any major and substantive decision sometime in the future or make some face saving changes to the budget and call it a day. The path of least resistance is to extend the status quo and hope that the same decisions, when made in the future, would somehow be less painful because the circumstances would be less unfavorable by then, but in reality, fiscal irresponsibility has a way of exaggerating and not diminishing over time. This process of can kicking or muddling through has real and substantial consequences to our standard of living, quality of life, national resources, competitiveness, and ultimately our freedom.
The World is Drowning in Liquidity
According to the Federal Open Market Committee (FOMC) October 2012 meeting statement, the Committee remains concerned that, without sufficient policy accommodation, economic growth might not be strong enough to generate sustained improvement in labor market conditions. Furthermore, strains in global financial markets continue to pose significant downside risks to the economic outlook. The Federal Reserve decided to:
- continue purchasing additional agency mortgage-backed securities at a pace of $40 billion per month,
- continue to purchase longer-term Treasury securities initially at a pace of $45 billion per month (the original program to extend the average maturity of its holdings of Treasury securities completed at the end of 2012),
- continue its existing policy of reinvesting principal payments from its holdings of agency debt and agency mortgage-backed securities in agency mortgage-backed securities, and
- resume rolling over maturing Treasury securities at auction beginning January 2013.
In the aggregate, these actions are expected to keep longer-term interest rates low in order to support mortgage markets and help to make broader financial conditions more accommodative.
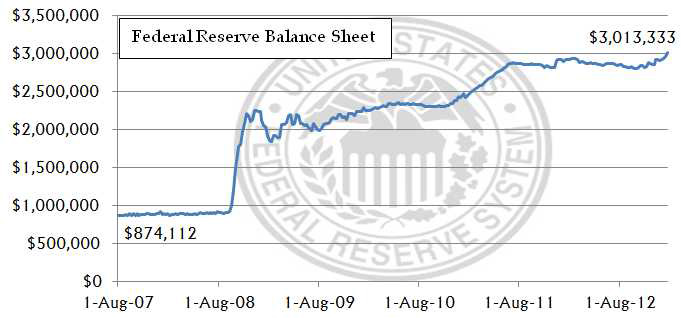
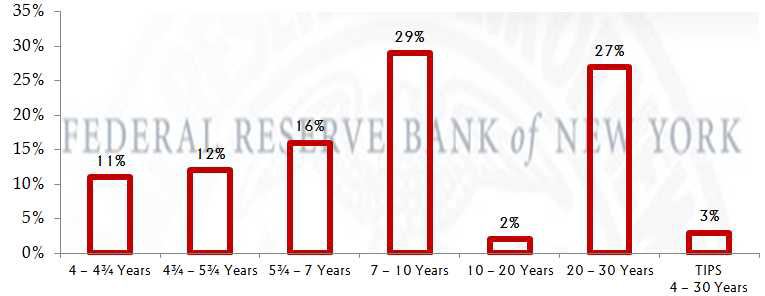
Not surprisingly, the Federal Reserve balance sheet crossed over the $3 trillion mark in the week ending January 23, 2013, a more than 300% increase from the 2007 level. The following graph depicts the runaway balance sheet expansion from August 2007 (prior to the financial crisis) to January 23, 2013 (in $million). The FOMC directed the Open Market Trading Desk at the Federal Reserve Bank of New York to distribute the purchases of longer-term Treasury securities across 7 sectors based on the following approximate weights beginning in January 2013:
FOMC also confirmed that the federal funds rate is to remain at 0 to 0.25% and, as long as the unemployment rate remains above 6.25%, the current rate shall continue. Inflation for the next couple of years is projected to be no more than 0.5% above the Committee’s 2% longer-run goal, thus further supporting the current rates.
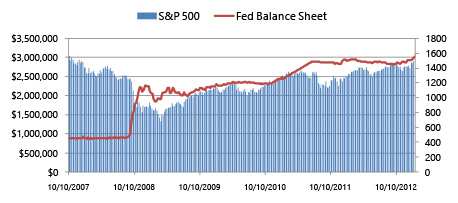
One of the intended results of the Federal Reserve quantitative action is pushing investors to take risks. The following graph shows the weekly performance of the S&P 500 ending value since October 10, 2007, through January 23, 2013. One may conclude that from an investment return standpoint, this has worked. However, the impact on the real economy has been more elusive.
According to the Bank of Japan statement from its January 22, 2013, Monetary Policy Meeting, the Bank will pursue aggressive monetary easing, aiming to achieve the price stability target at 2% in terms of the year-on-year rate of change in the consumer price index as soon as possible through a virtually zero interest rate policy and purchases of financial assets, as long as the Bank judges it appropriate to continue with each policy measure respectively. With respect to the Asset Purchase Program, after completing the current purchasing method, the Bank will introduce a method of purchasing a certain amount of financial assets every month without setting any termination date. Following the introduction of this method and for some unspecified time, the amount of monthly purchases is specified at about 13 trillion yen ($146 billion). As a result of these measures, the total size of the Asset Purchase Program will be increased by about 10 trillion yen in 2014 and is expected to be maintained thereafter. This mirror’s the FOMC actions of keeping rates extraordinarily low and the use of large scale, open-ended, quantitative easing programs.
In the first 2013 meeting of the Bank of England Monetary Policy Committee, the decision was to maintain the bank rate at its record-low level of 0.5% and quantitative easing program at £375bn. This meeting was held before the release of the latest UK GDP numbers which showed the national output fell 0.3% during the final quarter in 2012. The economic contraction was driven by -1.8% from industrial production. The UK came out of a nine-month recession and had a 0.9% expansion during the London Olympics. Now, the economy appears to be going backwards again with contraction in four of the past five quarters. If this persists, can more QE be far away?
Let’s not forget about the European Central Bank. Towards the end of 2011, the ECB initiated two long-term refinancing operations (LTROs) to pump liquidity into the European banking system to prevent a freeze of inter-banking lending. Through those programs, banks were also able to purchase Italian and Spanish debts. Banks may hold on to the new loans for no less than one but no more than three years. Although it is not considered a classic QE program, after injecting €1.02 trillion ($1.36 trillion) into the banking system, spread narrowed and rate compression resulted. At the end of 2012, the ECB balance sheet was at €2.94 trillion. Ever since the pronouncement last summer by Mario Dragi of the ECB that he will do whatever it takes to save the euro, the tail risk of a euro and Eurozone breakup were truncated. Today, many of the banks, especially the core country banks, are willing to repay the LTRO loans earlier. Some observers are viewing this as the possible beginning of ECB tightening and winding down of its QE efforts. This would be an incomplete conclusion. First, the two LTROs were backdoor ways of propping up the market for Spain and Italian sovereign debts. At least for now, the danger of a euro breakup has significantly subsided due to the promise of unconditional liquidity support, and inter-bank lending is again a reality. The need for the emergency LTROs funding is no longer a necessary substitute and the repayment can begin by the banks. Although this appears to be a positive indication, it should not be over interpreted as a sign that good days are here for the Eurozone. In fact, in October, the ECB Governing Council announced that it will be undertaking ‘Outright Monetary Transactions’ (OMT) in the Eurozone. This means that the ECB will be transacting directly in secondary markets for sovereign bonds of Eurozone Member States. Is this not QE by another name? Unless and until the Eurozone can generate sustainable economic growth, fiscal and monetary risks will continue to be a threat to its stability and union.
Fragile and Anemic Growth
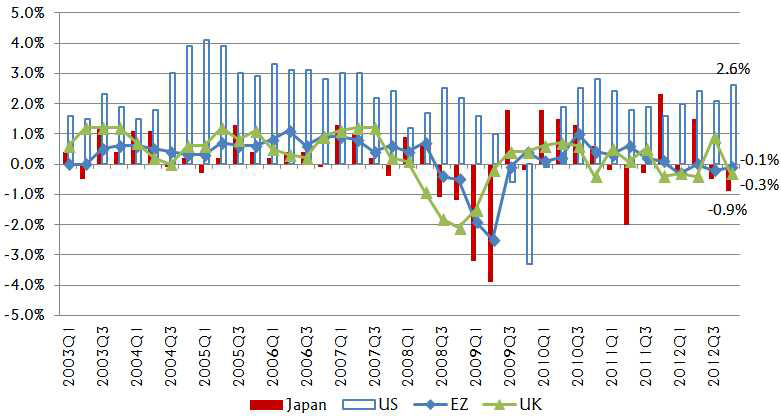
There is no question as to why the G4 central banks have independently decided to have an open-ended quantitative easing program along with an almost 0% interest rate policy. 5 years after the financial crisis, the developed economies remain stuck in a high debt, high unemployment, low growth mode. The following illustrates the G4 GDP growth since 2003.
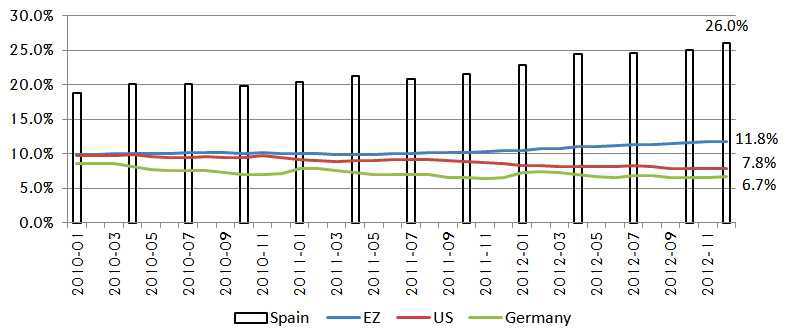
The Eurozone, Japan and UK continue to go in and out of recession. Even though the U.S. remains the cleanest of the dirty shirts in the laundry, it is not clear if we are out of the “New Normal” woods quite yet. The following illustrates the unemployment challenge.
Countries such as Spain, with over 25% unemployment rate and over 50% youth unemployment, continue to pose a significant policy and growth challenge. According to the updated IMF world growth projection below, the Eurozone is expected to remain underwater for 2013 with the U.S. economy slowing down a bit in the first half.
The IMF just completed the update2 to its October 2012 World Economic Outlook and is firmly projecting a continuing slow global recovery with the U.S. and emerging and developing economies expected to be the largest contributors. The 2013 global aggregate growth is expected at 3.5%.
| Projection | Difference from Oct ’12 Projection | Q4 over Q4 | |||||||
| Y2011 | Y2012 | Y2013 | Y2014 | Y2013 | Y2014 | 2012 | 2013 | 2014 | |
| World Output | 3.9 | 3.2 | 3.5 | 4.1 | –0.1 | –0.1 | 2.9 | 3.8 | 4 |
| Advanced Economies | 1.6 | 1.3 | 1.4 | 2.2 | –0.2 | –0.1 | 0.9 | 2 | 2.1 |
| United States | 1.8 | 2.3 | 2 | 3 | –0.1 | 0.1 | 1.9 | 2.4 | 3.2 |
| European Union | 1.6 | –0.2 | 0.2 | 1.4 | –0.3 | –0.2 | –0.3 | 1 | 1.2 |
| Euro Area | 1.4 | –0.4 | –0.2 | 1 | –0.3 | –0.1 | –0.7 | 0.5 | 1 |
| Germany | 3.1 | 0.9 | 0.6 | 1.4 | –0.3 | 0.1 | 0.6 | 1.3 | 1.1 |
| France | 1.7 | 0.2 | 0.3 | 0.9 | –0.1 | –0.2 | 0.3 | 0.3 | 1.2 |
| Italy | 0.4 | –2.1 | –1.0 | 0.5 | –0.3 | 0 | –2.4 | 0.1 | 0.4 |
| Spain | 0.4 | –1.4 | –1.5 | 0.8 | –0.1 | –0.2 | –1.9 | –0.3 | 0.8 |
| Japan | –0.6 | 2 | 1.2 | 0.7 | 0 | –0.4 | 0.2 | 2.6 | –0.1 |
| United Kingdom | 0.9 | –0.2 | 1 | 1.9 | –0.1 | –0.3 | 0 | 1.4 | 2 |
| Canada | 2.6 | 2 | 1.8 | 2.3 | –0.2 | –0.1 | 1.3 | 2.2 | 2.3 |
| Newly Industrialized Asian Economies | 4 | 1.8 | 3.2 | 3.9 | –0.4 | –0.2 | 2.4 | 3.9 | 3.8 |
| EM and Developing Economies | 6.3 | 5.1 | 5.5 | 5.9 | –0.1 | 0 | 5.5 | 5.9 | 6.2 |
| Central and Eastern Europe | 5.3 | 1.8 | 2.4 | 3.1 | –0.1 | 0 | 1.6 | 3.2 | 3.1 |
| Commonwealth of Independent States | 4.9 | 3.6 | 3.8 | 4.1 | –0.3 | –0.1 | 2.4 | 4.3 | 3.4 |
| Russia | 4.3 | 3.6 | 3.7 | 3.8 | –0.2 | –0.1 | 2.4 | 4.4 | 3.4 |
| Developing Asia | 8 | 6.6 | 7.1 | 7.5 | –0.1 | 0 | 7.3 | 7.1 | 7.8 |
| China | 9.3 | 7.8 | 8.2 | 8.5 | 0 | 0 | 8.1 | 7.9 | 8.8 |
| India | 7.9 | 4.5 | 5.9 | 6.4 | –0.1 | 0 | 5.4 | 6 | 6.4 |
| Latin America and the Caribbean | 4.5 | 3 | 3.6 | 3.9 | –0.3 | –0.1 | 3.1 | 4.2 | 3.6 |
| Brazil | 2.7 | 1 | 3.5 | 4 | –0.4 | –0.2 | 2.1 | 4 | 4.1 |
| Mexico | 3.9 | 3.8 | 3.5 | 3.5 | 0 | 0 | 2.8 | 4.9 | 2.5 |
| Middle East and North Africa | 3.5 | 5.2 | 3.4 | 3.8 | –0.2 | 0 | . . . | . . . | . . . |
| Sub-Saharan Africa 5/ | 5.3 | 4.8 | 5.8 | 5.7 | 0 | 0.1 | . . . | . . . | . . . |
| South Africa | 3.5 | 2.3 | 2.8 | 4.1 | –0.2 | 0.3 | 1.5 | 4.2 | 4.1 |
Collapse, Relapse, and Relax
Christine Lagarde, Managing Director of the International Monetary Fund, warned the crowd of global business and political leaders gathered at the annual event in Davos, Switzerland, last week that “we have avoided collapse, but we need to guard against any relapse. 2013 will be a make-or-break year.” There is no time to relax. This sums up the feebleness of the recovery for the developed economies.
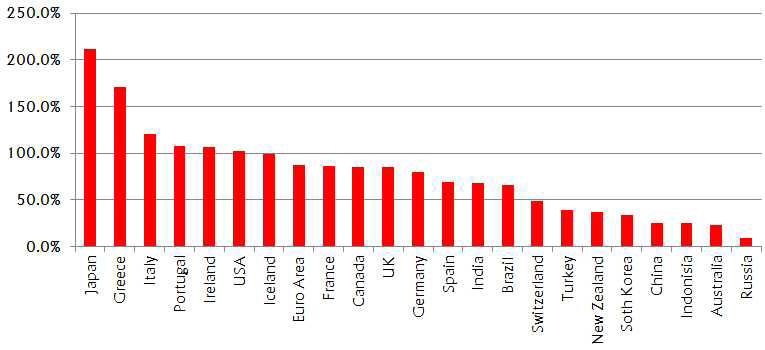
This graph shows the ratio of public debt to annual GDP among some of the largest or most troubled economies. It is no wonder that the developed economies have little room for further expansive fiscal policy, and the open ended, drunken sailor approach to monetary policy has demonstrated its limitations in stimulating economy growth. The Federal Reserve’s dual mandate of price stability and full employment is rare among central bankers. Its policy of using unlimited monetary easing to drive economic growth by bringing back the animal spirit so that employers will start hiring in a meaningful way is nothing more than a thought experiment.
In the case of the Eurozone, complacency or a lack of urgency to take action could contribute to a relapse. The need to implement a banking union, a pan European deposit insurance scheme and a fiscal compact must remain unyielding. Otherwise, the monetary union will again face the threat of collapse. President Dwight D. Eisenhower made famous his prioritization methodology when he said, “what is important is seldom urgent and what is urgent is seldom important.” The post financial crisis world requires policymakers to find the courage and conviction to address the urgent without losing sight of the important.
The Cleanest Dirty Shirt
The U.S. has continued to show signs of a sustainable recovery from the last recession. Although the growth has been subpar and the employment rates remain high, housing appears to show signs of life. It is well recognized that roughly 70% of the U.S. economy comes from domestic consumption. Thus, the continuing stalled speed economy is partially attributable to the persistently high unemployment rate.
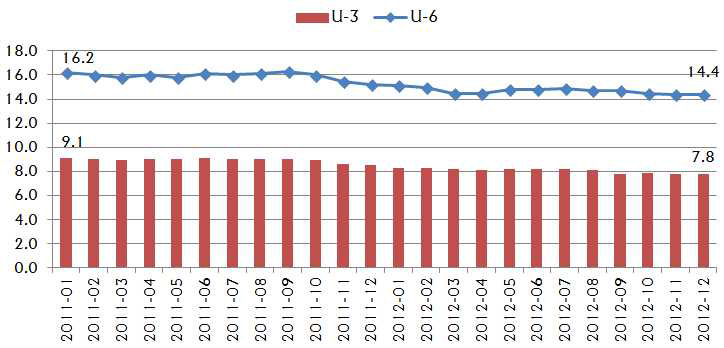
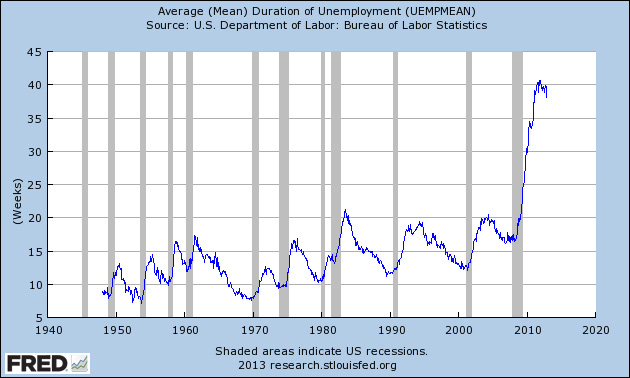
Although the popular U3 rate started at 8.3% in 2012 and is now at 7.8%, it remains uncomfortably high. The more troubling U6 rate remains at 14.4%. The U6 unemployment rate includes, not only unemployed seeking full-time employment (i.e. the U-3 rate), but also includes “marginally attached workers and those working part-time for economic reasons.” Some of the part-time workers counted as employed by U-3 could be working as little as an hour a week and the “marginally attached workers” include those who have gotten discouraged and stopped looking but still want to work. According to the Federal Reserve Bank of Saint Louis, the average duration of unemployment is at 38.1 weeks at the end of 2012.
The improving U3, the stagnant long-term unemployed and the seemingly unyielding U6 rates paint a complex picture of the job market and economy in the U.S. It seems reasonable to suggest that, during the depth of the financial crisis, employers cut staff and tightened their belts. We witnessed a surge in productivity as the economy begins to stabilize and recover. Companies in the S&P 500 continue to generate upside surprise to their earnings each quarter. Employers have retooled and learned to operate with fewer employees to keep their margins even with little top line revenue growth. Only people with the right set of skills and knowledge are being hired and rehired. The long term unemployed are likely to remain unemployed or simply leave the workforce. This partially explains the slow but steady decrease in the U3 rate. The weak and changing economy gives employers pause in taking risk, and the policy uncertainty created in Washington acts like a wet blanket over an already slow burning flame.
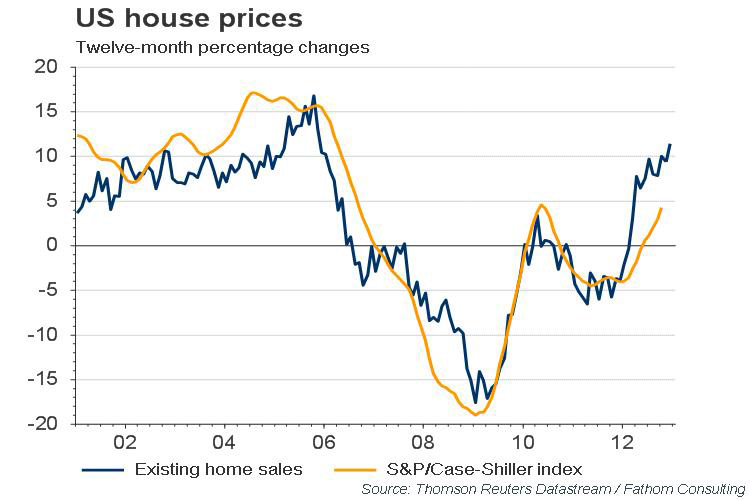
One bright spot in the US is the same industry that got the world almost into a depression: residential real estate. After 5 long years, residential housing prices are on the rebound.
According to the National Association of Realtors, the national median existing-home price for all housing types was $180,600 in November 2012, up 10.1% from November 2011. This is the ninth consecutive monthly year-over-year price gain which last occurred from September 2005 to May 2006. Total existing-home sales, which are completed transactions that include single-family homes, townhomes, condominiums and co-ops, rose 5.9% to a seasonally adjusted annual rate of 5.04 million in November from a downwardly revised 4.76 million in October and are 14.5% higher than the 4.40 million-unit pace in November 2011. Sales are at the highest level since November 2009 when the annual pace spiked at 5.44 million. Distressed homes – foreclosures and short sales sold at deep discounts – accounted for 22% of November sales (12% were foreclosures and 10% were short sales), down from 24% in October and 29% in November 2011. Total housing inventory at the end of November fell 3.8% to 2.03 million existing homes available for sale, which represents a 4.8-month supply at the current sales pace; it was 5.3 months in October and is the lowest housing supply since September of 2005 when it was 4.6 months. All these statistics point to a housing recovery which would help to propel the economy forward. In past recessions (not caused by the housing bubble), it was the strength in housing that gave strength to the recovery.
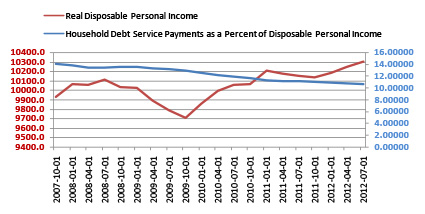
U.S. Consumer has been deleveraging since the height reached in 2007. According to the Federal Reserve Bank data, as of July last year, the debt service payment as a percentage of disposable personal income has returned to the 1981 level. At the height of the credit bubble, household debt service was over 14% of the household’s disposable personal income. Today, it is 10.6%. The consumers have been repairing their balance sheets at a good pace. Not surprisingly then the real disposable personal income has been rising at a decent pace as well. This indicates that consumers have the capacity to further contribute to the economic recovery.
Turning the Corner
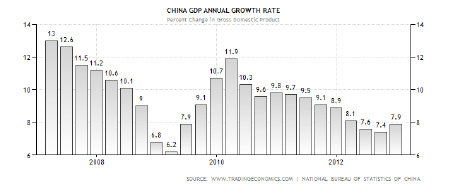
The Chinese economy grew at a rate of 7.8% last year. Although it was at its slowest rate in over a decade, the fourth quarter really started to show signs of growth. The twin challenge of an anemic global economic recovery and its policy to deflate the property bubble helped to cool down an otherwise red hot economy, not to mention a mountain of bad debts on the state level. There was significant speculation for the last two years that China may have a hard landing, but China may have turned the corner. The fourth quarter shows a 7.9% year-on-year growth to its economy from a previous 7.4%. Thisreverses the prior 7 quarterly slowdown in the second largest world economy.
This improvement is based on the better outlook in the real estate market after two mid-year interest rate cuts and the new infrastructure spending by the government. Further industrial production and retail sales both inched up year-on-year from a month earlier. The longer term challenge for China is to generate the type of safety net that allows its people to save less and consume more, resulting in a shift away from export and state investment dependency for the economy. But for now, the talk is no longer soft or hard landing for the economy, rather, how well the economy will be doing in 2013. The official growth target remains at 7.5%, but economists are speculating an 8 to 8.5% growth for 2013 depending on the world recovery during the second half of this year.
What’s Next?
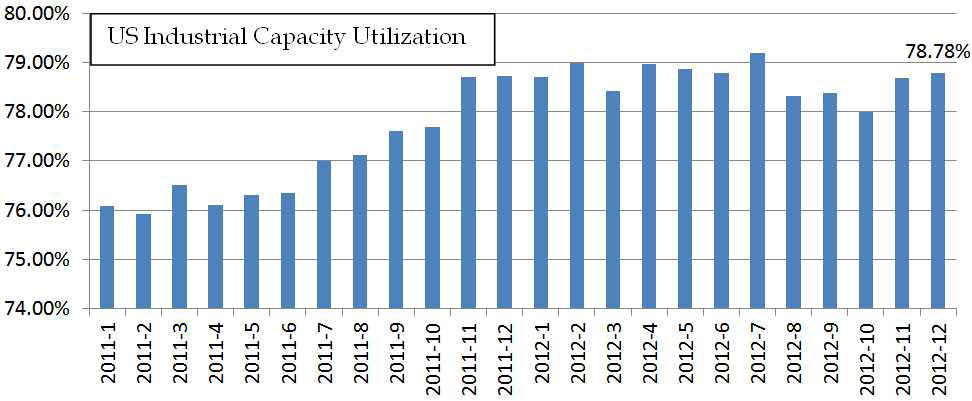
At the beginning of 2012, very few predicted the calmness in the stock markets or another year of interest rates going lower. There were lots of economic, political and financial risks waiting to wreak havoc on investment portfolios. Mario Dragi’s unlimited support statement last year and the unlimited quantitative easing from all major central banks have successfully calmed the nerves and eased the fears of investors worldwide. Clearly the Eurozone problems are not behind us and require the steadfast implementation of reforms and coordination. This remains the biggest systemic risk in the global economy. On a comparative basis, the U.S. looks a lot better. The short term policy risks do add uncertainty and concerns, but in the intermediate and long term, the U.S. economy is more dynamic and vibrant. With the US capacity utilization below 80% and the rest of the world still mired in a low growth environment, inflation is not expected to pose a challenge this year.
With inflation pressure easing in the emerging markets, the Reserve Bank of India announced that it will reduce the repurchase rate to 7.75% from 8% and also reduce the cash reserve ratio to 4% from 4.25%, effectively adding 180 billion rupees ($3.4 billion) into the banking system. This may signal the beginning of more easing in emerging markets which will fuel more trade, investments and growth in those regions.
For 2013, we expect interest rates to be range bound and no rate action from the Federal Reserve. There are still downside risks from the Eurozone, and when risk is heightened, the U.S. dollar will again serve as the safe haven. The U.S. economy is likely to perform better during the second half of the year as we work through the end of the government support that began at the end of the financial crisis and the beginning of tax increases and the uncertainty surrounding the budget fight. This is the much anticipated hand off from the public sector to the private sector. There is no question that the US economy is continuing to improve and the private sector is at a significantly better place than any time during the past 3 years. Stocks should do well on a risk adjusted basis in this low inflation, slow growth and easy monetary environment as compared to fixed income securities. Diversification remains the perennial prudent tool in managing portfolio risks.
