The US Market – non plus
The first quarter of 2013 has been nothing less than spectacular for the US stock market with the S&P 500 and the Dow Jones Industrial making new highs.
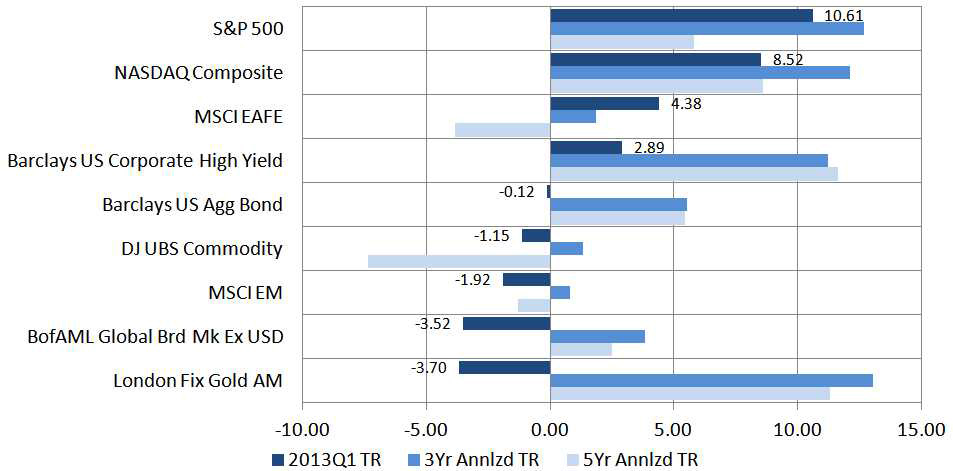
The ongoing stock market rally is a continuation of a “risk-on” push since the final quarter in 2012. Market prognosticators have been scrambling to update and restate their 2013 market return projections with investors torn between their lack of participation and the fear of an overheated market. The “risk-on” phenomenon has not been universal. As the index returns above illustrate, the outsized performance during the first quarter was confined to the U.S. stock market and, to a lesser extent, the high yield fixed income market. Commodities, equities in other developed and emerging markets, and gold have all performed poorly. There are three well-known contributing factors to the US market bullishness:
- The “euro breakup” tail risk has been chopped off for now since Mr. Mario Draghi’sfamous (the “bazooka”) July 26, 2012, speech, “the ECB is ready to do whatever it takesto preserve the euro”. The stock market has since re-priced itself to this reality.
- The introduction of the third quantitative easing by the Federal Reserve late last year guaranteed significant liquidity to the market and the perpetual maintenance of an extraordinarily low interest rate environment. The Federal Reserve’s actions have encouraged and assured risk taking.
- The U.S. economy has been improving, though slowly, on an absolute and relative basis when compared to other developed economies (the least dirty shirt.)
The outsized stock market return has not come from the traditional growth industries. The best performing sectors have been in the “safer” industry segments of the economy, with materials, energy, and high tech industry sectors’ performances trailing significantly.

The mutual fund flows into both US stock and bond mutual funds suggest that the rise in the stock market has not been due to the most anticipated Great Rotation where investors are massively reallocating their bond investments into stocks. The market has been fueled by new additions and flows from money market funds.

At the same time, gold and other commodities delivered negative returns which confirm the lack of demand reflecting a slow growth global economic environment with high unemployment, disinflation/recession, and over capacity. In the case of gold, the reduction in global macro risks and the lack of inflation in the foreseeable future contributed to its price adjustment.

The red hot stock market seems to be driven by investors looking for higher income through dividend paying stocks and an alternative to money market (i.e. no yield) investments while global macro fear is receding (see declining VIX and gold). However, the fact that the Great Rotation has not begun and the preference to invest in traditionally more conservative stock market segments suggests that investors remain cautious and uncertain and have been reluctant to take on significant and unchecked risk. We are not at “irrational exuberance”. The market is driven by monetary policy rather than economic fundamentals.

If our observation is correct, the fear, uncertainty and reluctance reflect investors’ sentiments towards the real economy while contemporaneously have provided support to a rising market in the near term.
The US Economy – Still in the New Normal
According to the Bureau of Labor Statistics (BLS), the advanced estimate for the real GDP – the output of goods and services produced by labor and property in the US after adjusting for inflation for the same period – increased at an annual rate of 2.5% in the first quarter of 2013 as compared to an increase of 0.4% in the fourth quarter 2012. The BLS attributed the increase to personal consumption expenditures, private inventory investment, exports, residential investment, and nonresidential fixed investment even though the quarter was negatively impacted by federal government and state and local government spending.
The Conference Board estimated the real GDP for 2013 to be at 1.9% with real consumer spending topping at 2.2%. The IMF World Economic Outlook published in April also projects the US economy to grow 1.9% this year. This means that the US economy will slow from here.

Over the past 14 quarters through 2012, or since the last quarter the GDP contracted (2009 Q2), the US economy grew at an average rate of 2.12%. The 2.5% quarterly annualized growth rate is on par, but if we compare to the real GDP growth rate of 3.04% during the 90’s decade, we remain in a slow growth environment. Since the Great Recession, the TARP program, other fiscal stimuli, unemployment insurance extension and bail out programs have helped to stabilize the US economy, but each time, as the handoff from the public to the private sector neared, the economy weakened. This led the Federal Reserve to extend and increase its large scale asset purchase programs, also known as quantitative easing, in an effort to stimulate the economy. Beginning 2013, all fiscal instruments have expired. The public sector is again looking to the private sector for a handoff.

Unlike the past handoffs, this latest attempt is coupled with higher income and employment tax increases, sequestration, and the unknown costs for implementing healthcare reform. Even though the full extent of sequestration has not been implemented and thus is seeping into the economy, defense spending has shrunk by double digits for the past two quarters and is expected to continue. Non-defense spending cuts will accelerate as the year goes on while municipal and state government spending are also contracting.

Although personal consumption expenditure continues to be the bright spot, the troubling sign is that disposable personal income has contracted. This means that consumers have been digging into their savings to support their expenditures. The personal savings rate has been trending down since the financial crisis. Unless personal income and/or credit spending expand, the current rate of personal expenditure increase cannot be sustained.

According to the Conference Board, consumer confidence improved in April because of their brighter short-term outlook regarding the economy and their income prospects. The Conference Board Consumer Confidence Index moved up from 61.9% in March to 68.1% in April. In contrast, the University of Michigan-Thomson Reuters Survey of Consumers tells a different story. Its Index of Consumer Conditions dropped along with the Index of Consumer Expectations. Although rising home prices have been reported around 38% of those surveyed, the upper income households expect a higher annual gain in the next 5 years. Only 25% of those surveyed expect a lower unemployment rate in the next 12 months with half expecting a stagnant household income in the year ahead.

Unemployment: Is reality as good as the report?
Since 70% of the US economy is derived from consumption, the state of the US consumer is critical to understanding where we are since the Great Recession. The Department of Labor released the latest U-3 unemployment rate, and it improved again to 7.5%.

The U-3 rate is the official unemployment rate and it represents the total unemployed as a percent of the civilian labor force. The U-6 rate provides a broader and more comprehensive picture of the employment status. U-6 reports the total unemployed, all persons marginally attached to the labor force, plus the total employed part time for economic reasons, as a percent of the civilian labor force. In April, the U-6 rate also improved from 13.9% in March to 13.4%. Other useful data is the average hours worked. In this case, after reaching a low of 33.8 hours in 2009, the April average hours worked is 34.4 hours. Although it is an improvement from its low, the hours worked has retreated a bit from the March reading of 34.6.
The systematic drop in U-3 rate seems disconnected when the US economy continues to improve anemically. The graph below offers one explanation. At the height of the Great Recession when the US economy contracted significantly and massive layoffs were taking place, the employment participation rate began to drop from then 66% to now 63.3%. This means that 2.7% of the employment population has since left the workforce and is no longer being counted. The U-3 rate would likely be much higher if the employment participation rate remained at the pre-crisis level. This is also a contributing factor to the continuing drop in initial and ongoing jobless claim data.

According to the DOL, 165,000 net new jobs were created in April. Although this is better than March, the latest new job creation rate is insufficient, after accounting for population growth, to keep the unemployment rate constant, let alone improve. This means that the unemployment rate, at best, should be steady if not increasing.

The bottom line is that the worst is behind us but we are certainly not back to normal or out of the woods. By simply adding up all the jobs lost and created since January 2008 through April 2013, a 5 year period, the US economy still has experienced a net loss of 2.568 million jobs.
Europe – No Pain No Gain?
The US remains the cleanest of the dirty shirts in the laundry. The April IMF World Economic Outlook projects the euro area economy to contract at a rate of 0.3% this year after experiencing negative 0.6% growth last year. The Outlook expects France (-0.1%), Italy (-1.5%) and Spain (-1.6%) to all contribute to the ongoing recession. We believe the projection remains too optimistic and expect revisions to the downside. The following set of economic data shows worsening, not bettering, economic scenario for the euro area:
-
Unemployment

With the largest economies in the euro area (except Germany) mired in double digit unemployment and in a multi-year austerity program, euro area governments have not been able to grow their economies.
-
Economic Contraction

The latest manufacturing data shows Europe firmly in contraction including the core countries of Germany and France.
According to Markit Research, the following is the ranking of countries by Manufacturing PMI as of the end of April:
Netherlands 48.2 2-month high Germany 48.1 4-month low Ireland 48.0 19-month low Austria 47.8 6-month low Italy 45.5 2-month high Greece 45.0 21-month high Spain 44.7 2-month high France 44.4 4-month high
The same Markit report notes, “The dual downturns in demand and production led to further job losses during April, the fifteenth reduction in payroll numbers in successive months. Spare capacity remained available despite the reduction in employment, as backlogs of work fell at the fastest pace in 2013 so far.”
With the Euro area in economic contraction and the US with sub-par growth, inflation is firmly in check. This gave ECB more leeway to take action.

Since its July 6, 2012, 25bp drop in rates, the European Central Bank (ECN) has been steadfast in holding its main refinancing rate at 75bp. With worsening economic conditions in the euro area and inflation slowed to 1.2% in April, (the lowest level since February 2010 and well below the ECB’s 2% price-stability threshold), the ECB took action on April 30th to lower its main refinancing rate by 25bp to 50bp. The ECB kept the deposit rate at 0% and reduced the marginal lending rate to 1% from 1.5%. We believe that this is a bit too little and a bit too late. On the margin, it may drive down the currency a little but will be insufficient to stimulate borrowing, growth or export.
Cyprus – cordon sanitaire?
Cyprus, a small island nation (17 billion euro GDP or less than 0.5% of the euro area economy) in the Mediterranean Sea near Turkey and Greece is divided into the north as the Turkish Cypriots and the south as the Greek Cypriots after the 1974 Turkish invasion. The Greek Cypriots became the Republic of Cyprus and joined the European Union in 2004 and joined the monetary union in 2008. Due to its low corporate tax, a legal system based on English law, following English accounting rules and double taxation treaties with a number of countries, Cyprus became a great location for setting up corporations and offshore banking services. In early 2008, a communist president was elected in the hope of unifying the country. Instead, the administration overspent and overpromised and created significant liabilities. Cypress was not significantly affected by the global recession in 2009 and only experienced a mild slowdown. At that time its bank assets were 900% of its GDP. In May 2011, Cyprus lost access to the international market. In July 2011, following an explosion that destroyed the power station that supplied more than half of the power to the nation, Cyprus entered a recession. Instead of asking the Troika (ECB, EC and IMF) for an economic package, Cyprus lobbied and succeeded in getting a 2.5 billion euro loan from Russia. Unlike a loan from the Troika, there were little structural reform expectations. Cyprus continued its fiscal business as usual.
In October 2011, European leaders decided to wipe out what ended up being about 80% of the value of Greek debt that the private sector held. For Cyprus, the write down of Greek debt was between 4.5 and 5 billion euro. Subsequently the European Banking Commission (EBA) required banks to market sovereign debt and raised bank capital requirements to a core tier-1 ratio of 9%. The two largest Cypriot banks needed approximately 2 billion euros of new capital. In late June 2012, all three major rating agencies rated the Cyprus sovereign paper below investment grade. In accordance with ECB rules, this made Cypriot debt ineligible as collateral for borrowing from the eurosystem, unless the ECB suspended the rules (done so in Greece, Portugal and Ireland). ECB decided not to suspend the eligibility rule for Cyprus.
Cyprus needed 17 billion euros and on March 15 reached a bailout agreement with the Troika for $10 billion and must find the remaining 7 billion euros internally. On March 25, a plan was agreed to where the second largest bank, Cyprus Popular Bank, will be closed with all assets transferred to the largest bank, Bank of Cyprus. All deposits up to 100,000 euros are insured and the remaining deposits will be subject to a tax and all shareholders value will be lost and bondholders will be fully written down. This is the first time that depositors, and not only shareholders and bondholders, are required to contribute to the bailout. Additionally restriction on capital is introduced preventing freedom of capital movement.
This is truly unprecedented. Depositors make deposit in banks to keep their money safe unlike shareholders and bondholders who elected to take political and investment risks. Now, bail-in by depositors is a reality and will be a part of the calculus for depositors and investors next time when another country in the euro area, or for that matter anywhere else, experiences a banking or sovereign debt crisis. The conditions set by the Troika have caused significant financial hardship on Cyprus which has created a financial depression, making the original 17 billion euros an under-estimation. With a shrinking tax base (high unemployment and a mass exodus of business) and the collapse of its main commerce – banking, the spiraling downward of an economy and a country has begun. The Troika stated that this is a one-off incident and should not be looked upon as a model for the future – a cordon sanitaire.
 |
 |
We believe a new chapter for solving the debt crisis has begun. The burden of bailing out banks is no longer strictly a taxpayer responsibility but also shared by depositors. This decision by the Troika further divides the north core economies with periphery economies of the south. The core countries, led by Germany, are trying their best to prevent a transfer of payment from their taxpayers. The message should be loud and clear: anyone with deposits or investments in weak banks or in financially troubled sovereigns should take their money and deposit and invest in the core country banks. This exacerbates the already difficult financial crisis facing the euro area and is not helping peripheral Europe. Some have also questioned another political motivation of the Troika. Knowing that Cyprus is an offshore banking and business haven for the Russians, is this a way for the Troika to force Russians to subsidize and to check their influence in Europe?
Have We Learned Anything?
The late March Cypriot banking crisis reminded us of the famous Andy Warhol’s saying: “In the future, everyone will be world-famous for 15 minutes.” The Cypriot event was so well contained that this would have been unthinkable a year ago. Back then, the markets reacted to every event and hung on every word of a politician. Today, the Cypriot banking crisis is a news cycle event. It is possible that we all have crisis fatigue and now that the “bazooka” has been placed on the table by the ECB, the world has moved on and is enjoying the calm. This calmness is reflected in the sovereign yield spread. No longer does the market demand a high rate of interest to invest in peripheral Europe.

How quickly the market forgets. As pointed out earlier, the euro area remains in a serious economic crisis with continuing contraction, rising unemployment, and a plan for austerity (not growth.) On April 26, Spanish Prime Minister Rajoy asked for a two year extension to meet the agreed to deficit target. Spain’s current 10.6% budget shortfall is far from the agreed to 3% EU limit.
There were banking reform actions that the euro area policymakers acknowledged last year that need to take place in order to prevent a breakup of the euro, to decouple the sovereign debt-bank vicious cycle and to better allocate resources. According to the April 2013 IMF Global Financial Stability Report, it states that: [t]o anchor financial stability in the euro area and for ongoing crisis management, fast and sustained progress toward an effective Single Supervisory Mechanism (SSM) and the completion of the banking union are essential. A Single Resolution Mechanism should become operational at around the same time as the SSM becomes effective. This should be accompanied by agreement on a time-bound roadmap to set up a single resolution authority and common deposit guarantee scheme with common backstops. Proposals to harmonize capital requirements, resolution, common deposit guarantee schemes, and insurance supervision frameworks at the EU level should be implemented promptly. Modalities and governance arrangements for direct recapitalization of banks by the European Stability Mechanism should also be established.
Since the sovereign debt-banking crisis, the European system remains fragile, fragmented, and change-resisting. What we have learned is that change can only happen when policymakers and politicians are standing at the edge of the abyss again when the next sovereign debt-banking event flare up occurs.
Central Bank – Let’s All Jump In
The biggest news in the central bankers’ club is a new and serious round of quantitative easing from Japan. On April 4, Bank of Japan Governor Haruhiko Kuroda announced that the central bank intends to inject the equivalent of $1.4 trillion into the economy in less than 2 years. This massive and aggressive attempt to conquer deflation and multi-decade malaise is unprecedented. With the market’s anticipation of a substantial central bank action and to meet the new 2% inflation target, the Japanese stock market has made significant gains, at the same time the Japanese currency has depreciated rapidly. In the short run, everything seems to be working. The new approach, known as Abenomic named after the Japanese Prime Minister, Shinzo Abe), makes Japanese products more competitive on the world stage and introduces inflation into its domestic economy over time, but being one of the most indebted nations on earth with poor demographic trends, there is plenty of doubt if the objectives can be achieved and sustained.
Conclusion
The US stock market seems to have defied gravity of late, making new highs almost daily.
There is no doubt that the world is awash in liquidity, and with interest rates at zero, investors are earning negative real returns. In order to counter the ravages of financial repression, savers and investors looking for returns must move along the risk continuum. We witness the move to high dividend paying stocks, non-investment grade (high yield junk bonds) bonds, bank loans (also non investment grade) and just about any investment that would pay a higher yield than the US treasuries and bank deposits.

All the while, there remain serious issues with the US economy, starting with the high unemployment rate, the declining participation rate, stagnant wages, and the slow to low growth economy here and worldwide (China and India are slowing too – there is no decoupling and domestic consumption in lieu of infrastructure or public investment will take years not months to turn.) From manufacturing data through April, every country is at or below expansion (PMI at 50). Currency depreciation, such as what Japan is engineering, will be short lived. Every country is trying to export its way out. Yes, there will be competitive devaluation globally (aka currency wars.) This is a race to the bottom and will effectively be meaningless. The US dollar has been rising since it is considered the growth engine in the developed markets. With the euro and yen both being pushed down by monetary policies, how long can we live with a strengthening dollar that will negatively impact our exports?
The rise in the stock market is not based on the economic fundamentals of the US economy. It is questionable if expectation for corporate earnings growth can be sustained if the real economy continues to remain weak. There is potential headwind as the year rolls on. The full effect of the sequestration and the impact of new taxes have not been fully felt.
Maybe the stock market will be derailed by exogenous factors such as a war in the Middle East, the escalation of territorial friction between China and Japan, another sovereign debt crisis, more sable rattling by the nuclear armed North Korea, and other known, and more likely unknown, political and financial risks. But until then, don’t fight the Fed. Their open-ended $85 billion bond purchase program and interest reinvestment into more bonds are signaling full speed ahead. When coupled with the zero short term rate policy, the guard rails are firmly in place. Even if the market pulls back 5% to 10% from here, the road towards the end of this year appears to remain positive for stocks and risk assets in general. If one is discouraged by the real economy, the currency wars, the uncertainty about central bank monetary actions globally, the drop in gold prices and a genuine lack of investment alternatives, do not look to Bitcoin as an alternative.

The virtual currency that is based on a mathematic algorithm has recently experienced a bubble burst of sorts. It seems that there is nowhere to hide when it comes to currency and investment risks.