Executive Summary
- The prolonged monetary accommodation by global central banks has reached its limit of effectiveness and is undermining financial resilience and creating unintended consequences in the market systems.
- The low interest rate environment has increased investment risk appetite and inflated assets prices and has not been efficient in returning animal sprit to the real economy. We are missing fiscal stimulus and structural reform.
- The world economy, led by the U.S., continues to slow in 2016, and the IMF again revised the global output projection downward. However, the bright spot is in the emerging markets and developing economies where the conditions are now more favorable for growth and investments.
- The FOMC September meeting press release and minutes made clear that a rate rise is imminent. Chair Yellen wants to make sure that the FOMC has clearly and repeatedly broadcast over a few meetings that a rate hike is on its way so that the financial markets have time to adjust and not overreact. As such, we expect a 25bp increase in the fed funds rate in December.
- The U.S. economy continues to create jobs month after month with the headline (U3) unemployment rate now at 5%. By historical measures, this is considered full employment. Yet, we have not yet witnessed increases in real wages, hours worked, or productivity. There is still slack in the labor economy, but there is a troubling sign for the long term unemployment turning into structural unemployment. The longer one is unemployed, the longer one will remain unemployed.
- Core inflation, as measured by core PCE, is now at 1.7% while core CPI is now at 2.3%. According to FOMC’s projections, the inflation rate is expected to reach the Fed’s 2% target within the next three years. We should care about the inflation rates for two reasons. First is to have a clear sign that this economy is no longer fighting a disinflation/deflation trend, which is dangerous. Second is to inform us of the temperature of the economy, which affects the pace of the FOMC’s rate normalization. Chair Yellen, in her recent speech, suggests that keeping an economy hotter (i.e. higher GDP, higher inflation and tighter employment) temporarily for longer would be good for the economy to finally reset from the severe recession. If this idea is carried out by the FOMC, it would mean lower rates for longer after the 2% inflation target is reached.
- Political risks globally are rising after almost a decade of slow growth and low employment. Populism, nationalism, xenophobia, and anti-globalism are all understandable consequences of the severe and crippling global recession, but the uncertainty as to how these emotions are expressed adds stress to the global financial system and questions many given assumptions and relationships.
IMF Risk Assessment of the World Economy
The International Monetary Fund (IMF) issued their Global Financial Stability Report[1] (GFSR) in October along with its World Economic Outlook for 2016[2] (GEO) in preparation for their annual gathering in Washington.
The GEO suggests that the near term risks have dampened with:
- Monetary and financial conditions easing from more central bank monetary stimulus which led to recovering risk appetite post Brexit in June
- Modest recovery in commodity prices which led to a decline in emerging market (EM) risks with improving capital flows
- Supportive external conditions helping to support a smoother EM corporate deleveraging
The following chart (Figure 1.1) from the GFRS shows the change in risks since its last report was published in April 2016.

This shows that there is no change to the macroeconomic, market and liquidity risks. These risks remain lower than during the global financial crisis. The more positive or aggressive monetary and financial conditions recently have led to greater degrees of investor risk appetite (bottom half of the web graph) which caused an increase in credit risk but was more favorable for EM risks.
The GEO suggests that the medium term risks have risen primarily due to the prolonged monetary accommodation in advanced economies.
- The lower interest for longer paradigm remains intact with markets expecting low inflation and low global growth. Although unconventional monetary policies have helped to stabilize economies since the Global Financial Crisis (GFC), the policies’ effectiveness has likely reached its limits and undermined financial resilience in the medium term. Banks, insurance companies and pension plans will continue to struggle under the low rate and low return environment. The longer the low-rate environment persists, the greater the erosion of capital and solvency buffers.
- One of the objectives for unconventional monetary policies is to fuel growth and risk appetite in the real economy, but this transmission mechanism of inflating asset prices to bring animal spirit back into the economy may have run its course with increasing equity valuation more as a function of low yield rather than higher earnings and economic activities.
- The EM is faced with the challenge of economic growth resulting from lower commodity prices, slower credit growth and weaker external demand.
- Political risk is rising after years of low wage growth and rising inequality. This ushers in populism, protectionism and inward looking policies. Thus, policy uncertainties are rising while the political climate undergoes a sea change.
The GEO specifically addressed the global stability challenge in this multi-year unconventional monetary policy era. Even though financial markets have benefited over the years, there is an urgent need to address the slowing global growth, strengthen the financial foundation of the global financial system and avoid a state of financial and economic stagnation. Years of slow income growth and widening inequality have given rise to protectionist and populist movements which limit policy tools for needed reforms and make policy changes. Further, this could jeopardize economic growth and financial stability aided by financial institutions struggling to maintain a healthy balance sheet. Ultimately, this would put downward pressure on consumers to delay spending and reduce private investment. Investors would steer to safer assets and de-risk.
The IMF warned that “policymakers need a more potent and balanced policy mix to deliver a stronger path for growth and financial stability. Financial markets have benefited from renewed risk appetite in the wake of unprecedented central bank actions. Although monetary accommodation is still needed to support the recovery, a more comprehensive set of policies would ease mounting burdens on central banks. Some monetary policies, such as negative interest rates, are reaching the limits of their effectiveness, and the medium term side effects of low rates are rising for banks and other financial institutions. There is an urgent need to implement fiscal and structural policies to bolster confidence and raise global growth, and deploy macro prudential policies to strengthen the foundations of the global financial system. This could help to avoid slipping into a state of financial and economic stagnation. A financial stagnation and protectionist scenario could result in a loss of world output by about 3 %through 2021.”
The Second Rate Hike is Almost Here
The much anticipated September 21st FOMC meeting resulted in no interest rate hike with three of the ten voting members dissented. This shows an increasing tension within the committee. Chair Yellen works hard each meeting to gain consensus on the FOMC and typically does not want to show policy disagreement among her members. In the FOMC press release, it stated that job gains remain solid with solid household spending, even though business capital spending remains weak. Although economic activity has picked up, inflation continues to run below 2%. The FOMC confirmed that the policy shall remain accommodative and supportive for the labor markets and inflation. The rate decision will continue to be predicated on inflation indicators, labor market conditions, and global economic and financial developments. The Committee stated that the case is strengthening for hiking rates and is waiting for further evidence of continued progress toward its objectives.
The FOMC Minutes[3] for the September meeting gave greater details to the FOMC’s future policy actions. The minutes revealed that “members generally agreed that the case for an increase in the policy rate had strengthened. But, with some slack likely remaining in the labor market and inflation continuing to run below the Committee’s objective, a majority of members judged that the Committee should, for the time being, await further evidence of progress toward its objectives of maximum employment and 2 percent inflation before increasing the target range for the federal funds rate.”
However, “three members preferred to raise the target range for the federal funds rate by 25 basis points at this meeting. They cautioned that postponing policy firming for too long could push the unemployment rate markedly below its longer-run normal rate over the next few years. If so, the Committee might then need to tighten policy more rapidly, thereby posing risks to continued economic expansion. A couple of these members expressed concern about the potential adverse effects on the credibility of the Committee’s policy communications if the next step in the gradual removal of accommodation was further postponed.” Several members held the view that it would be appropriate to raise interest rates soon if the economic conditions unfold consistently with the Committee’s expectation. The Committee agreed that the rate decision remains data dependent.
The September meeting also disclosed the economic projections submitted by each meeting participant offering their individual expected economic condition and outcome now and going forward. The following table shows the September projections as compared to the projections provided during the June 2016 meeting.

The FOMC median (the middle) projections have revised down the real GDP and inflation for 2016 along with projecting unemployment rate to rise in 2016 and to fall in 2018. Moreover, the Federal Funds rates across the entire projection timeline have been revised down significantly. According to these projections, we should expect one 25bp rate hike this year and two 25bp rate hikes next year.
The U.S. Economy
The second quarter real GDP was revised up to 1.4% from the second estimate at 1.1% while the first quarter was revised down to 0.8%. On a trailing basis, the U.S. economy was growing at a rate of 1.4% over the past 4 quarters.

The latest Bureau of Labor Statistics (BLS) release[4] on September 29th shows that the consumer (personal consumption expenditure) is the main driver of the economy growing at an annualized rate of 2.88%. Whereas capital expenditure (private domestic investment) remains a net detractor at a minus 1.34%, and the federal, state and local government expenditure and investment remains a drag at a negative 0.30% annualized rate.
According to the Atlanta Federal Reserve’s GDPNow[5] quantitative model forecast, the real GDP growth (seasonally adjusted annual rate) in the third quarter of 2016 is 1.9% on October 14, down from 2.1 percent on October 7. The forecast of third-quarter real personal consumption expenditures growth fell from 2.9% to 2.6%, according to the Census Bureau’s latest retail sales report. The advance estimates of U.S. retail and food services sales for September show that consumers continue to increase spending and are supporting the U.S. economic recovery and expansion.

With the exception of general merchandise stores (including department stores) and electronics and appliance stores, consumer spending has increased on a month-to-month and annual basis. Barring a new fiscal stimulus or return to reasonable global demand growth, capital expenditure by companies and government spending and investments will likely remain elusive. As long as the job economy remains positive, consumers will be continue to spend. This also means that there is a limit to how fast GDP will grow in the U.S. 
Employment-Unemployment
Employment or unemployment has been one of the biggest challenges for the Federal Reserve (Fed) since the Great Recession. This chart to the left shows the monthly new jobs created since January 2006. In September, 156,000 new jobs were created, as compared to 167,000 created in August. Further, the trailing 6 month average monthly new jobs created as of September were 169,000, as compared with 174,000, as of August. According to most economists, 75,000 to 120,000 new jobs are needed to satisfy new entries into the economy each month. The current job creation rate should further reduce slack in the labor force.

The U3 headline unemployment rate ticked up from 4.9% to 5% in September, suggesting that disparaged workers are coming back to look for jobs while the participation rate continues its rising trend. The U6 rate, on the other hand, remains high. This is the broadest measure that includes unemployed, underemployed and discouraged workers.

One of the factors that the Fed and most economists focus on is the long term unemployed to examine the “slack” in employment. Historically, an unemployed worker out of work for 6 months (26 weeks) or longer is less likely to gain employment as his or her skill is deemed to erode over time. In the September BLS employment situation release[6], it reported that the average duration of the unemployed is 27.5 weeks as compared to 26.2 weeks a year ago. Although the long term unemployed is dissipating, either because they have found work or left the workforce altogether, the extension of the average duration by over a week suggests that those re-employed have been at the shorter end of the “long-term unemployed” pool.
There are 1.974 million workers who have been unemployed for 27 weeks or longer, and 1.157 million have been out of work between 15 and 26 weeks, as compared to 2.064 million a year ago.

The graph above shows that the 15-26 week unemployed is close to the rate 10 years ago, but the 27 week plus unemployed remains elevated by historical standards. However, the elevated long term unemployed, which is a portion of the U6 rate, may remain elevated and makes up an increasing portion of the structurally unemployed. The current system does not have a good, effective way to deal with this challenge.
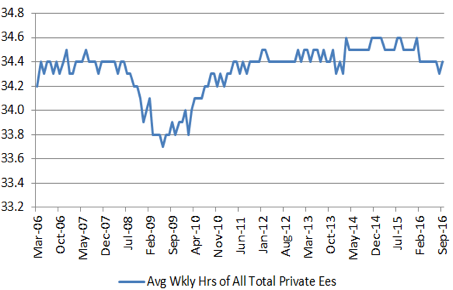
There are three commonly metrics to assess the robustness of the labor market. The first is the average hours worked, and the second is the average hourly earnings of private employees.
The average weekly hours has actually declined a bit since last year. This suggests that the 5% unemployment rate and 156,000 new jobs created have not been supportive to an increase in average hours worked in the private sector.
The hourly earnings rate offers a better trend. It has been pointing upward since 2015 with the trailing 1-year earnings change at 2.59%, as of September, with core inflation at approximately 1.5%.

The third metric is the Job Openings and Labor Turnover Survey (JOLTS). Job openings data is obvious that increasing job openings means employers are hiring. However, this data should not be viewed in isolation. The duration of large job openings could also suggest that there is a lack of qualified applicants. The turnover rate includes quits, layoffs and discharges, and other separations from service. The quit rates are generally voluntary separations initiated by the employee. Therefore, the quit rate can serve as a measure of workers’ willingness or abilities to leave jobs. As they feel more secure with the economy.

According to the JOLTS data through August from BLS, job opening has risen at a faster pace than the quits rate. This is not unusual as there is always a lag; as new job openings grow, it takes time for workers to feel comfortable to quit. On the other hand, this set of statistics does not inform us if there is a skillset mismatch between the new jobs created and the available workers to fill those new positions.
In summary, U.S. job creation is healthy, but slack remains in the labor economy. More time is likely needed to drive down the long term unemployed further. Hours worked is not likely to improve across the board even though average hourly wage may continue its current upward (albeit lumpy) climb.
Interest Rates
Since the September FOMC Press Release and Chair Yellen’s press conference, the market has increased the odds of a rate increase in the December meeting. On October 14th, Chair Yellen presented her Macroeconomic Research After the Crisis remarks at the Boston Fed’s 60th annual conference. The central theme of her research presentation is an attempt to answer the question: why 8-years after the Financial Crisis, does the U.S. economy remain in a slow growth or low aggregate demand mode? Economists broadly agree that gross domestic product (GDP) over time is primarily driven by the aggregate supply – the amount of output of goods and services the economy is capable of producing. Aggregate demand, on the other hand, is thought of as shorter-term fluctuations around the long term aggregate supply.
In the post Financial Crisis world, there has been a persistent shortfall in aggregate demand which has contributed to a low growth, lower GDP environment. This condition may be explained as “hysteresis” – originally a scientific term explaining the time gap between an action and its reaction. For example, when the unemployment rate is affected by a single historical event (the Great Recession brought on by the Financial Crisis), this sub-normal condition would persist for an extended period of time. This would lead to loss of job skills, adjust to a lower standard of living and contribute to a prolonged higher rate of structural unemployment. Thus, the hysteresis effect could have important policy implications.
Chair Yellen postulated that a more immediate and overwhelming policy response may be appropriate after a severe recession to minimize the depth and persistence of the economic downturn, thereby limiting the supply-side damage that may result. She suggested that:
- temporarily running a “high-pressure economy” may reverse the adverse supply-side effects after a severe recession – i.e. allowing the economy to run hotter (beyond the 2% targeted inflation rate and a “fuller” employment), and
- policymakers may want to aim at being more accommodative during recoveries than would be called for under the traditional view that supply is largely independent of demand – i.e. lower interest rates and extending quantitative easing (QE) for longer.
There is little doubt that Chair Yellen is a “dove” on the FOMC, and to contrast her view, Vice Chair Stanley Fischer remarked at the Economic Club of New York 3-days later on October 17th pointing out the dangers of a persistent low interest rate environment.
- Low, long-term interest rates could be a signal that the economy’s long-run growth prospects are dim. Contributing factors are low productivity growth and demographic changes affecting the balance of savings and investments where savings are preferred.
- Zero or negative lower bound interest rates limit central banks’ abilities to combat recessions and make the economy more vulnerable to adverse shocks. In fact, the low interest rates limit monetary policy and could result in longer and deeper recessions.
- Low rates could threaten financial stability as investors reach for yield that compresses net interest margins and make it harder for some financial institutions to build or maintain capital buffers.
Both Chair Yellen and Vice Chair Fischer could be right. The question is timeframe and if Chair Yellen’s proposal a bit too little and too late for the current U.S. economic recovery. Perhaps her proposed policy responses would be more effective next time we experience a severe recession. However, the suggestion of maintaining a “high-pressure economy” temporarily suggests that, even when the 2% core PCE inflation target has been met, we should not expect an immediate rate response or even an increase in rate normalization pace. For now, we affirm our expectation of the FOMC raising rates by 25bp during the December 2016 meeting.
What is the tea leaf telling us now?
The graph below shows the overall flattening of the yield curve by comparing the 2 year-10 year U.S. treasury interest rate spread (difference) with the 10 year-30 year spread. The tighter the spread, the flatter the 30-year yield curve. Since 2015, the spread has pretty much narrowed for the 10-30 with the exception of the widening spread since mid-September while the 2-10 has widened.

The next graph shows the 10-year and the 2-year yields since the beginning of this year. The sudden drop in yield at the beginning of the year is contributed to the risk-off environment during January and February when investors fled from equities and went into safe haven securities such as the U.S. treasuries. Then in the post Brexit Referendum, the risk off market was supported by more accommodative global central banks which pushed down the US treasury yields. A week after the no rate rise September FOMC meeting, the yields began to rise. But the yields are still lower than the beginning of the year: 1.77 for the 10-year as compared to the 2.25 on January 4th and 0.81 for the 2-year as compared to 1.04.

The December FOMC 25bp rate hike appears to be priced in to the short-end of the yield curve. As for the 10-year, this is more of a response of reverting the yield back to pre-Brexit rates as the much anticipated global fallout, thus far, appears to be very much contained. The bigger danger to the 10-year is the low inflation consensus.
The following graph compares the Jan 2015, Jan 2016 and Oct 17, 2016, yield curves. It clearly shows that the short-term yields have gone up for treasuries, but the rest of the yield curve remains below the Jan 2015 and Jan 2016 yield curves. This means the yield curve continues to flatten as the world responds to the FOMC expected rate hikes on the front end. The lower yields on the long end suggests a low inflation expectation with low global growth and an overall preference for the U.S. treasury yields (i.e. a persistent demand for relatively higher safe yield).

Disinflation-Inflation
The first of the two mandates for the FOMC is to foster maximum employment. This is closely related to the second mandate: to foster price stability. Ideally, FOMC would like to set the level of the federal funds rate (the neutral rate) that is consistent with the economy growing roughly at trend and operating near full employment. Full employment or the non-accelerating inflation rate of unemployment (NAIRU) is that level of unemployment below which inflation rises. The Fed believes that their zero bound interest rate policy and large scale asset purchase programs since the GFC have successfully or at least significantly healed the labor economy. However, the Fed has been much less affective in assuring price stability and reflating the economy.
The Fed has been using inflation targeting for some time. The 2% inflation target is a floor and not a ceiling. This means that the Fed is looking to drive (or wait for) inflation to go above 2%. If Chair Yellen’s policy objective is for a “high-pressure economy” to get the U.S. aggregate demand or GDP back to pre-crisis level, we should expect a) the appearance of wage inflation, b) recovering labor productivity, and c) an inflation rate approaching 3% or more, before the Fed really slamming on the monetary break. This approach is not the current FOMC’s consensus view. However, if this is a likely path, we should expect interest rate actions to remain subdued until the wage inflation, productivity and general inflation are at a much higher level, and then the rate normalization pace would significantly pick up. This would be very challenging and disruptive for fixed income investors to navigate this “data-dependent” yet very subjective monetary policy environment going forward.

The August CPI at 1.09% and PCE at 1% continue their recovery from the collapse in oil and commodities since the summer of 2014. The core (stripping out the volatile food and energy components) CPI has exceeded the FOMC’s inflation target of 2% and the core PCE is now at 1.7%. According to the FOMC’s September economic projections, the core PCE is expected to be at 1.7% for 2016, 1.8% in 2017 and reaching the targeted 2% in 2018.
We are beginning to see a gradual return of inflation as the commodity and energy prices stabilize. Furthermore, signs of spotty wage increases are beginning to be evident. It would not be long before broader wage inflation becomes evident; even if the structural unemployment and underemployment rates remain above trend. The economy is moving on, with or without lifting all workers.
The Global Economy
In its 2016 GEO, IMF has again revised downward the global output (or world GDP). This negative revision of 0.1% each for 2016 and 2017 shows the U.S. as the main culprit to be followed by the Euro Area. The bright spot is emerging markets and developing economies where 2016 projection has been revised upward by 0.1% with the biggest contribution from Russia. The disturbing projections are the world trade volumes being down for imports and exports throughout the advanced and emerging markets and developing economies. This confirms the slowing of the global economies and perhaps reflects the trend towards de-globalization.

Although the projection for 2016 is at an unchanged 3.1%, for the first half the growth rate was at 2.9%. This means the world has to grow at a rate of 3.3% or better to meet the projection. The U.S., which represents a significant portion of world GDP, has been expected to see a significant rebound from the weak first two quarters with estimates of over 3%, but the trend line from GDPNow shows that the economy is likely to be growing between 2.5% and 2.75%. The Euro Area, faced with post Brexit long term fallout and upcoming election uncertainties, is facing even more headwinds for growth. The 1.2% growth rate during the second quarter following a first quarter rate of 2.1% may not be an anomaly. There has to be an average 1.7% growth rate for the third and fourth quarter in order for the 2016 growth rate to meet the 1.7% projection. If the U.S., a stronger (more healed) economy, is expected to grow at a 1.6% rate for 2016, it is difficult to realize a 1.7% growth rate for the Euro Area this year. Japan’s growth rate for 2016 has been revised up by 0.2% to 0.5% for the year and from 0.1% to 0.6% for 2017. For Japan to improve, assumes continuing healing of the global economy since Japan is still an export dependent country and the Japanese monetary and fiscal policies would begin to show more signs of success.
The “bright” spot for the global economy is in emerging markets and developing economies. As a group, it recorded a slight pickup in momentum over the first half of 2016 after 5 consecutive years of decline. There are many contributing factors to poor growth according to the WEO: “a slowdown in China, whose spillovers are magnified by its lower reliance on import- and resource-intensive investment; continued adjustment to structurally lower commodity revenues in a number of commodity exporters; spillovers from persistently weak demand from advanced economies; and domestic strife, political discord, and geopolitical tensions in a number of countries.”
In the third quarter of 2016, however, emerging Asia continued to register strong growth, and the situation also improved slightly for stressed economies such as Brazil and Russia. Inflation or consumer prices have been revised down for 2016. After hitting a 10-year low in January 2016, oil prices rallied by 50% to $45 in August, mostly due to involuntary production outages that brought balance to the oil market. The good news is the stabilization of energy prices on a whole, and we continue to expect the oil price to trade between $50 to $55 per barrel range in the medium term.
The following two graphs from the WEO illustrate the oil supply and demand dynamics:

Although global oil demand (black line) projected to be fairly stable, global industrial production (red line) remains low or anemic. At the same time, the graph below shows that the oil inventory (blue line) continues to escalate with almost 40 days of consumption in inventory as compared to 30 days in 2005. This also does not take into account the speediness of getting oil ready from the U.S. shale production up and the other non-OPEC nation production from Russia, Brazil, Canada, Mexico and Norway, just to name a few. Of course, let’s not forget the non-conforming and financially troubled OPEC nations of Iran, Nigeria, Venezuela and Iraq. They are all looking to generate more and much more revenue to compensate for the lower oil price. This puts a lid on oil price globally.
According to the WEO: “The supply/excess and demand, for a variety of reasons, will likely put oil prices in check and it will be years before the past highs would be seen. Nonfuel commodity prices have also increased, with metals and agricultural commodity prices rising by 12% and 9%, respectively. Among agricultural commodities, food prices rose by 7% with increases in most items, except for a few such as corn and wheat. International prices have not fully reflected the adverse weather shock until recently, but El Niño and a potential La Niña have started to take a toll on international food markets.”
Headline inflation differs depending on where you are. Since the recent bottoming in 2015 for the advanced economies, the inflation trend is upward and beginning to dissipate the deflation/disinflation dynamics may be dissipating. For emerging markets and developing economies, inflation trend is projected to be downwards.
The following graphs from WEO show the inflation trends for advanced, emerging and developing nations and global aggregate since 2005. Since the high reached in 2011 and the low in 2015, the advanced economy is shown leaving the disinflationary trajectory to a projected reflationary trend. With the exception of Japan (yellow line), Euro Area and the U.S. are expected to turn upward in inflation with U.S. in the 2.5% range in 2017. Part of the reflation direction is due to the price recovery in energy and commodities. The stabilization of the food, metal and energy prices is a plus for exporters and producers and markets in general.

The Political Season
After the unexpected Brexit Referendum result this year, the world is spooked by the failure of conventional wisdom and polling about political outcome. What has been certain is now called into question. The November U.S. election is the most contentious in our living memory, and, regardless of whom the winner is, there will be unintended consequences on trade and immigration. This is another indication of globalization being challenged. With populism sweeping many developed economies, more regionalistic and nationalistic (inward looking) trends are developing at the same time the Euro Area is looking for (and needing) an ever closer union. This would lead to higher transactional costs and tariffs and trade wars that raise the cost of doing business and final prices. This is inflationary as well.
An Italian constitutional referendum is scheduled for December 4, 2016, for voters to approve an amendment to the Italian Constitution to transform the Senate of the Republic into a “Senate of Regions” comprised of 100 senators mainly made up of regional councilors and mayors. Prime Minister, Matteo Renzi, has vowed to resign if he loses the referendum, which would usher in a general election in which the Eurosceptic Five Star Movement would be expected to make huge gains. This self-imposed risk may lead to another Brexit in the making.
The far right, populist Freedom Party candidate, Norbert Hofer, has extended his lead heading into the Austrian presidential re-run against his rival Alexander Van der Bellen. The anti-immigrant Hofer campaign stresses the importance of security for Austria and represents a party that has been against the EU membership. The election is set for December 4th.
Theresa May is looking to invoke the much anticipated Article 50 to formally notify the EU of Brexit and to begin negotiating the terms of exit from the Eurozone. May reversed her prior position and agreed to allow members of parliament to vote on the final Brexit deal which invites the possibility of reversing Brexit. The base case remains that Brexit would happen, and the question is how and would it be a “hard” Brexit – i.e. completely outside the single market and renegotiate every trade and immigration and security agreement, just to name a few. In May’s Tory Party Conference speech she was clear that Brexit would not follow the Norway model or the Switzerland model but instead negotiate a different model that would allow British firms the maximum freedom to trade with and operate in the EU market and receive reciprocal relationships. The EU to include Germany have made it clear that there is a price for leaving the EU and it cannot be business as usual.
The Dutch general election will be held 2017 in the Netherlands on March 15, 2017, to elect all 150 members of the House of Representatives. The far-right Party for Freedom (PVV), the most popular Dutch party led by Geert Wildersleader, has taken a de-Islamification position to ban all Islamic symbols, mosques and the Koran from the country. Further, if elected, he threatened to pull the Netherlands immediately out of the EU to restore sovereignty to his country.
The French Presidential election is scheduled for April 2017 with a runoff in May, and at this stage, the current Socialist president Francois Holland is not expected to win. Marine Le Pen, the leader of France’s far-right National Front Party, vowed that if she is elected the country’s president she would ban all public displays of religious symbols and clothing. Le Pen is also a Eurosceptic.
Germany has its general election in late 2017. It is not clear if Angela Merkel is going to run for the 5th term, and her Christian Democratic Union (CDU) suffered a large defeat by the anti-immigrant and anti-Islam Alternative for Germany (AfD) party recently in her home district. Her recent approval rating has plummeted. This election is not only about Germany since she has been the central figure in holding the EU together since the global financial crisis.
Finally, in the autumn of 2017, China will appoint new members to the Politburo Standing Committee, the top decision-making body of the Communist Party. The members will be assigned as the party’s top leadership at the 19th National People’s Congress in March 2018. President Xi Jinping and Premier Li Keqiang are expected to remain in office. This will finalize Xi’s consolidation of power and appoint a successor-to-be five years ahead of the anticipated succession in 2022. However, this is not assured. Further, Xi is suspected of trying to repeal the mandatory retirement age and the 10-year leadership term. A lot of backroom dealing and political maneuvering will go on between now and autumn next year. The push by Xi to be designated as the core of the Communist Party (a position shared only by Mao and Deng before him) is an important change that moves China back to a paramount leader status instead of collective leadership to avoid the Mao-style leadership that brought in the Cultural Revolution.
Each election across the globe is an opportunity for change and for fringe politicians to seize power or substantially alter the status quo in unpredictable ways; not to mention the unintended consequences to and reaction by markets.
In Conclusion
The economist, Frank Knight, in his 1921 book, “Risk, Uncertainty, and Profit” distinguishes risk from uncertainty. A changing world brings new and changing opportunities, however the knowledge about the future is imperfect at best. Knight believes that “risk” refers to situations where we do not know the outcome but are able to accurately measure the odds, and “uncertainty” refers to situations where we do not even have the knowledge of the odds.
The extraordinary monetary experiment by global central banks over the past 7-years has compressed the income and return on all asset classes. We see this in equities where the low return is not commensurate with the risk expected. We see this in bonds where the term premium rapidly vanishes as the yield curve continues to flatten. The expected future returns of stocks and bonds have significantly lowered; yet, the volatility (one measure of risk) remains the same if not higher. Based on our review of the global financial, monetary, inflation and political factors, it is clear that uncertainty has increased along with risk. With an undefinable risk free rate, bonds and stocks are priced to perfection. Investors have been living in this stable disequilibrium for some time and are ready to exit in a moment’s notice.
Certain emerging markets may offer some opportunities. Their growth rates are higher and their financial conditions have improved with less sovereign debt on a relative basis. With inflation in check and possibly dropping, this gives central banks the room to lower their interest rates to spur growth and offer some downside protection. Certain emerging market local debts may make sense as a total return investment. Of course any investment in emerging market carries additional to significant risks. We have not decoupled between advanced economies and the emerging markets.
We do not see a recession on the horizon for the U.S., barring a major exogenous shock. Interest rates should remain low with a slow pace of normalization. Our base case is that there will be a 25bp interest rate hike in December this year and two 25bp hikes next year (i.e. the Fed Fund rate would be 1.25%). We expect wage inflation to be evident soon which will drive core inflation past 2% sooner rather than later. If keeping the economy hotter is the FOMC’s next stance, then we should not expect the FOMC to take immediate action once the core PCE passes the 2% inflation target. Chair Yellen has stated in the past that 2% inflation is the floor and not a trigger for a rate hike. However, can the FOMC granularly calibrate the economy and the degree of “hotness” incrementally without any policy mistakes? The rise in U.S. interest rates will continue to add to dollar strength. If it is gradual, the rest of the world (especially China) may be able to adjust peacefully. If the dollar continues to strengthen, it is disinflationary. Furthermore, the longer end of the yield curve is depressed and creating major challenges for yield-hungry financial institutions in meeting their obligations and risk cushion – pension funds, banks, and insurance companies. For as long as inflation appears to be in check and foreign central banks continue their bond and financial asset purchasing while keeping interest rates at zero to negative rates, the U.S. long term yields will remain depressed.
For now, let’s get through Trump vs. Clinton!
Sincerely,
CHAO & COMPANY, LTD.
Philip Chao
Principal & CIO
This quarterly commentary represents the current views of Chao & Company and they are subject to change. This Firm has no obligation or responsibility to update our views. The comments and views should not be deemed as Philip Chao, or any member of this Firm, offering personal or personalized investment advice. The quarterly commentary is informational only and is insufficient to be relied upon to make any financial or investment decisions or to make any changes to your financial condition.
[1] http://www.imf.org/external/pubs/ft/gfsr/2016/02/index.htm
[2] http://www.imf.org/external/pubs/ft/weo/2016/02/
[3] https://www.federalreserve.gov/monetarypolicy/files/fomcminutes20160921.pdf
[4] http://www.bea.gov/newsreleases/national/gdp/gdpnewsrelease.htm
[5] https://frbatlanta.org/cqer/research/gdpnow/?panel=1