The Dow Jones Industrial Average rose 742.22 points, or 6.4% to 12319.73 during its best first quarter in 12 years. The Standard & Poor’s 500-stock index was up 68.19 point, or 5.42% to 1325.83 during the first quarter. The good performances were not confined to the U.S. stock markets. The Dow Jones UBS Commodity Index, one of a number commodity benchmarks, was up 4.45%. The stock market return is that much more impressive when one looks at the macro risks that have been and continue to be present since the beginning of this year. Investors have discounted the market and geopolitical risks and pushed the stock markets higher. The double dip and deflation risks fears have been replaced by an enthusiasm about the U.S. economic recovery and corporate profits. Risk is on.
In February, the Chinese ushered in the lunar year of the Rabbit, a year of peace and tranquility. Thus far we have seen neither peace nor tranquility. The post Great Recession world remains fragile and full of unintended consequences or unexpected events being played out. Some are naming this period as “Black swan Fatigue”. The rippling civil unrest in the Middle East and North Africa (MENA),; the disfunctioning group of European countries trying to stabilize the ever expanding sovereign debt and banking crisis; the uncertainty of the outcome of a China engineered economic slowdown and the impact on global economic growth and commodity producing economies; the rising food and energy prices globally; and the earthquake in Japan and its economic and environmental aftermath, these are some of the major geopolitical and global economic issues that investors must take into consideration when investing, allocating and monitoring their portfolios, but none of these seem to have had a sustained impact on the stock market during the first quarter.
Japan’s Earthquake
The worst earthquake hit the northeast seaboard of Japan on March 11, the fifth-largest worldwide since 1900. The 8.9-magnitude earthquake resulted in a devastating tsunami. The Bank of Japan added 15 trillion yen ($183 billion) in emergency funds to the economy and offered to buy 3 trillion yen of government bonds from lenders in repurchase agreements. Reconstruction costs are expected to be very high and policymakers are mulling a supplementary budget to finance some of the bill. This will add further burden to the current moribund Japanese public finance. Budget deficit will increase and thoughts of putting the fiscal house in order will just have to wait for at least a couple of years.
The reactors at Fukushima Daiichi nuclear power plant were damaged and threatened to unleash significant environmental damages unseen since the disaster that occurred in 1986 at the Chernobyl Nuclear Power Plant in the Ukrainian SSR. Many factories remain closed one month after the disaster and the disruption to supply chains is felt worldwide. The supply chain disruption is a developing story as Japan continues rolling power blackouts and ongoing aftershocks. According to the Wall Street Journal, Japan is responsible for 20% of global production of semi-conductors, 60% of silicon wafers and 90% of BT resin. In the near term, certain global industries will be impacted since certain strategic components are solely manufactured in Japan. Overtime, alternative manufacturers will come online as suppliers. The natural disaster has a large impact on the Japanese economy and its GDP growth rate is expected to be closer to 1% than the pre-crisis level of 1.8%. The second quarter will see the biggest economic impact and as the reconstruction takes hold in 2012, Japan’s GDP should recover and significantly strengthen. A case in point is the sudden announcement by Toyota’s president that disruptions at component suppliers will prevent a resumption of full production at its global factories until November at the earliest, pointing to a deep drop in profitability and production. Although this devastating earthquake’s impact on overall GDP is temporary, Japan’s northeast coast will take years to recover, if at all. The environmental fallout remains unknown and may take decades to confirm. The U.S. stock market reacted on the day of this event and quickly recovered.
Quantitative Easing
In late November 2008, the Federal Reserve and Treasury Department unveiled a plan to release $800 billion into the U.S. economy as a part of the quantitative easing effort (“QE1”). One program made $200 billion available from the Federal Reserve Bank of New York to holders of securities backed by consumer debt, such as credit cards, car loans and student loans. Additionally, the Federal Reserve would purchase up to $500 billion in mortgage backed securities that have been backed by Fannie Mae, Freddie Mac and Ginnie Mae, the three government-sponsored enterprises created to promote home ownership. It would also buy another $100 billion in direct debt issued by those firms. All of these efforts were to put money back into the financial system and to promote lending to consumers and businesses. In early August 2010, there was a growing concern that the economy was slowing and at risk of falling into a double-dip recession. The Federal Reserve issued its most bearish outlook in more than a year and suggested a plan to buy additional long-term Treasuries. In the minutes of the November 3, 2010, Federal Open Market Committee, it stated that “the pace of recovery in output and employment continues to be slow. Household spending is increasing gradually, but remains constrained by high unemployment, modest income growth, lower housing wealth, and tight credit. Business spending on equipment and software is rising, though less rapidly than earlier in the year, while investment in nonresidential structures continues to be weak. Employers remain reluctant to add to payrolls. Housing starts continue to be depressed. Longer-term inflation expectations have remained stable, but measures of underlying inflation have trended lower in recent quarters. Consistent with its statutory mandate, the Committee seeks to foster maximum employment and price stability. To promote a stronger pace of economic recovery and to help ensure that inflation, over time, is at levels consistent with its mandate, the Committee decided today to expand its holdings of securities. The Committee will maintain its existing policy of reinvesting principal payments from its securities holdings. In addition, the Committee intends to purchase a further $600 billion of longer-term Treasury securities by the end of the second quarter of 2011, a pace of about $75 billion per month. The Committee will regularly review the pace of its securities purchases and the overall size of the asset-purchase program in light of incoming information and will adjust the program as needed to best foster maximum employment and price stability.” Quantitative easing two (“QE2”) was born.
In the eye of the Federal Reserve, QE1 was obviously not sufficient to produce the desired effect of sustainable economic growth, reflating the economy and normalizing the unemployment rate. The handoff from massive government support to the private sector was premature. The solution was to do more of the same and hope that the desired outcome could be reached by July 2011. QE2
extends the push towards risk assets in hope of the economy benefiting from the “wealth effect” created through higher asset prices. From November 2010 through March this year, the S&P 500 recorded a gain of over 13%. The injection of $75 billion each month continues to put pressure on the U.S. dollar which, in the short term, benefits the U.S. exporters. The dollar weakness is an indirect way to instill austerity in the U.S. When we pay more for goods, services and commodities due to a shrinking dollar, we can afford less and our standard of living is lowered. In the meantime, US bond yields have risen, reflecting the market’s concern about the value of the dollar and the rise in inflation (or the absence of deflation). The Federal Reserve, for now at least, is meeting one of its two mandates of price stability and not yet for employment stability. As QE2 is scheduled to come to an end at the end of June, a significant amount of debate continues about an exit strategy, but this may be premature. There is no assurance that the handoff from the public to the private sector this time is sustainable either. Although QE3 is considered a statistical outlier (i.e. not likely), the strength of the economic recovery will again be a topic of discussion once the earning season is over. Consumer sentiment, housing prices, manufacturing activities, and income growth are all slowing while headline inflation is accelerating. Consumer debt, although it has been trending down, remains extremely high.
American Consumers
Since 2002, consumer debt has exceeded total household debt and the gap remains wide. At the same time unemployment remains high and despite recent .
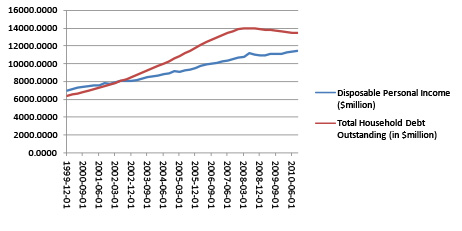 improvement, the broader employment gauge of U6 remains extremely troublesome Structural unemployment is increasingly evident and hard to overcome. The reality of the future is for the U.S. economy to sustain an above average permanent unemployment rate. This is further evidence that consumers cannot be the engine that drives this economy to a sustainable recovery.

U4 = Total unemployment + discouraged workers as a % of the civilian labor force
U6 = Total unemployed + all marginally attached workers + total employed part time for economic reasons as a % of the civilian labor force.
The US Dollar
There are signs of negative effects resulting from large sale asset purchases by the Federal Reserve. The following chart provided by Ned Davis Research shows the movement so of stocks (S&P 500 Index), Treasury Yields (10-Year Treasury Notes), U.S. Dollar and gold price. Since the expansion of QE1 and the subsequent QE2, gold prices have almost doubled while the U.S. Dollar has established a downward trend. Since QE2, the US Treasury has begun to lose value as the market demanded higher interest rates. On April 18., 2011, Standard & Poor’s issued in its press release affirming the current ‘AAA/A-1+’ sovereign credit ratings on the U.S., however, it went on to say the following:
“The economy of the U.S. is flexible and highly diversified, the country’s effective monetary policies have supported output growth while containing inflationary pressures, and a consistent global preference for the U.S. dollar over all other currencies gives the country unique external liquidity. Because the U.S. has, relative to its ‘AAA’ peers, what we consider to be very large budget deficits and rising government indebtedness and the path to addressing these is not clear to us, we have revised our outlook on the long-term rating to negative from stable. We believe there is a material risk that U.S. policymakers might not reach an agreement on how to address medium- and long-term budgetary challenges by 2013; if an agreement is not reached and meaningful implementation is not begun by then, this would in our view render the U.S. fiscal profile meaningfully weaker than that of peer ‘AAA’ sovereigns.”

There seems to be little doubt that the U.S. Dollar is losing its value on a secular basis and its reserve currency status will erode and perhaps one day be replaced by one or a basket of currencies, but the fact that no one single country in the foreseeable future has the financial stability or strength to replace the U.S. dollar means that the U.S. still has time to put its economic house in order and restore the confidence in its currency and reverse course. On a cyclical basis, the U.S. would rather debase its currency to make its exports more competitive and to make the repayment of its debt a little cheaper. This is the U.S. version of a soft default on its social contracts. Instead of the European model of cutting social programs and extending retirement age, the U.S. is making everyone’s standard of living lower through U.S. dollar depreciation and importing inflation over time. We will be able to afford less as each dollar we receive or earn will buy progressively fewer goods and services.
Inflation
The chart below shows the monthly changes for core-CPI versus the CPI. The Core-CPI excludes the volatile food and energy prices. The Federal Reserve uses the Core-CPI as the true inflation measure for its policy making purpose even though, as consumers, we cannot ignore food and energy costs since both are integral parts to our daily lives. During QE2, both CPI indices have shown increases. Many suggest that the Federal Reserve’s actions have led to a worldwide commodity price surge. It is the desired outcome of QE2 that investors embrace risk assets in hope of greater returns and some of that push went to developing economies and commodities. It is not likely that one can definitively prove that there is a binary and straight line relationship between the Federal Reserve’s large scale asset purchase actions with a rise in commodity prices (see April 2, 011 FRBSF Economic Letter – Are Large=Scale Asset Purchases Fueling the Rise in Commodity Prices? ). Commodity prices are primarily driven by supply and demand. With a revival of demand at the end of the

worldwide recession in 2009 and at the same time a shrinking supply (weather or geopolitical related events), commodity prices went up. However, since most commodities are priced in U.S. dollars, the shrinking dollar makes commodity prices drop in other currencies which would naturally lead to increased demand, resulting in price increases over time.
Oil and Price Stability
The relatively peaceful revolution that started in Tunisia in December last year and led to the ouster of its 23-year president Zine El Abidine Ben Ali in January this year was a shock. The overthrow of the government was precipitated by a massive discontent of its citizens. Not unlike many other MENA nations, years of an authoritarian regime has resulted in systematic deterioration of quality of life for the average citizens while concentrated wealth and economic opportunities in the hands of the elite. High unemployment, food inflation, poor living conditions and absence of political freedoms have all contributed to the uprising. The success in people’s power in Tunisia has quickly spread to Egypt. A popular uprising through a series of demonstrations and marches that began on January 25, 2011, led to the resignation of its 57-year president Hosni Mubarak on February 11. Since then, civil unrest to outright civil war have broken out in Algeria, Bahrain, Yemen, Libya and Syria. The stories are all similar. A strong man rules his country with an iron fist and favors small groups of people while suppressing opportunities and freedom for the rest of his country. A disproportional segment of the population is made up of young, unemployed citizens with poor prospects for a job. With rising commodity inflation and little hope for change, citizens are rising up against their governments and leaders. Fighting corruption, poverty and political suppression quickly transforms from local political issues to a global energy crisis. Thus far, the biggest oil producing countries have been relatively unaffected, but sentiments can change very quickly. Also the longer the unrests and civil wars continue in neighboring countries, the more likely one or more oil producing nations will be affected. The following chart shows the North Sea Brent Crude Oil spot prices since 2008 (the Brent prices are more sensitive to the Middle east unrest than the U.S. West Texas Intermediate oil price). Although the significant price increases since March 2009 cannot be attributable solely to the current unrests in MENA, market observers suggest that there is approximately a $20 per barrel premium being paid for the Middle East uncertainty. The unpredictable outcome in the MENA region adds uncertainty and possible drag on the world economy. If a oil shock results, it is

likely that the U.S.will fall back into a recession due to the sharp rise in gas prices. This would also negatively impact the world economy.
China
Balancing an industrial policy that is efficient in promoting and protecting certain industries in China and manipulating its currency to maintain a high level of employment while keeping its exports competitive is a tough act. One of the unintended consequences is inflation.
The Ned Davis Research graph shows clearly that since the end of the recession in 2009, inflation in China has accelerated with CPI currently at 5.4%. Over 2% of the CPI is attributable to food inflation, which is rising at a 12% rate currently. China has seen hundreds of truckers hold protests over rising costs. Truckers are striking due to their inability to make ends meet with diesel fuel costs rising, among other expenses. The Chinese government controls the diesel and other fuel prices. While it has raised prices repeatedly, its increases have lagged behind the surge in crude oil. This year China-set prices for diesel and gasoline have risen about 10% as compared to a 20% increase in crude oil prices. This illustrates that inflation is and could further fuel unrest in China which its leadership is desperately trying to avoid. China singled out fighting inflation as its top economic priority this year.

On April 5, China raised its benchmark interest rates for the fourth time in less than six months. The increase sets the one-year yuan lending rate at 6.31% and the one-year yuan deposit rate at 3.25%. It has also raised the benchmark reserve requirement ratio for banks three times this year, reducing their lending pool of funds,Everyone agrees that inflation has not yet peaked in China and there is at least one more rate hike to go. This assumes that the monetary tightening will be sufficient to rein in food and fuel inflation.
Food Inflation
According to the World Bank’s Food Price Watch , global food prices are 36% above their levels a year ago and remain volatile, close to their 2008 peak. Key staples going through the roof include maize (74%), wheat (69%), soybeans (36%) and sugar (21%). “Groundbreaking events are adding to the list of things pushing up food prices. Erratic weather in key grain exporting countries, the increasing crop use for biofuel production, export restrictions, and low global stocks, have been key contributors to the spike. Now, it is also linked to surging fuel prices connected to events in the Middle East and North Africa. Crude oil, for instance, increased 21% in the first three months of 2011, pushing food prices up because it raises the cost of inputs needed in agriculture, among other things.”
| Change in Average Price | ||
| Commodity Source: World Bank |
1st quarter 2011/ 1st Quarter 2010 (%) | 1st quarter 2011/ 4th Quarter 2010 (%) |
| Wheat (US, HRW) | 69.1 | 16.5 |
| Maize (No. 2, yellow) | 73.8 | 17.1 |
| Rice (25%, Thai) | -2.4 | -1.3 |
| Soybeans (US, cif, Rotterdam) | 35.6 | 8.3 |
| Soybean meal (cif Rotterdam) | 18.3 | 3.1 |
| Palm Oil (Malaysia, 5% bulk) | 54.9 | 12.9 |
| Sugar (World) | 21.0 | 8.1 |
| Bananas (Central/South AMerica0 | 23.4 | 21.1 |
| Beef (Australia/New Zealand) | 30.3 | 16.0 |
Increases in food and fuel prices can be difficult for governments to counter. For countries that are experiencing strong growth and have recovered from the global recession, tightening monetary policies may be a solution to contain overall inflationary pressure. For countries that are still recovering from the global recession or where recovery remains fragile, tightening monetary policy would likely tip these countries back into a recession. In the case of the U.S., if gas and food prices continue at the current trajectory, consumer behaviors will change and our economy will return to a negative growth environment. With interest rates near zero and weakening domestic consumption, there is very little the Federal Reserve can do. Raising interest rates is out of the question. The only answer seems to be QE3 to try again.
The World Bank report states that “[s]ince June 2010, an additional 44 million people fell below the $1.25 poverty line as a result of higher food prices. Simulations show that a further 10% increase in the Food Price Index could lead to 10 million people falling into poverty, and a 30% increase could increase poverty by 34 million people. Low-income and lower-middle-income countries are experiencing on average, 5 percentage points higher food price inflation compared to better-off countries.”

The biggest risk to the world economy is the rolling civil unrest and headline risks in oil and commodity producing countries which will continue to disrupt production and supply which leads to ever increasing prices. If countries and regions are not able to contain the ever escalating food and energy prices as their citizens sink further into poverty, more unrest and instability will result which feeds further speculation on food and oil prices. If the global economy continues to recover and expand, the natural increase in demand will put even more pressure on all commodities. This is a real set of risks for which the stock markets seem not to account.
Conclusion
The dual speed world where developing economies have recovered from the global recession and pushing forward with economic expansion at a 6.5% per annum GDP rate while the advanced economies still struggling with high unemployment and mountains of debt are expected to grow at a rate of 2.5% per annum. The IMF World Economic and Financial Surveys offers an excellent summary of the state of the Global economy.
The New Normal remains intact. On a secular basis, the developing economies will continue to lead the world in growth and cyclically face the duel headwind of inflation and headline risk of civil unrest and instability. The developed economy will continue to confront the aftermath of an overleveraged world with high structural unemployment and little room for the consumer “animal spirit”. The continuing depreciation of the US dollar is only a symptom of a much biggest issue: American’s irresponsible way of using the reserve currency status to make the rest of the world to pay for our years of excesses. The market will increasingly demand more interests to hold long term U.S. Treasury securities. In the post Great Recession world, investors can no longer assume interest rate risks when investing in the developed economies. Credit risk is now real and must be priced into developed market sovereign debts. In the past, investors only speak of credit risks when dealing in developing or emerging market sovereign debts. Depending on how the hand off from the US government after the end of QE2 to the private sector goes, QE3 is a possibility but no change is more likely the outcome. This means that the Federal Reserve will leave the excess liquidity in the market and hope that the intended benefit is realized. The Federal Reserve is absolutely committed to do everything it can to meet its dual mandates. But at what cost to the US and its way of life?
The stock market is on a tear, and the second quarter should continue to be excellent since the first quarter corporate earnings remain robust. Once the earnings season is over, the market will again focus on the risks and headwinds faced by the US and world economy. At which point, the world may not look as positive. There are many macro risks present and an equity market pull back is likely in the summer. “Risk off” is again a real possibility. Don’t count the US dollar out quite yet. As long as it is the world’s reserve currency, when there is extreme turmoil, dollar appreciates. The road is bumpy and full of surprises in this age of the New Normal.
EXHIBIT A – Mutual-Fund Yardsticks
Fund category performance as of March 31, 2011. Total return includes capital appreciation and reinvested distributions. Returns shown for periods of one year or less are cumulative. Three-year, five-year and 10-year returns are annualized.
| % TOTAL RETURN | |||||
| INVESTMENT OBJECTIVE |
1ST QTR. |
1 YEAR |
3 YEARS |
5 YEARS |
10 YEARS |
| Large-Cap Core Funds | 5.39 | 13.45 | 1.91 | 2.20 | 3.11 |
| Large-Cap Growth Funds | 5.20 | 16.06 | 3.16 | 2.90 | 2.46 |
| Large-Cap Value Funds | 5.91 | 12.96 | 0.61 | 1.05 | 3.57 |
| Mid-Cap Core Funds | 7.83 | 22.90 | 6.73 | 4.17 | 7.44 |
| Mid-Cap Growth Funds | 8.17 | 27.45 | 6.99 | 4.42 | 6.11 |
| Mid-Cap Value Funds | 7.05 | 20.74 | 6.53 | 3.52 | 8.40 |
| Small-Cap Core Funds | 4.30 | 25.23 | 10.52 | 5.68 | 8.87 |
| Small-Cap Growth Funds | 9.38 | 29.91 | 9.19 | 3.69 | 6.52 |
| Small-Cap Value Funds | 6.90 | 21.80 | 8.22 | 2.97 | 9.78 |
| Multi-Cap Core Funds | 6.07 | 16.68 | 3.19 | 2.46 | 4.56 |
| Multi-Cap Growth Funds | 6.29 | 20.39 | 4.88 | 3.59 | 4.01 |
| Multi-Cap Value Funds | 6.90 | 16.07 | 2.65 | 1.65 | 5.09 |
| Equity Income Funds | 5.84 | 16.51 | 2.65 | 3.46 | 4.68 |
| S&P 500 Funds | 5.77 | 14.98 | 1.84 | 2.11 | 2.77 |
| Specialty Diversified Equity | 2.75 | 9.56 | 3.15 | 2.14 | -1.73 |
| Balanced Funds | 3.78 | 11.91 | 3.49 | 3.51 | 4.18 |
| Stock/Bond Blend Funds | 3.66 | 12.26 | 3.25 | 3.48 | 4.67 |
| All USDE Funds | 6.22 | 18.14 | 3.93 | 2.61 | 4.78 |
| Science & Technology Funds | 6.11 | 23.75 | 8.61 | 3.97 | 1.77 |
| Telecommunication Funds | 5.23 | 23.22 | 1.17 | -1.27 | -2.59 |
| Health/Biotechnology Funds | 7.29 | 10.21 | 7.58 | 3.66 | 4.62 |
| Utility Funds | 4.37 | 14.86 | -0.63 | 4.93 | 3.75 |
| Natural Resources Funds | 12.68 | 34.34 | 1.57 | 6.82 | 10.72 |
| Sector Funds | 5.01 | 17.30 | -0.44 | -1.40 | 6.78 |
| Real Estate Funds | 6.23 | 23.52 | 1.49 | 0.52 | 10.52 |
| Financial Services Funds | 2.30 | 2.95 | -5.79 | -7.49 | 0.57 |
| Global Funds | 4.19 | 14.19 | 0.60 | 2.41 | 4.70 |
| International Stock Funds | 3.10 | 12.51 | -2.41 | 1.56 | 5.60 |
| European Region Funds | 5.25 | 13.83 | -3.59 | 1.74 | 6.55 |
| Emerging Markets Funds | 0.47 | 16.45 | 2.03 | 8.37 | 16.06 |
| Latin American Funds | -1.28 | 16.53 | 0.38 | 13.57 | 20.55 |
| Pacific Region Funds | -0.91 | 12.21 | 1.73 | 6.90 | 10.50 |
| Gold Oriented Funds | -0.60 | 44.38 | 11.95 | 14.26 | 25.38 |
| Short-Term Bond Funds | 0.59 | 3.23 | 3.43 | 3.83 | 3.61 |
| Long-Term Bond Funds | 1.31 | 7.24 | 6.23 | 5.57 | 5.58 |
| Intermediate Bond Funds | 0.90 | 6.15 | 5.58 | 5.52 | 5.11 |
| Intermediate U.S. Funds | 1.34 | 6.04 | 3.32 | 5.15 | 4.88 |
| Short-Term U.S. Funds | 0.15 | 2.18 | 2.84 | 3.95 | 3.49 |
| Long-Term U.S. Funds | -0.31 | 4.59 | 3.61 | 4.91 | 4.53 |
| General U.S. Taxable Funds | 1.06 | 5.87 | 4.11 | 4.91 | 6.49 |
| High Yield Taxable Funds | 3.67 | 13.58 | 9.70 | 6.86 | 6.92 |
| Mortgage Funds | 0.60 | 5.04 | 5.50 | 5.57 | 4.81 |
| World Bond Funds | 1.47 | 7.52 | 5.05 | 6.22 | 7.90 |
| All Taxable Bond Funds | 1.38 | 6.83 | 5.63 | 5.26 | 5.13 |
| Short-Term Muni Funds | 0.37 | 1.49 | 2.58 | 2.86 | 3.00 |
| Intermediate Muni Funds | 0.52 | 1.86 | 3.57 | 3.49 | 3.63 |
| General Muni Funds | 0.07 | 0.41 | 2.96 | 2.52 | 3.50 |
| Single-State Municipal Funds | -0.03 | 0.22 | 3.04 | 2.84 | 3.60 |
| High Yield Municipal Funds | -0.91 | 0.17 | 1.22 | 0.69 | 3.34 |
| Insured Muni Funds | 0.04 | -0.20 | 2.96 | 2.45 | 3.38 |
| Dow Jones IndDlyReinv | 7.07 | 16.51 | 3.12 | 4.87 | 4.73 |
| S & P 500 Daily Reinv | 5.92 | 15.64 | 2.35 | 2.62 | 3.29 |
| S & P Midcap 400 IX Tr | 9.36 | 26.95 | 10.00 | 6.07 | 9.36 |
| Russell 2000 IX Tr | 7.94 | 25.79 | 8.57 | 3.35 | 7.87 |
| DJ U.S. Total Stock Market | 6.37 | 17.73 | 3.69 | 3.18 | 4.56 |
| Russell 3000 IX Tr | 6.38 | 17.41 | 3.42 | 2.95 | 4.13 |
| DJ U.S. TSM Growth | 6.42 | 19.59 | 6.53 | 4.71 | 4.06 |
| DJ U.S. TSM Value | 6.31 | 15.86 | 0.82 | 1.70 | 4.91 |
| Barclay Agg. Bond | 0.42 | 5.12 | 5.30 | 6.03 | n.a. |
| Barclays Muni. Bond | 0.51 | 1.63 | 4.47 | 4.14 | n.a. |
| MSCI EAFE IX ID | 2.67 | 7.47 | -5.83 | -1.41 | 2.87 |
| Dow Jones Global Ex US Tr | 3.19 | 14.11 | -0.22 | 3.70 | 7.83 |
| S & P 500/BARRA G IX TR | n.a. | n.a. | n.a. | n.a. | n.a. |
| S & P 500/BARRA V IX TR | n.a. | n.a. | n.a. | n.a. | n.a. |
| S&P Sm Cap 600 TR IX | 7.71 | 25.27 | 8.36 | 3.67 | 9.20 |
| T-Bill 3 Month Index Tr | 0.03 | 0.14 | 0.40 | 1.92 | 2.00 |
| Dow Jones Corp BdTr Ix | 0.32 | 6.91 | 9.01 | 7.62 | 7.17 |
Note: All bond-fund data are preliminary
n.a. = Not available.
- http://www.frbsf.org/publications/economics/letter/2011/el2011-10.html
- http://www.worldbank.org/foodcrisis/foodpricewatch/april_2011.html
- http://www.worldbank.org/foodcrisis/foodpricewatch/april_2011.html
- http://www.imf.org/external/pubs/ft/weo/2011/01/pdf/text.pdf