On October 27th, the Bureau of Economic Analysis (BEA) released its advance estimate for the 2017 Q3 real GDP[1] and it came in at 3.0% following a revised 3.1% for the second quarter. If the 4th quarter remains at the 3% real annualized growth rate, the projected real GDP for 2017 would be at the 2015 level of 2.6%.
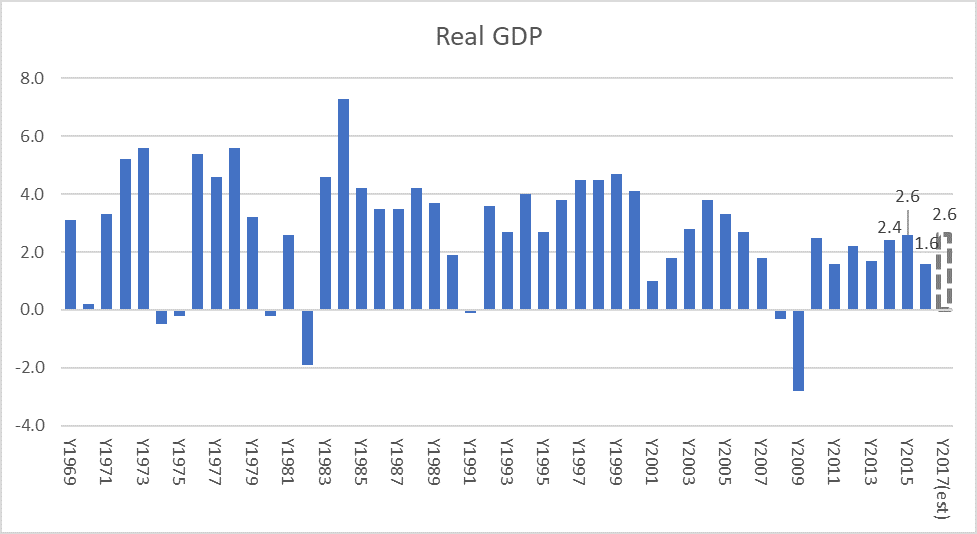
It is a positive surprise that the U.S. economy grew at 3% even with the devastating twin hurricanes of Harvey and Irma on the mainland. The Conference Board estimated the third quarter at 2.6% while the Atlanta Federal Reserve Bank’s GDPNow projected the third quarter rate at 2.5%[2]
Beware that the first estimate tends to be revised. According to BEA, this estimate is “based on source data that are incomplete or subject to further revision by the source agency.”
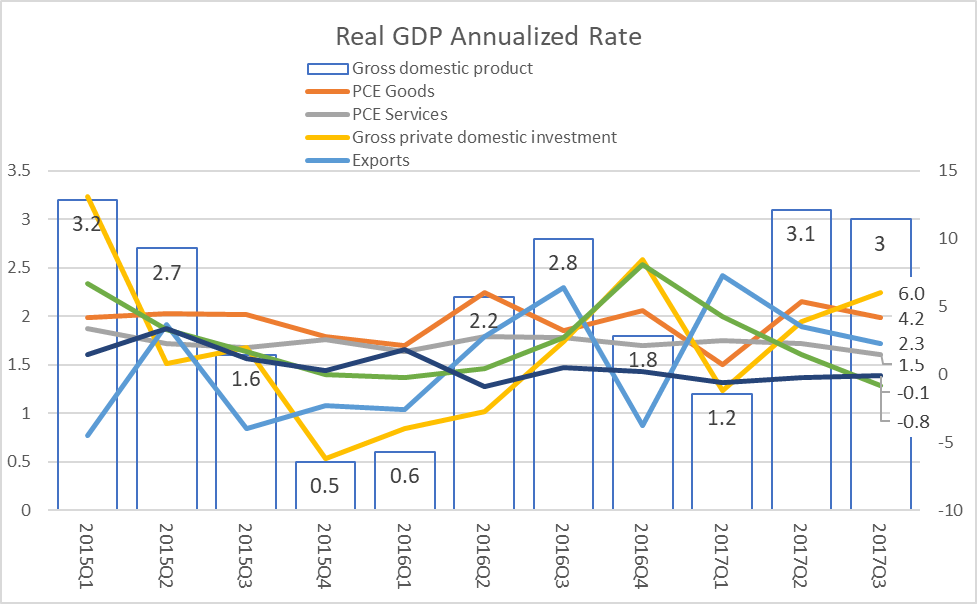 We examined the main components of the GDP to see what are that factors that contributed to the 3% rate. Import and government (primarily state and local) spending were negative contributors, while capital expenditure (capex) by companies have shot up to an annualized rate of 6%. Consumer spending for goods remains healthy at 4.3% and 2.3% for services. However, the rate of growth has moved downward from the second quarter with capex the only contributor with a positive rate of change.
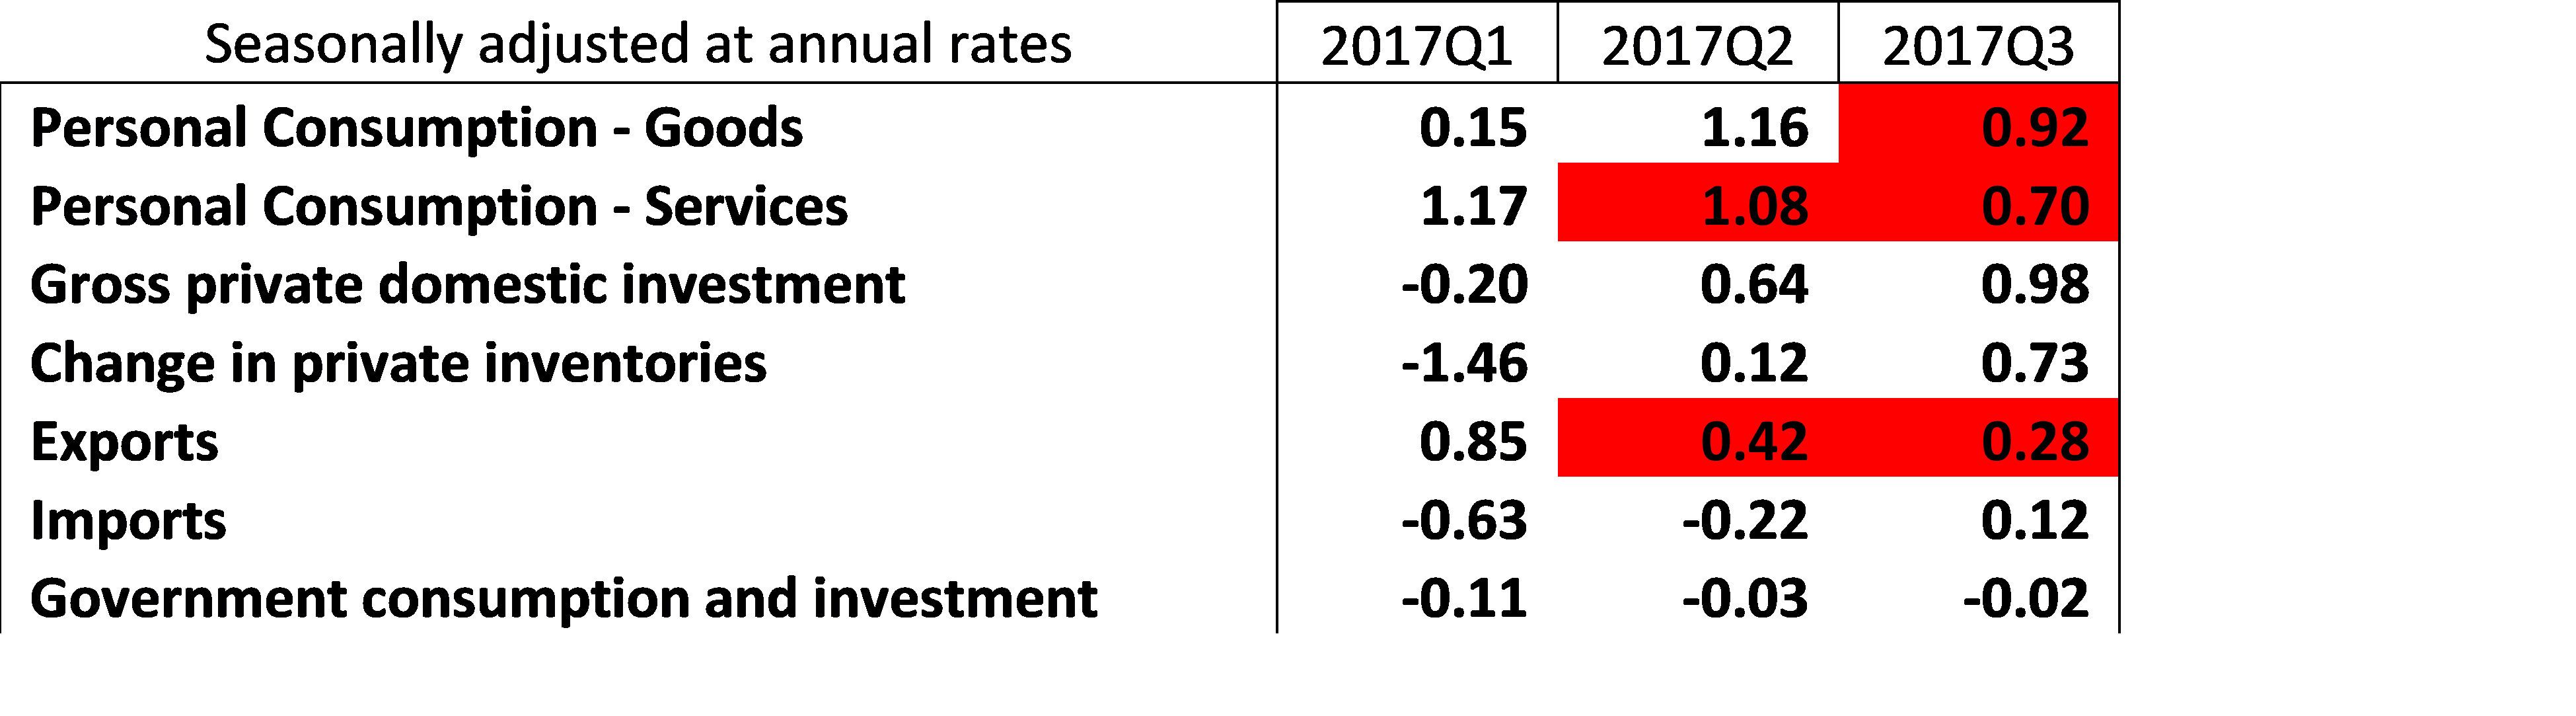
Change in private inventories contributed 0.73 to the GDP. This likely reflects businesses increasing inventory in anticipation for better demand. The following table shows the percentage contribution to the Q3 GDP for most major categories. The numbers in red highlights the slowing trend from the prior quarter. For example, although consumers continue to be a positive factor, the contribution is reducing.
Other looks at the consumer from the data are as follows. The first graph shows the increasing consumer spending/outlay and decreasing savings. This suggests that the current increase in consumption came from consumers digging into their savings.
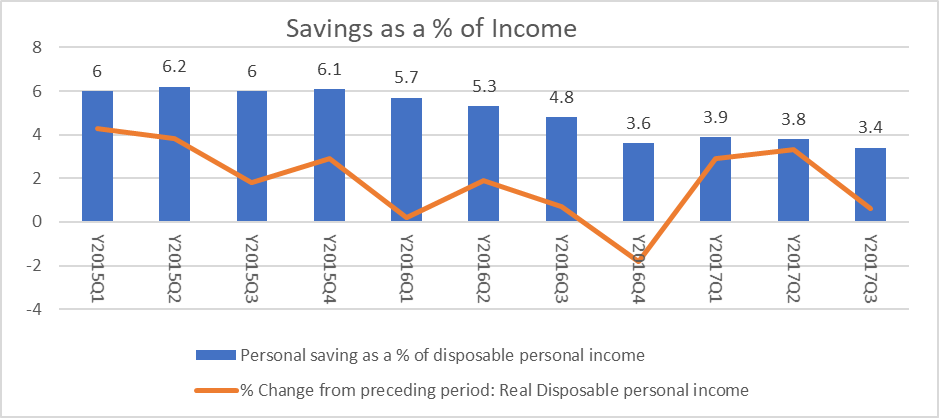
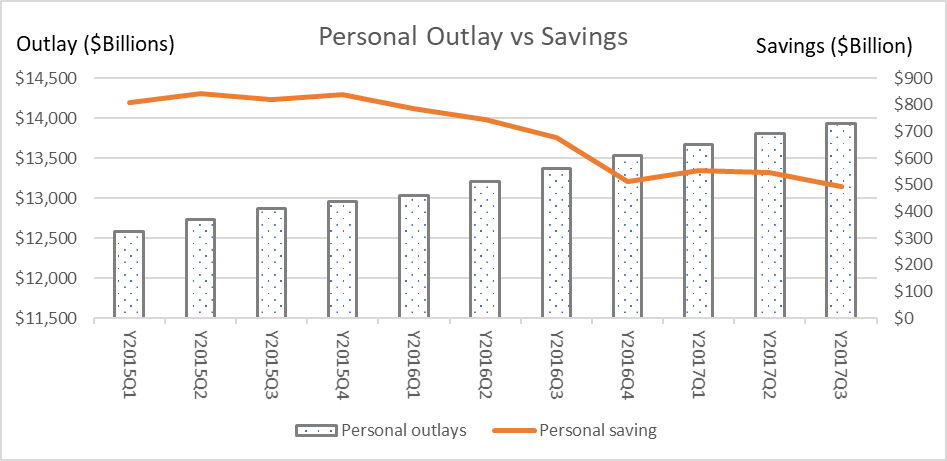 The second graph shows the amount of savings as a percentage of disposable personal income is shrinking from 6% in the first quarter of 2015 to 3.4% in the last quarter.
 Perhaps the positive spin on this is that there is increasing confidence in the economy as the labor economy continues to gain strength with more people working. This provides a sense of comfort for workers to save less and increase spending.
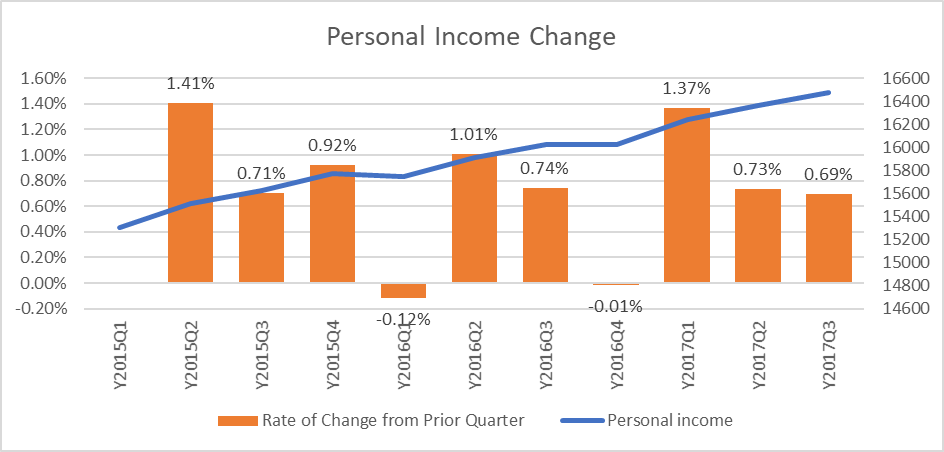
The challenge remains a lack of meaningful wage growth. The third graph shows that although personal income continues to escalate, the rate of growth from quarter to quarter on an annualized basis remains stagnant and low.
 In conclusion, although the advance estimate for the third quarter at 3% is a pleasant surprise, the underlying contributing factors may be telling a slightly different story. With consumers representing 70% of the economy, the weakening rate of spending growth and the slow depletion of savings coupled with continuing low income growth may be signs that there is a limit to this higher-than-expected GDP number. Of course, if there is meaningful tax reform (both corporate and personal) and fiscal spending, this would lead to a jolt to the economy and expect to have a higher GDP during the cyclical time-frame. But this is likely to be a 2018 story. Also we are waiting for the GDP revision in later November and the fourth quarter GDP to observe the full impact of the twin hurricanes.
[1] https://www.bea.gov/newsreleases/national/gdp/2017/pdf/gdp3q17_adv.pdf
[2] https://www.frbatlanta.org/-/media/Documents/cqer/researchcq/gdpnow/RealGDPTrackingSlides.pdf