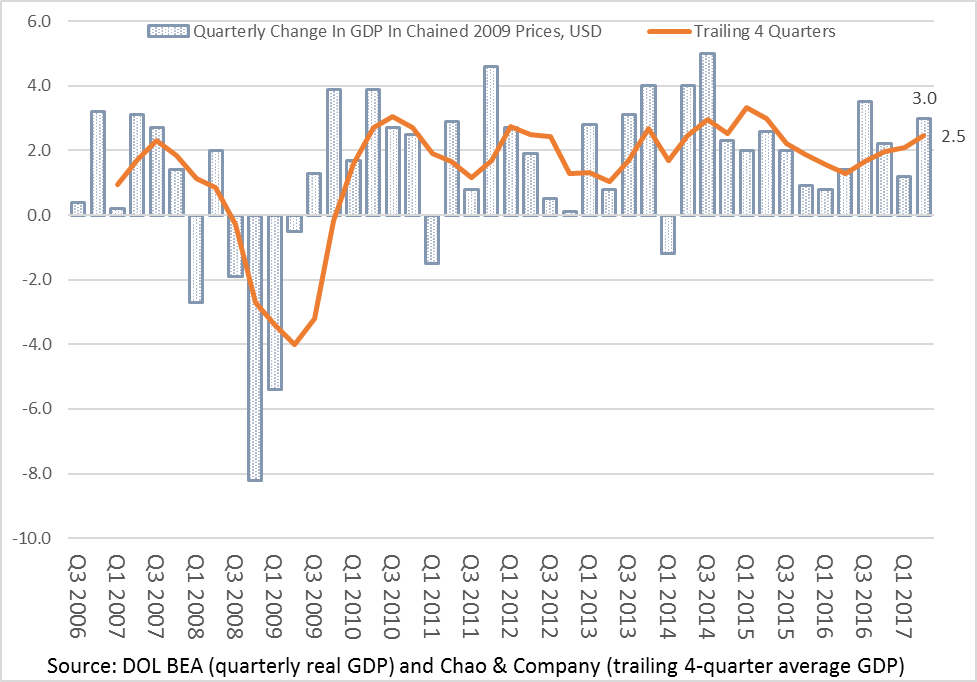
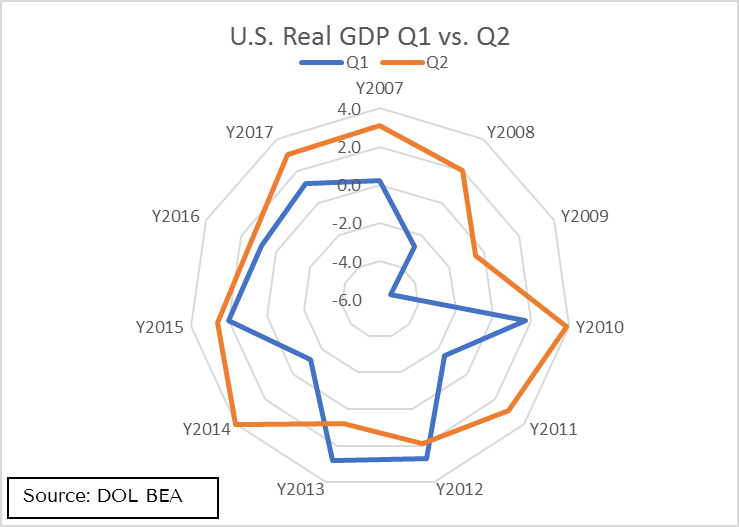
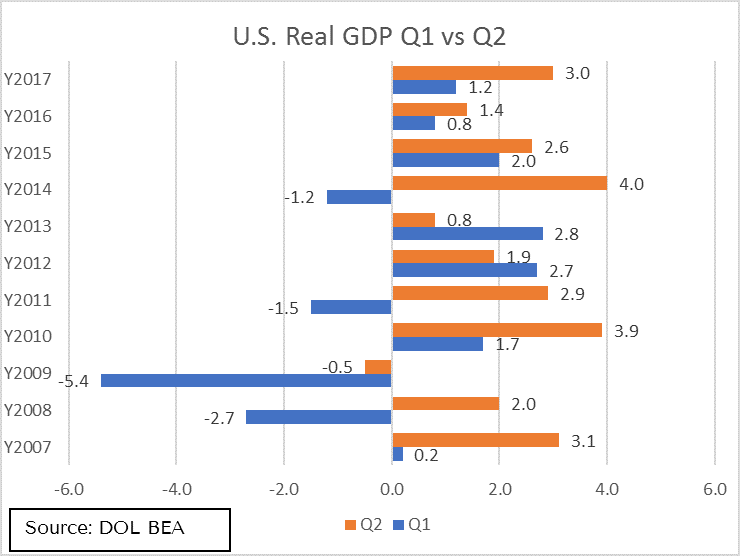
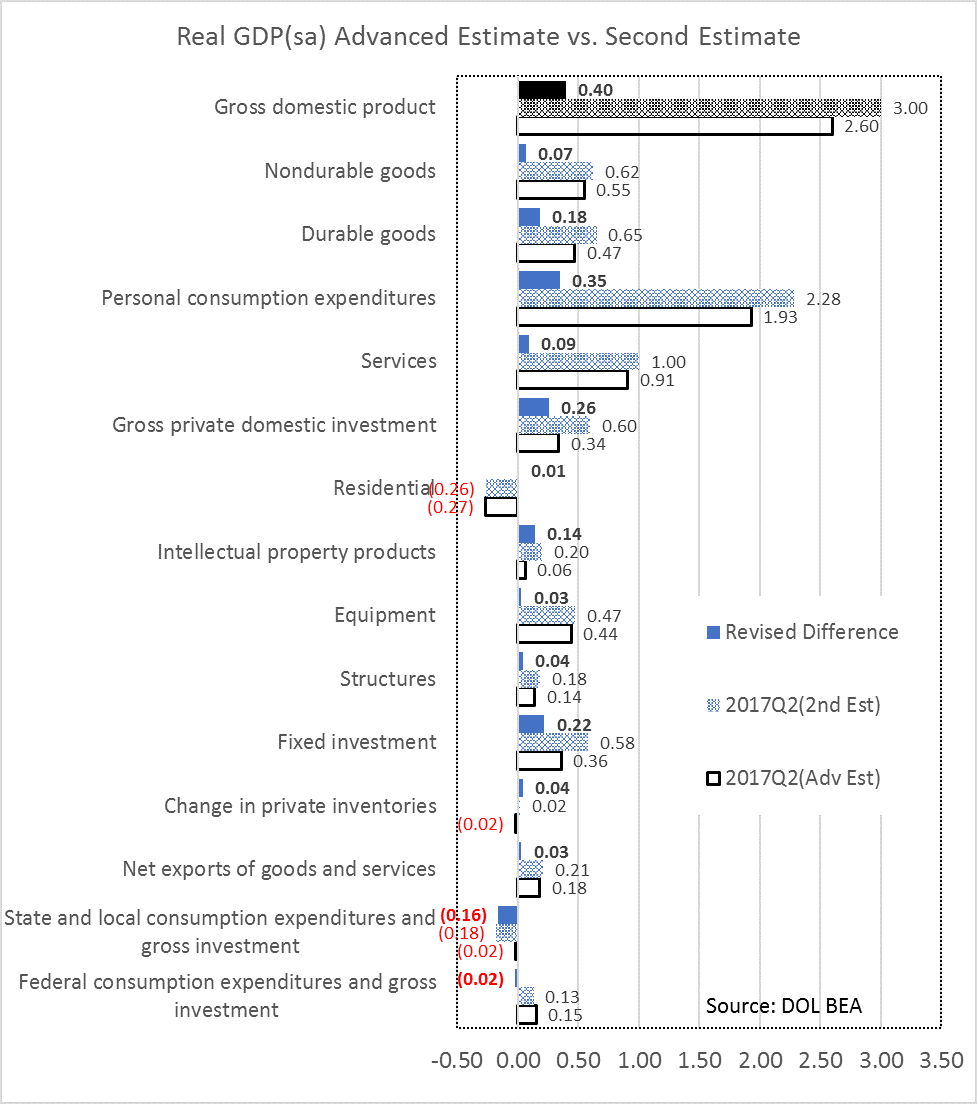
On August 30, 2017, the Bureau of Economic Analysis released the Second Estimate for the U.S. second quarter real GDP[1]. Compared to the Advance Estimate of 2.6%, it is revised up to 3.0%. For the first half of 2017, the revision pushed up the annual projected growth rate to 2.1% from 1.9%. This is the 13th consecutive positive U.S. economy growth since the first quarter 2014.
This positive revision continues to show the growing strength of U.S. consumers, as the labor economy continues to improve with more jobs and job openings and continuing growth in private capital expansion. These positive and reassuring corrections overshadow the further (revised) decrease in government spending.
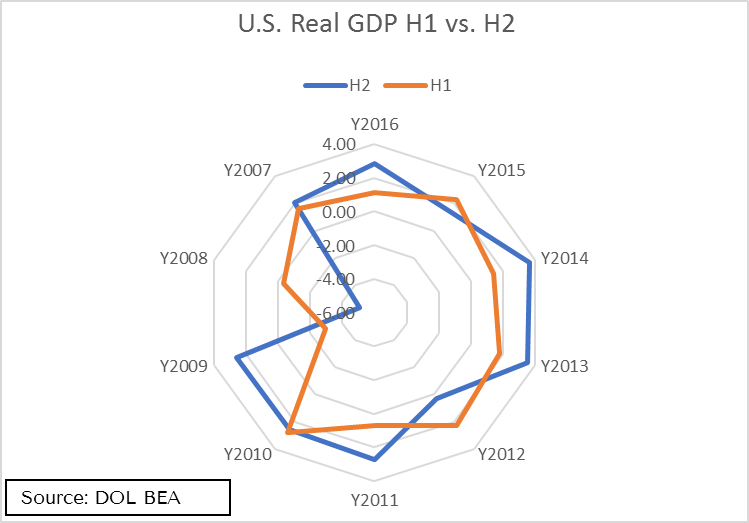
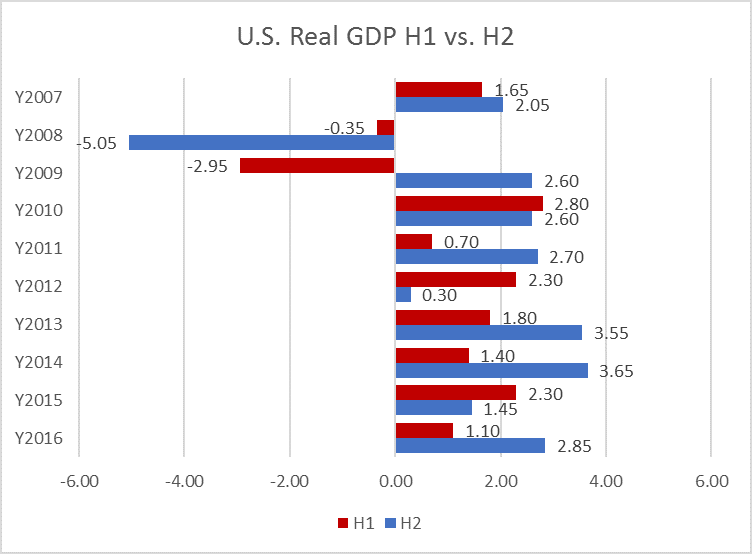
We then reviewed how first half (H1) GDP from 2007 through 2016 performed compared to the second half (H2). The data is less stable with four out of ten years where H1 were growing at a faster rate. Clearly, using historical data without economic context is an incomplete approach to predict the future, but, historical data helps to remind us to not be overconfident with any one data point.
The third and final estimate to the Q2 GDP will be released on September 28th. BEA releases three vintages of the current quarterly estimate for GDP: “Advance” estimates are released near the end of the first month following the end of the quarter and are based on source data that are incomplete or subject to further revision by the source agency; “second” and “third” estimates are released near the end of the second and third months, respectively, and are based on more detailed and more comprehensive data as they become available.
The table below shows the average revisions to the quarterly percent changes in real GDP between different estimate vintages:
| Vintage | Average Revision Without Regard to Sign (percentage points, annual rates)* |
| Advance to second | 0.5 |
| Advance to third | 0.6 |
| Second to third | 0.2 |
| Advance to latest | 1.1 |
*Source: DOL BEA, based on estimates from 1993 through 2015. For more information on GDP updates, see Revision Information on the BEA Web site.
GDP is a function of labor productivity and labor growth. On a trailing 1-year basis, labor productivity[2] is growing at 1.2% while civilian labor force is estimated to be growing at an annual rate of 0.5%[3] through 2024. If these rates hold, the economic growth would remain restrained at the real 2% to 2.5% range even with jolts of outsized growth from time to time.
In conclusion, the revised real GDP for the second quarter is a positive sign for continuing economic expansion. However, the next two quarters’ GDPs will likely show some distortions. It is too early to estimate Hurricane Harvey’s devastating economic impact on Houston and surrounding areas and the available capital, manpower and speed for rebuilding. Ranked as the 4th largest GDP metro area[4] in the U.S., the aftermath of Harvey will certainly impact forward-looking GDP.
[1] https://www.bea.gov/newsreleases/national/gdp/gdpnewsrelease.htm
[2] https://www.bls.gov/news.release/prod2.nr0.htm
[3] https://www.bls.gov/opub/mlr/2015/article/labor-force-projections-to-2024.htm
[4] https://www.aei.org/publication/understanding-americas-ridiculously-large-18t-economy-by-comparing-the-gdp-of-us-metro-areas-to-entire-countries/
