The second estimate of the 2017 Q2 real GDP was revised up from 2.6% to 3.0% last month that brought the first half of the year from 1.9% to 2.1% annualized rate. Market participants and observers are wondering if this is the beginning of the U.S. economy breaking out of the New Normal slow growth thesis. Since the Great Recession, U.S. economy growth, as represented by the real Gross Domestic Product, has been less than the old normal of between the 3% to 4% range.
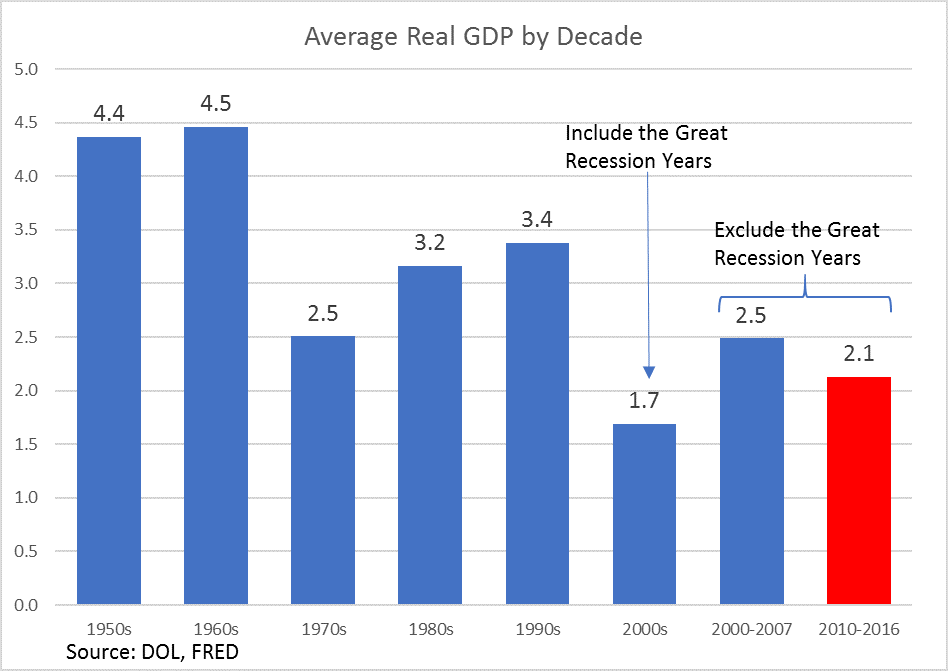
The average annual real GDP over the 5 decades since 1950 in the U.S. has been 3.6%. The average GDP in the first decade in the 21st Century was 1.7%, which includes the period of the Global Financial Crisis led Great Recession. If we remove the 2008 – 2010 period, the first 7-years in the 2000’s produced an average real GDP of 2.5%, and from 2010 through 2016, the average real GDP has been 2.1%. So, with or without the inclusion of the Great Recession, U.S. economic growth has not been inspiring since the turn of the current century.
Is the sub-normal (or New Normal) GDP here to stay? According to the CBO projections, as of June 30, 2017, the future GDP looks more like the past 6-years.
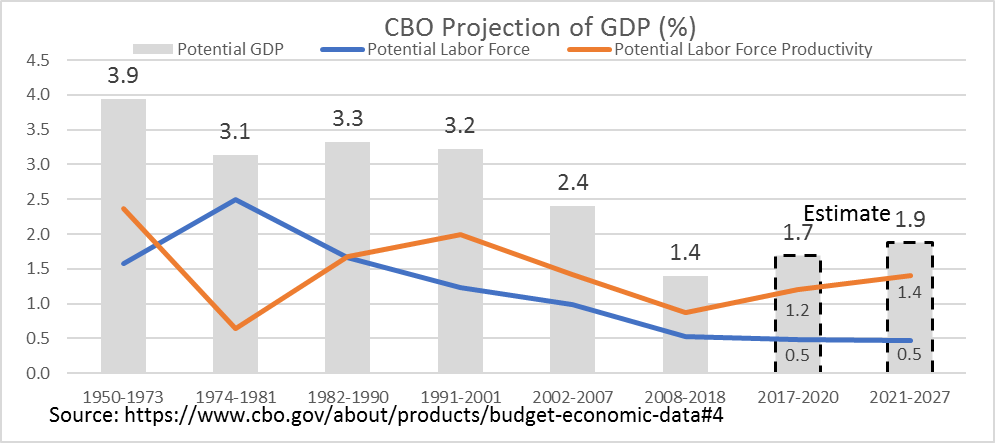 For the next 3-years ending in 2020, the GDP is expected to average annually at 1.7%, and for the following 7-years, the annual real GDP is expected to average at 1.9%. The two biggest contributors to GDP growth are productivity and labor growth. GDP growth is based on more people working and generating more output per hours of work.
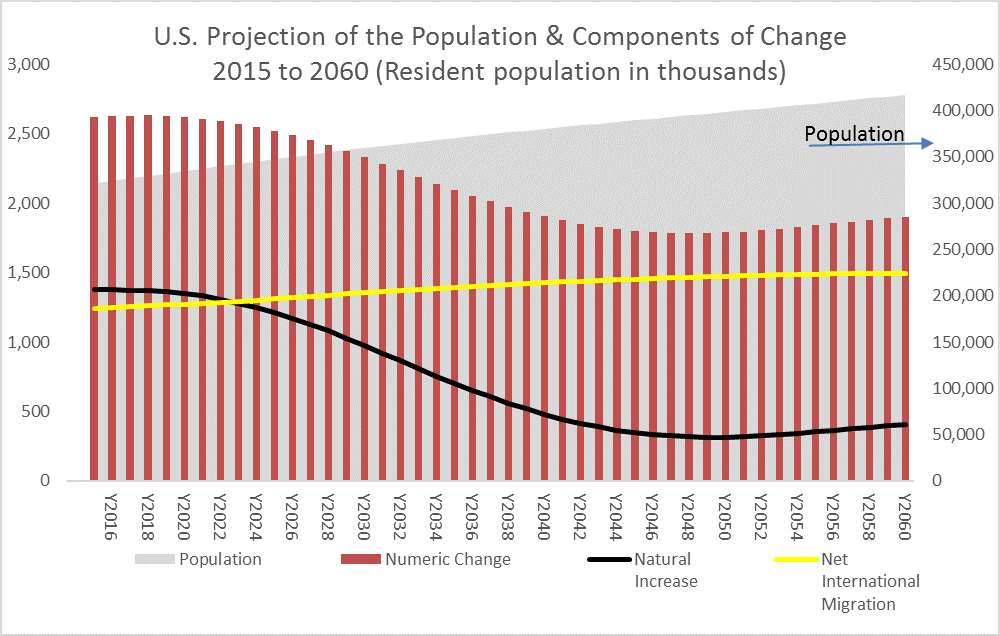 The second graph on the previous page shows the U.S. population projection from 2016 through 2060 by the U.S. Census Population Division[1]. The annual total Population increases are made up of two components: Natural Increases and Immigration. Natural Increase is the difference between births and deaths each year. It shows that Natural Increase is falling (increasing deaths through 2060) while immigration is fairly steady to rising slightly. (This projection was created prior to the Trump Administration’s America First immigration policy.).
It is well known that the demographic change is predestined with Baby Boomers marching into their retirement and beyond.
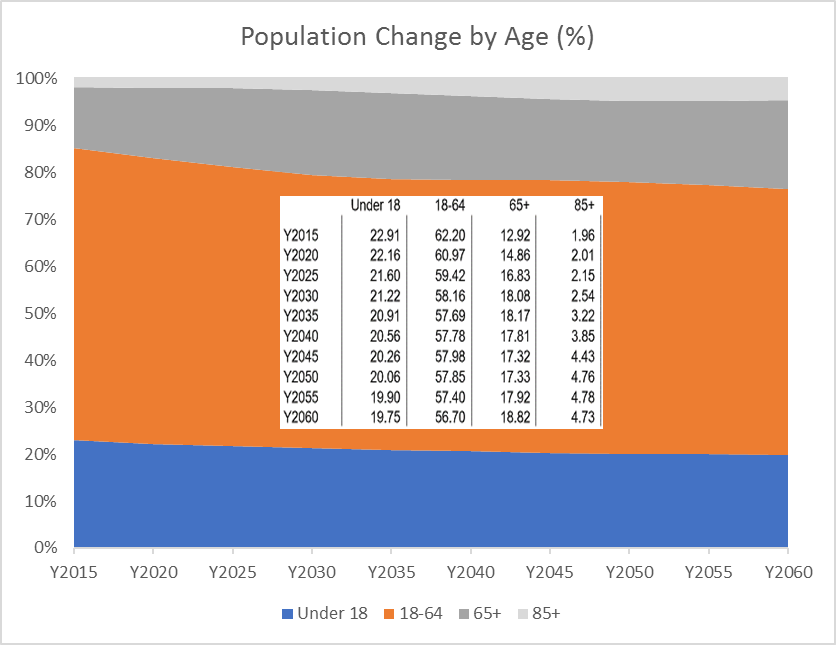
This graph (and data) from the U.S. Census shows the percentage of Americans aged 65 or more and 85 or more are the fastest growing segments of the population while under 18 and 18 to 64 groups both trend downwards over the same period. This demographic trend (less productive workers) coupled with the slowing immigration growth clearly suggests that the “Labor Growth” component of the GDP will remain a structurally small contributor for years to come.
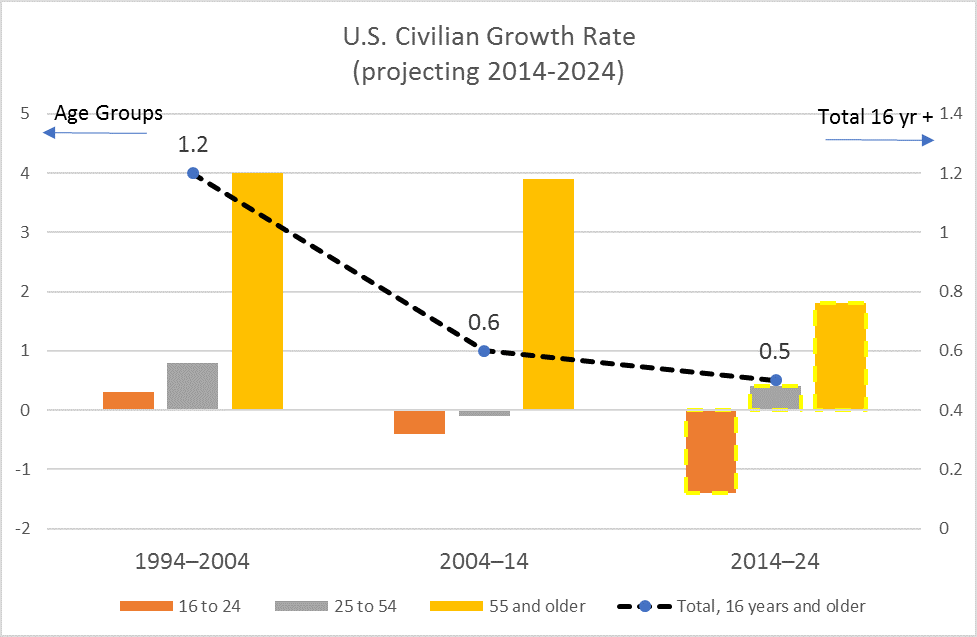
According to the DOL[2],
“The labor force is projected to grow over the next 10 years at an average annual rate of 0.5 percent, a slower rate than in recent decades. Demographic factors – including slower population growth and the aging of the U.S. population – in addition to the declining labor force participation rate will be responsible for the projected growth of the labor force. As a result of declining fertility rates and decreasing international migration, the population of the United States is growing more slowly than in previous decades and is also getting older.1 In addition, the labor force participation rate has been declining as a result of demographic, structural, and cyclical factors after having peaked from 1997 to 2000. Still, even with the decreasing participation rates of the past few years, because population is the single most important factor in determining the size and composition of the labor force, the declining growth of the labor force is more a result of the declining growth rate of the population over the years.”
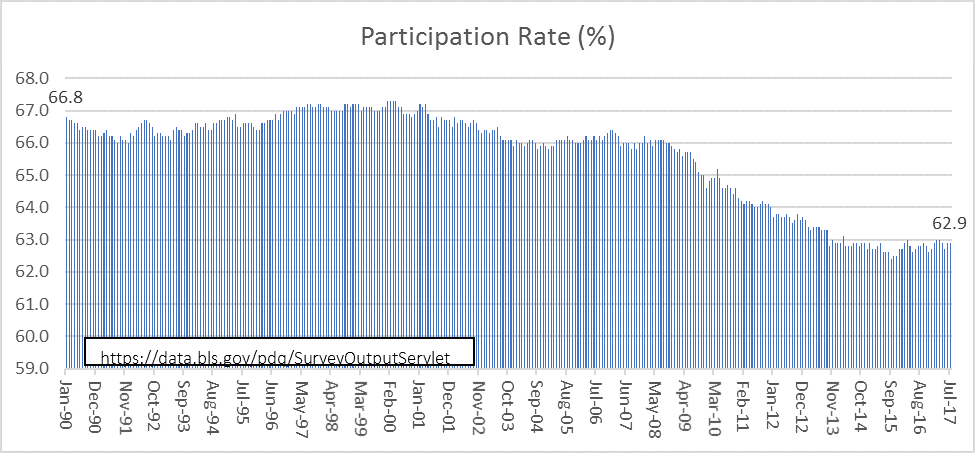
The labor participation rate has never recovered from the Great Recession, and with the evolving demographics (aging Baby Boomers), this rate is not expected to return to prior highs.
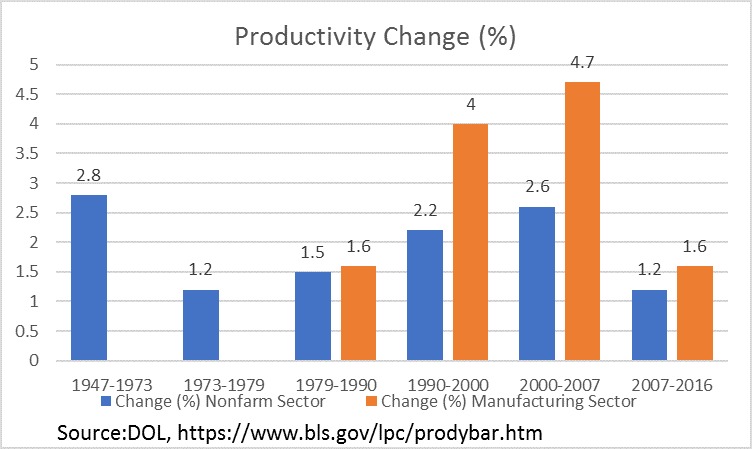
 Labor productivity is a measure of economic performance that compares output (the amount of goods and services produced) with the number of labor hours used in generating the output. It is defined mathematically as real output per labor hour, and growth occurs when output increases faster than labor hours. Labor productivity growth can be estimated from the difference in growth rates between output and hours worked. For example, if output is rising by 3% and hours are rising by 2%, then labor productivity is growing by 1%. The following graph summarizes the DOL productivity data since WWII.
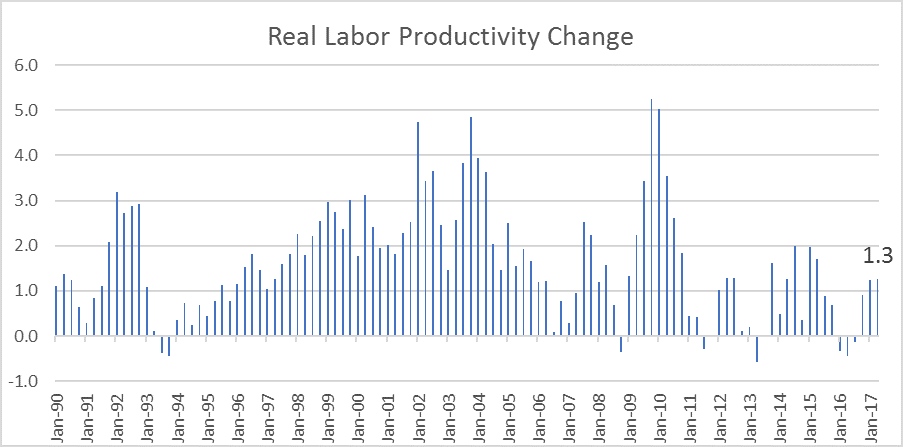
As of April 2017, DOL reports that Labor productivity increases at the rate of 1.3% year-over-year.
Labor productivity reflects the change in demographics, the economy’s continuing rotation away from manufacturing to services (globalization is a contributing factor) and the transformation to a new machine age.
In conclusion, the well-known demographic trend and the persistent low labor productivity in the aggregate will continue to hold down the real GDP growth rate. If we simply add the projected average labor growth rate of 0.5% and the estimated labor productivity rate of 1.3%, the total GDG is estimated at no more than 2% going forward. Of course, if the labor productivity growth rate is higher, this would push up the real GDP rate. As such, the estimate for future real GDP growth rate is rangebound between 2% and 2.5% on average.
This does not mean that the U.S. will not experience short (cyclical) periods of above New Normal trend growth. They could be a result of sizable government fiscal spending, tax cuts for the lower and middle income workers, and other policy induced changes or injection of capital, but none of these actions would change the cause of the structural demographic dynamics nor create the next technological innovation that would radically change the course of productivity. In the long run, a lower GDP growth rate would erode the U.S. standard of living while exacerbating the effects of growing income and wealth disparity.
[1] https://www.census.gov/data/tables/2014/demo/popproj/2014-summary-tables.html
[2] https://www.bls.gov/opub/mlr/2015/article/labor-force-projections-to-2024.htm