The Federal Open Market Committee (FOMC) June 15th press release stated that the labor market has slowed even though the unemployment rate declined further. Also, economic growth has picked up along with the housing sector and consumer spending while business fixed investment is soft and inflation remains muted. Since the FOMC does not operate in a vacuum, the Committee continues to closely monitor global economic and financial developments. The bottom line is to take no rate increase action this meeting. More importantly, the press release stated that “[t]he Committee expects that economic conditions will evolve in a manner that will warrant only gradual increases in the federal funds rate; the federal funds rate is likely to remain, for some time, below levels that are expected to prevail in the longer run.”
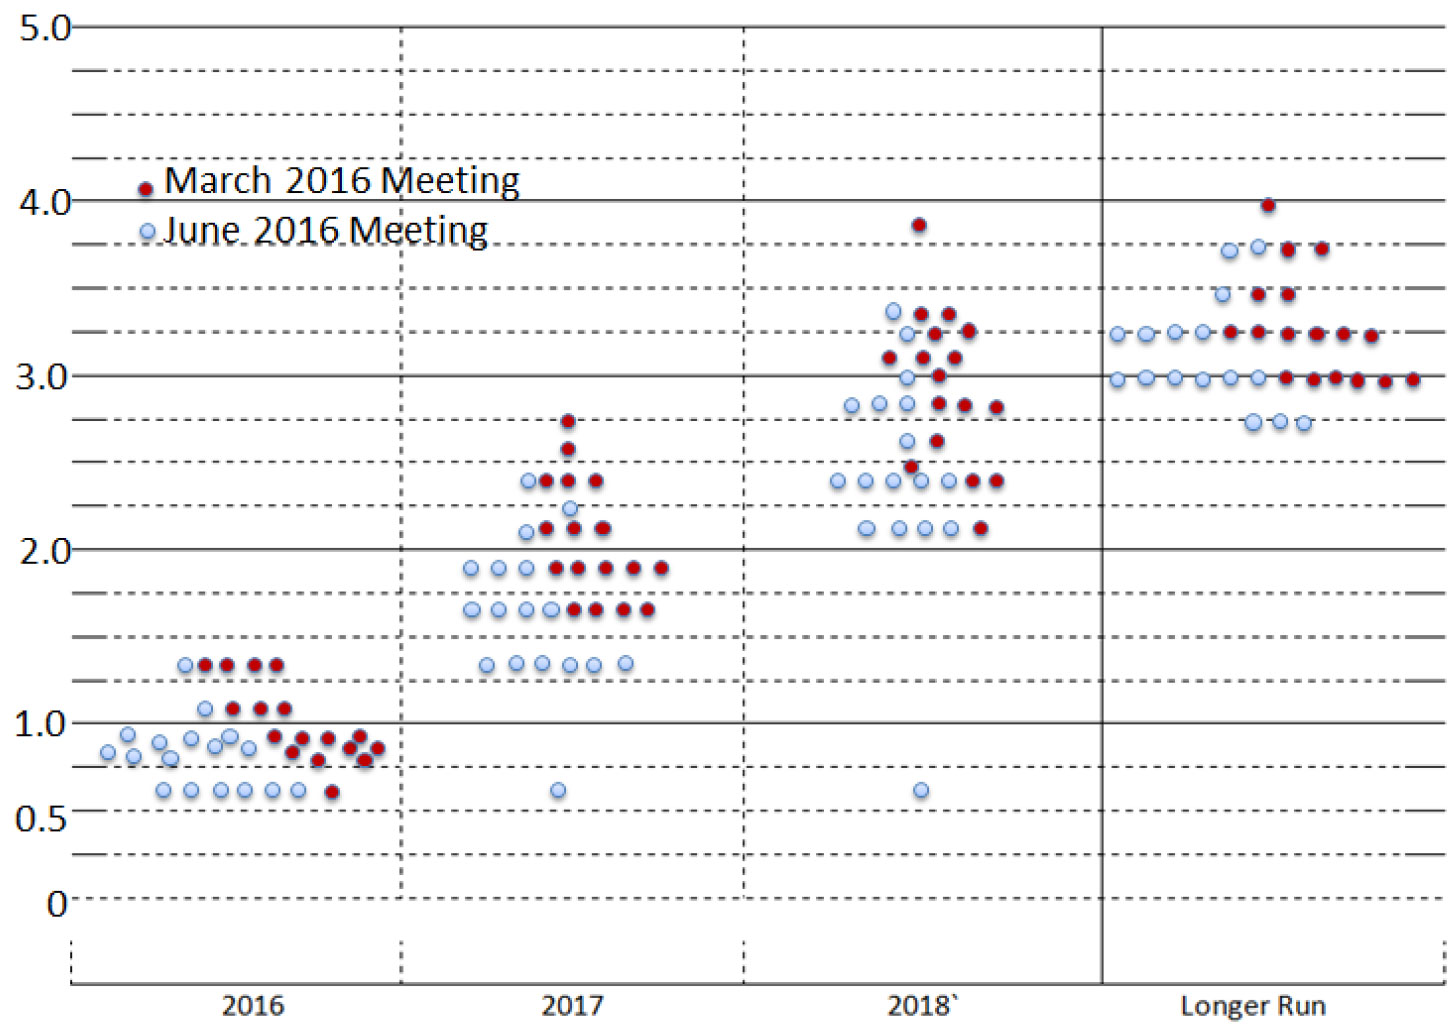
On the surface, the FOMC’s position has not deviated too much from recent meetings. The FOMC’s path for the federal funds rate will continue to depend on the economic outlook as informed by incoming data and that each meeting is a “live” meeting for rate increase. However, the economic projections that accompanied the press release tell a different story. These projections represent each FOMC member’s individual assessments regarding real GDP, U3 unemployment rate, core PCE inflation and the expected interest rate policy path (i.e. the dot plot) from 2016 forward. The following dot chart plots the value of each individual FOMC participant’s judgment of the midpoint of the appropriate target range for the federal funds rate or the appropriate target level for the federal funds rate at the end of the specified calendar year or over the longer run. The red dots represent member projections during the March 16, 2016, meeting, and the blue dots represent their projections during the June 15, 2016, meeting.
This clearly shows that the participants have lowered their sights for 2016, and the path to 2018 and beyond has also been lowered (blue dots are generally lower and concentrated in the lower ranges.) Attention should not only be paid to the median projected rate but also the range of the projections. This helps to inform us of the breadth of the projections. In the transcript to Chair Yellen’s June 15th press conference, she stated that “the economic outlook is inherently uncertain, so each participant’s assessment of appropriate policy, is also necessarily uncertain, especially at longer time horizons, and will change ibn response to changes to the economic outlook and associated risks.” The members are involved in a process of constantly reevaluating where is the neutral rate going and what is evident is a downward shift in that assessment overtime. Further, the FOMC is quite uncertain about where rates are heading in the longer term.
She also cited that “vulnerabilities in the global economy remain and in the current sluggish global growth, low inflation and very accommodative monetary policy environment, investor perceptions of, and appetite for, risk can change abruptly.” In her response to reporters’ questions, she stated that the outcome of Brexit is one of the factors that was factored into the FOMC’s rate decision. At the end, FOMC’s decision is data dependent. Every meeting is a live meeting, so rates are not set on a pre-specified course.
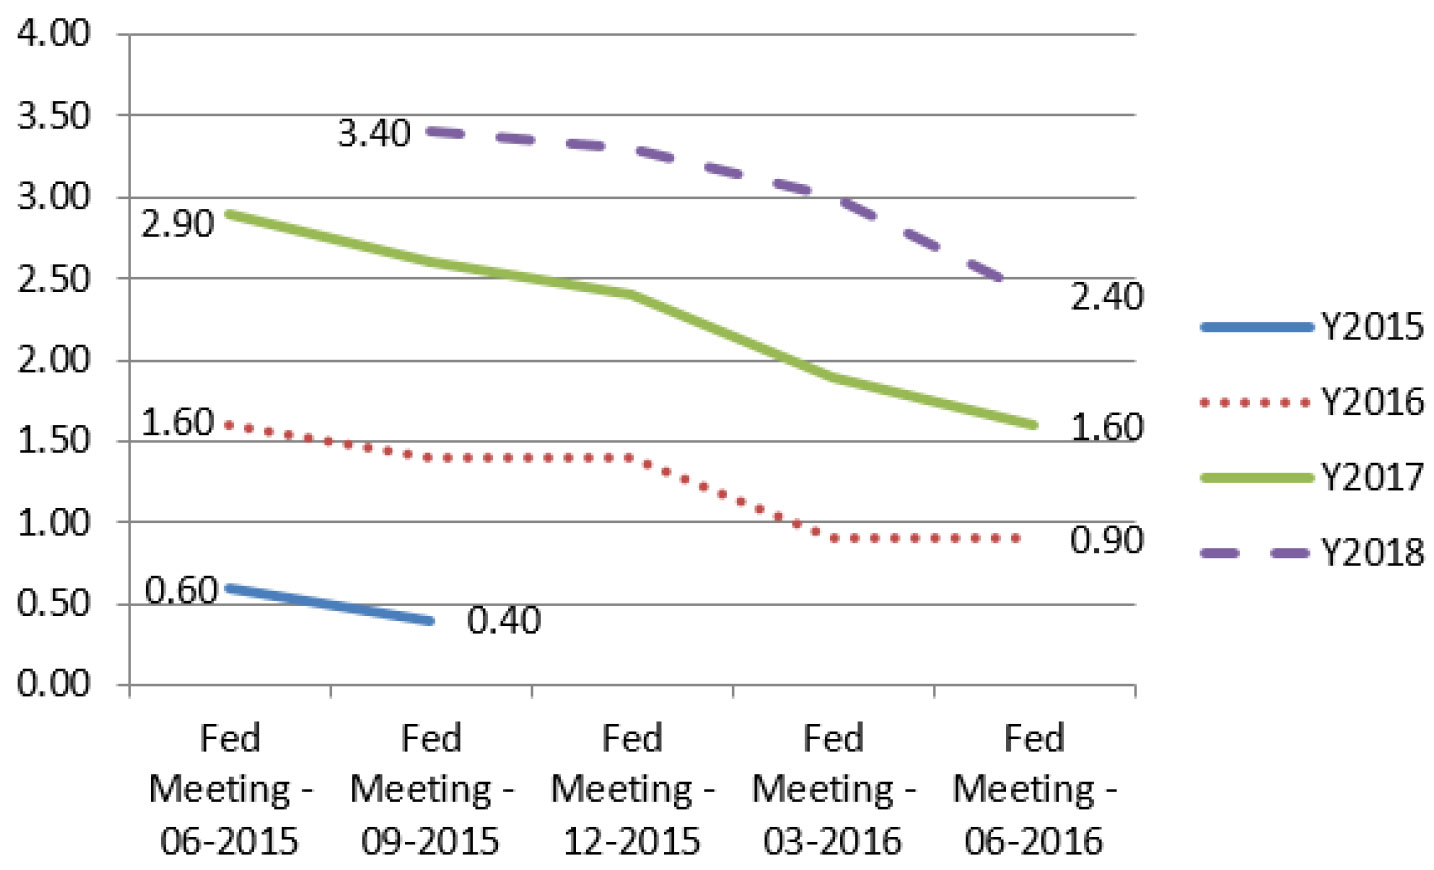
The FOMC has consistently been revising their expected neutral rate and annual rate lower. The following diagram plots the projected year end interest rates during the past 6 FOMC meetings where projections are published. For example, in the September 2015 meeting, the FOMC projected the rate would be 3.4% at the end of 2018, and this projection is now lowered to 2.4% during the June 2016 meeting.
For a long time now, the market has been projecting a lower-to-a-much-lower interest rate environment as compared to FOMC’s projections. This gap has been viewed as a constant risk. However, so far the market has been right about rates and FOMC has continued to adjust downwards its interest rate projections. FOMC’s dual mission is “to foster maximum employment and price stability.”
This means that the FOMC makes interest rate decisions that would strike a balance between full employment (however that is defined and measured) and a stable level of inflation. In a simple binary world when employment reaches and passes the full employment point, wages would rise and spur spending that would lead to increased inflation or potential price instability. The opposite is also true that increasing interest rates to slow down inflation could slow down the economy and ultimately bring an end to the economic cycle. It is understandable that the FOMC is interested in measuring the temperature of the domestic economy.
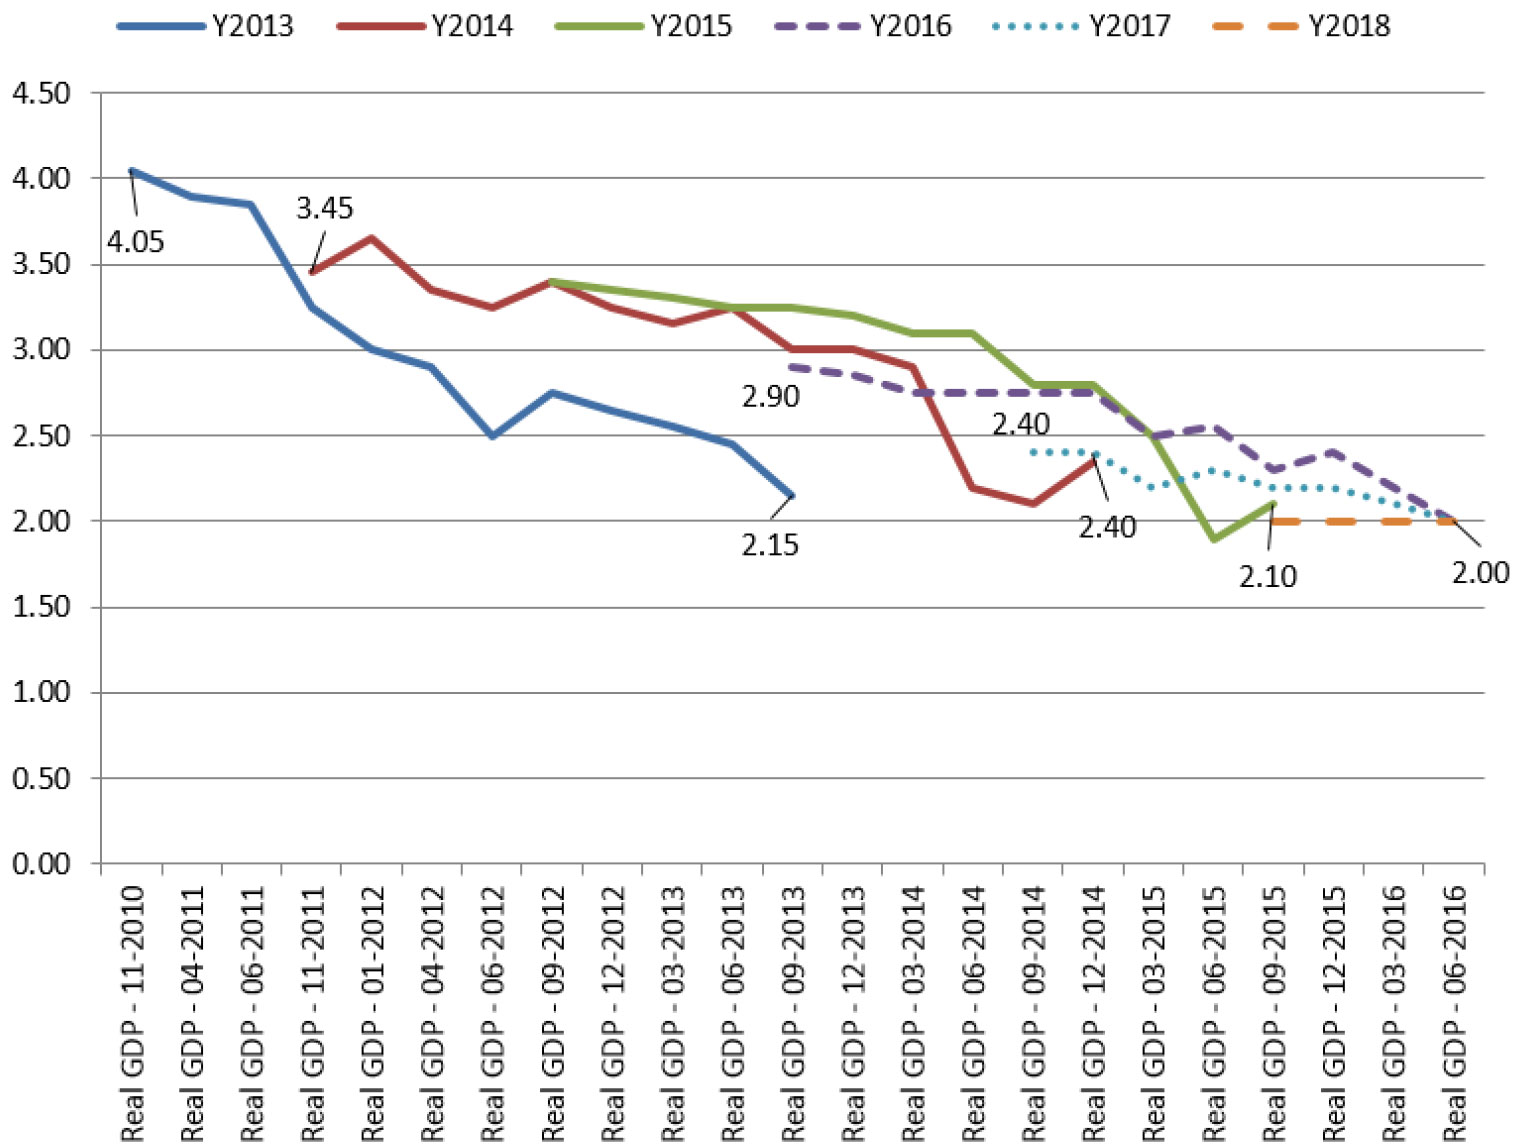
This graph plots the FOMC meeting projections since November 2010 through June 2016. It is clear that during the past 6-years the FOMC has been overestimating the strength of the U.S. economy and expecting a “normal” real GDP. Over time, the projections have to be revised downward. The projections for 2016 through 2018 now have been revised to 2.00% for real GDP in the U.S. This downward projection is one of the basis for FOMC’s inaction. In the real world, the U.S. GDP for the first quarter – increased at an annual rate of 1.1% in the first quarter of 2016, according to the “third” estimate released by the Bureau of Economic Analysis. This was an upward revision from 0.8% in the second estimate and the advance estimate of 0.5%. However, 1.1% remains weak. The GDPNow3 model from the Atlanta Federal Reserve Bank forecasts for real GDP growth (seasonally adjusted annual rate) in the second quarter of 2016 is 2.4% on July 6. If this holds true, the U.S. economy would be growing at an annual real rate of 1.75% during the first half. In order for the U.S. economy to grow above 2% for the year, the second half must have an average annualized real growth rate of over 2.25%.
Now that Brexit is a reality, a rate hike in the upcoming FOMC meeting on July 26-27 is unlikely. Market volatility typically tightens financial conditions and contributes to market uncertainty. This is not the time to raise interest rates. In the meantime, the 10-year U.S. Treasury note is yielding at 1.38% on July 6th. The spread between the U.S. 2- and 10-year (at 0.80%) and the 10- and 30-year (at 0.76%) treasuries continues to compress and further flatten the Treasury yield curve. Since the beginning of this year, the 10-year note yield has dropped from 2.24% to 1.46%.
The 2-10 spread and the 10-30 spread of the U.S. treasury yield curve shows the vanishing of term premium. Of course the low yield on developed sovereign bonds is not confined to the U.S. In fact, the U.S. 10-year yield is head and shoulders above other developed economies. This relative attractiveness in yield is also helping to drive the U.S. interest yield curve flatter as more foreign investors find the U.S. yields more attractive.
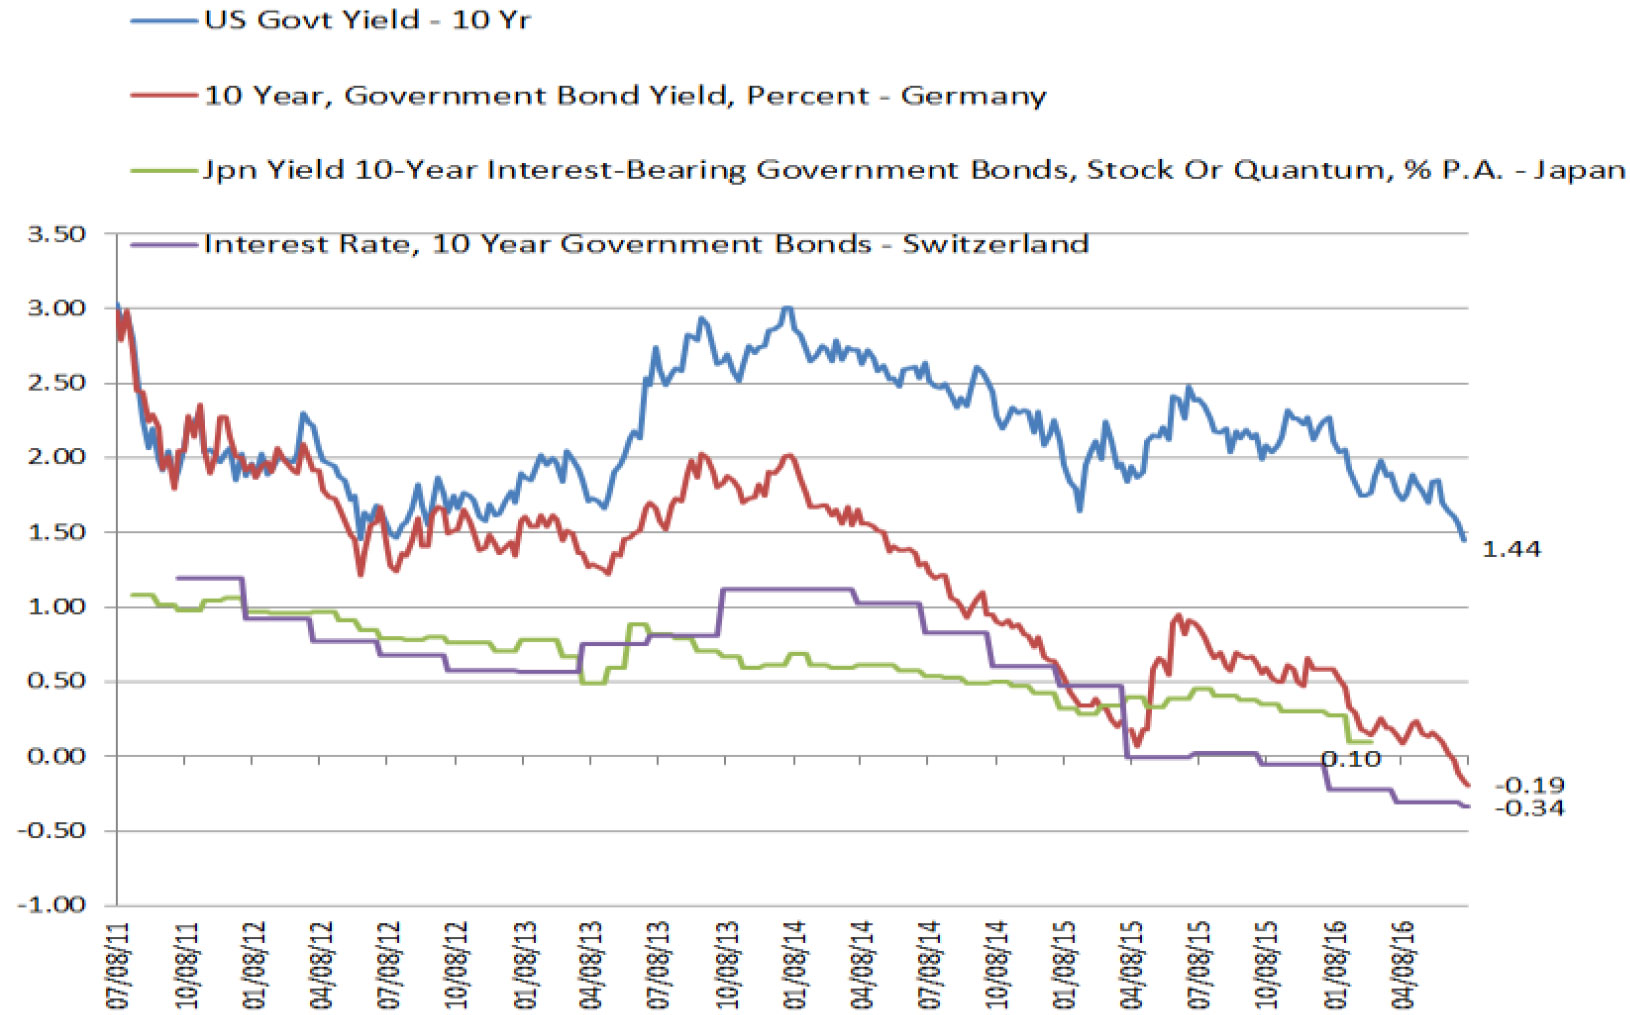
The global flight to safe haven currencies is placing significant downward pressure on the reserve currencies (US, Japan, Switzerland and Europe) and their sovereign bonds. This places a strain on the Federal Reserve’s ability to have influence over the yield curve as well as its ability to raise short-term interest rates. The Federal Reserve’s interest rate decisions have global implications, and at the same time, events globally limit the Federal Reserve’s degree of freedom to act in its country’s best interest. This globally linked monetary-financial system is making a diverging policy action that much more challenging. The movement of the 10-year government bond yields of the US, Germany, Japan and Switzerland continue to trend lower. If the current trajectory continues, the U.S. is more likely to push towards 1% rather than 2%.
This commentary is an excerpt to Chao & Company’s quarterly commentary for 2016Q2 and represents the current views of Chao & Company, which are subject to change. This Firm has no obligation or responsibility to update our views. The comments and views should not be deemed as Philip Chao, or any member of this Firm, offering personal or personalized investment advice. The document is informational only and is insufficient to be relied upon to make any financial or investment decisions or to make any changes to your financial condition.


