Summary
- Federal Reserve lifts off from ZIRP in its December 2015 meeting. This is the first interest rate increase in 9 years. The focus now is the pace of and its ability for future rate increases and the medium term rate destination (neutral or terminal rate). No action is expected for the January meeting.
- The FOMC is likely to only raise rates twice this year due to slowing economic conditions and the lack of inflation. Broadly, the Fed is looking at economic data that would support a domestic GDP growing at 2.4% or better, a broad unemployment U3 rate of no more than 4.7% and a core inflation PCE target of no less than 1.6% in 2016. This sounds reasonable.
- For 2016, we expect “lower for longer” for:
- Fed Fund rate (sub 1%),
- inflation rate (sub 1.6% core),
- real economic growth rate in the U.S. (sub 2.1%) and
- global real growth rate (sub 3.2%)
- oil and gas, and to a lesser extent mining, materials and commodity prices.
- With slowing world economies, global trade continues to fall which maintains pressure on commodity producers and exporting countries and their currencies. If sustained, it will have social, economic, and political ramifications.
- The Chinese currency discussion framework is distorted in the media. The Chinese RMB is devaluing against the USD but not for the popular speculation: a decision to drive export growth, to revive its economy, or to raise inflation. These are more consequential effects. The natural path for China to internationalize its currency is to de-peg itself from the USD and, over time, allow market forces to bring stability to its currency as China relaxes its control. This pivot from USD to an alignment with a basket of trade weighted currencies (the new RMB Index) is necessary and appropriate, albeit disruptive and painful in the near term to balance short term market response with long term sovereign objectives. If devaluation is the goal, the magnitude of the fall would have been much greater.
- Slowing global growth places demand pressure on all commodities prices and exporters. When the developed economies are faced with low growth prospects and disinflation, a contraction in trade with emerging markets is expected. This creates a feedback loop of more pressure on the emerging market countries and further contributes to lower growth. This is not just about the global equity or financial markets; when sustained, there will be social and political consequences.
Happy New Year … or Not
The usual or normal Holiday rally, the January Effect (where smaller companies excel), and the traditional positive market action as a follow through from December failed to materialize. In fact, this January would be considered one of the worst months for risk asset performances in recent memory, but the real economy should not be judged by the stock market performance or the 24-hour news cycle.

Beginning of a New Interest Rate Regime
On December 16, 2015, the Federal Reserve (“Fed”) policy making body, the Federal Open Market Committee (“FOMC”), voted to raise the target range for the federal funds rate from 0.0025% to 0.0050%, or a 25 basis point increase. Future increases will continue to be data dependent and not on a set schedule and with “gradual adjustments”. This is the first step in the Fed’s rate normalization process. Further, there is no change to its current policy of reinvesting principal payments back into agency mortgage-backed securities while rolling over maturing Treasury securities at auction (a remnant of its Large Scale Asset Purchase program known as quantitative easing). The Fed expects to continue this reinvestment scheme until the federal funds rate normalization is well under way. The stance of monetary policy shall remain “accommodative” after this increase.
In support of this lift off decision, the Fed, in its minutes, cited the following positive intra-meeting factors:
- Real GDP increasing at a moderate pace
- Labor market improved further as evidenced by the 5% unemployment rate and the continuing improvement in labor participation
- Some evidence of wage increases with compensation per hour in the business sector advancing at a strong 3½ percent rate
- Personal consumption expenditure appears to be rising at a solid pace with a strong growth in real disposable income in September and October
- Households’ net worth bolstered by recent gains in home values
While other factors remain challenging:
- Consumer price inflation continued to run below the FOMC’s longer-run objective of 2%, restrained in part by declines in both energy and non-energy imported goods prices.
- Information on crude oil and natural gas extraction through early December indicated further declines in mining output which negatively impacts manufacturing production.
- Exports declined, on balance, to the lowest level in three years. The declines in real net exports would likely continue to be a drag on real GDP growth in the fourth quarter.
Reading Tea Leaves on Rates – Lower for Longer
Four times per year (i.e. every other FOMC meeting), the FOMC releases the Summary of Economic Projections as a part of the FOMC minutes. These projections offer a detailed understanding regarding the FOMC member projections for real economic growth (inflation adjusted GDP), employment (U3 rate) and core inflation (personal consumption expenditure excluding food and energy). For the first time, the FOMC is releasing the “central tendency” of the upper and lower ranges of the FOMC member projections and the median value for projections. The following graph compares data[1] from 2015 December against the 2014 December release. The prior meetings in September 2014 and 2015 are also included to demonstrate the direction of the members’ updated projections.

FOMC member projections show the U.S. economic growth rates continue to adjust downward from 2014 to 2015. It is interesting to note that the December FOMC projection for real GDP increased to 2.4% from 2.3% in September while the Atlanta Fed is projecting the first quarter GDP to be below 1%[2]. Projection for unemployment rates continues to come down as well, even though there is no certainty as to where the exact non-accelerating inflation rate of unemployment (NAIRU[3]) is. The lack of evidence in wage inflation tends to suggest NAIRU is not the current 5% unemployment rate. FOMC projections suggest the long term rate bottoms at 4.9%, down from 5.35% a year ago. Inflation has stubbornly come down projection after projection. According to the December 17, 2014, FOMC Press Release[4]: “the Committee expects inflation to rise gradually toward 2 percent as the labor market improves further and the transitory effects of lower energy prices and other factors dissipate.” One year hence, the December 16, 2015, FOMC Press Release[5] states: “inflation has continued to run below the Committee’s 2 percent longer-run objective, partly reflecting declines in energy prices and in prices of non-energy imports. Market-based measures of inflation compensation remain low; some survey-based measures of longer-term inflation expectations have edged down.” But, the FOMC remains “reasonably confident that inflation will rise, over the medium term, to its 2 percent objective.”
Data Dependent
The Fed has provided a set of parameters in guiding future rate increases. The first is the famous “dot plots” which discloses the projection or estimation of where short term rates would be in 2016 as compared to 2015.

After the 0.25% increase in December, the dot plots suggest a further increase range of 0.625% to 1.875% in 2016 with the median projection at 1.4%. Assuming 1.4% is the 2016 increase, there would be 4 more rate increases this year. The market has been pricing in a 0.5% increase by the end of 2016. The above table shows the highest probability for market expectation is 2 rate increases this year.
State of the U.S. Economy
Unemployment
The graph below summarizes the progress made since the Great Recession. Today with U3 at 5% from the October 2009 high of 10% and a continuing improvement in U6 at 9.8% from the January 2010 high of 18%, the American labor situation has greatly returned to “normal” on the surface. Initial unemployment claims have more than halved from the high of 665,000 in March 27, 2009 to 284,000 on January 8, 2016. However, the labor participation rate continues to be at historical lows at 62.6%.

The graph below illustrates the other side of the U.S. labor market. Using the latest published data from BLS[6], the labor market participation rate over the past 20 years from 1994 through 2014 is analyzed. The table shows that the labor market has increased in size by over 51 million while the overall labor participation rate has declined by 3.7%.

The most often cited reason for the drop in participation rate is the 10,000 Baby Boomers retiring and leaving the work force monthly. This may be a contributing factor but it does not explain the deteriorating participation rates in other age groups. The 25 to 54 age group (the most productive among all age groups) participation has dropped by 2.5% while the participation rate for 55 and older (including those Baby Boomers 65 and older) has increased. This is a troubling sign.

This can partially be explained by structural changes in the economy, a mismatch of skills, or a change in work habits or life style where part time status is a choice. Nonetheless, there remains slack in the labor force. Thus the 5% U3 rate should not be NAIRU. Naturally wage inflation has also been muted even though there are limited pockets of wage pressure. The civilian work force wages have barely kept up with inflation (as measured by the core CPE) since 2005 4th quarter. This is a reflection of employers being in the driver’s seat since the Great Recession while cutting costs. We will be at NAIRU when most employers are not able to match open positions with skilled labor, wages should rise. In meeting its mandate, the Fed will continue to examine and push for improving employment even though most of the employment gain is behind us. For an extended recovering labor market, this is expected.
Real Gross Domestic Product
The December 22, 2015, Commerce Department report stated that the “third” estimate of real GDP increased at an annual rate of 2.0% in the third quarter of 2015 from a 2.1% “second” estimate. In the second quarter, real GDP increased 3.9%. According to the report, the third quarter positive contributors were personal consumption expenditures (PCE), nonresidential fixed investment, state and local government spending, residential fixed investment, and exports that were partly offset by a negative contribution from private inventory investment. The deceleration from the second quarter reflected downturn in private inventory investment and decelerations in exports, in PCE, in nonresidential fixed investment, and in state and local government spending that was partly offset by a deceleration in imports. This sounds pretty broad.

For 2015 (excluding the yet to be released 4th quarter data), the first three quarters are growing at an average real rate of 2.17%. According to the Atlanta Fed GDPNow[7] forecast, the 4th quarter GDP is expected to be around 0.6%. We expect a final revised number of no more than 1.5%. Even assuming the Blue Chip consensus view of 1.9%, 2015 real GDP would come in at 2.1%.

According to the Institute for Supply Management (ISM), the Purchasing Managers’ Index (PMI) for U.S. manufacturing[8] has dipped below the 50% level in November and December. PMI below 50% signals contraction. Although the ISM PMI for non-manufacturing[9] or service sector remains healthy and is at 55.3 for December, it has dropped from its July 2015 high at 60.3. The contraction in manufacturing can primarily be attributed to the significant slowdown in the mining and oil/gas sectors and the slowdown in exports due to a strong dollar. These factors are deemed to be “transitory” by the Fed. But “transitory” could be a lot longer than the dictionary definition of “lasting only a short time; brief; short-lived; or temporary”. With the Fed’s diverging policy, the slowdown in economic activities globally, and the continuing over supply in oil around the world, the manufacturing sector could continue to be a detractor to growth in the U.S. For 2016, the base case for real GDP should be closer to 2%.
Overall, consumer is expected to continue to carry the economy forward. This is not surprising as the economic expansion is bringing more people back to work and the sustained low oil prices are translating to more change in the consumer’s pockets. The continuing low mortgage rates are keeping housing more affordable. University of Michigan consumer surveys shows continuing improvement in consumer sentiment and expectation[10]. However, CEO confidence has deteriorated and financial condition has tightened. The main drivers here are global uncertainty, dollar strength and energy.
Although there are speculations or even pronouncements of a recession on the horizon, the base case for the U.S. economy remains in moderate growth and expansion. Of course, if inflation spikes, the Fed speeds up the pace of rate increase, or exogenous shocks occur, then we have little cushion to weather the impact. The Fed took extraordinary actions to truncate the U.S., if not the world, economic free fall into a depression. Since then, this recovery has not been the traditional V shape; rather it is an L shaped recovery. This is a part of the New Normal reality, and with low growth, we cannot really feel the difference on the margin if we are growing or contacting. Even when we are in a recession it is expected to be shallow and quick.
Inflation
Re-inflating the economy is most challenging for the Fed. Long term inflation anchor is much more based on consumer sentiment and expectation than from short term monetary policies. Press Releases from FOMC meetings often state that the “Committee expects inflation to rise gradually toward 2 percent over the medium term”. This is more of a hope than certainty. Even if the FOMC believes that the long term inflation rate is now lower to much lower than 2%, FOMC must maintain the 2% target in an effort to manage consumer sentiment.
The graph below from the Federal Reserve Bank of St. Louis[11] shows the 10-Year breakeven rate which implies what market participants expect inflation[12] to be 10 years from now. It measures the 10-Year Treasury Constant Maturity Securities against the 10-Year Treasury Inflation-Indexed Constant Maturity Securities, and the difference is the expected future inflation.

As of January 14, 2016, it stands at 1.43%, well below the 2% FOMC target and with a downward trend. The CPI and PCE are pointing in the same direction as well. The Fed relies on the core data in informing them on inflation; this removes the food and energy components which are volatile. However, with the strength of the U.S. dollar, slowing of the U.S. economy and a lack of wage inflation, the 2% target is not likely to be achieved in the target term unless there is a meaningful reversal in commodity prices.
For December, the CPI[13] came in at a negative 0.1% from the prior month, which was reported at 0%. For the unadjusted 2015 year, the CPI was 0.7%. The double digit drop in energy and commodity prices overshadowed the inflation registered in the service sector of the economy. It is understandable that both PCE and CPI are trending lower due to these transitory issues and the strength of the USD, but there are now signs that core PCE is also trending downwards.
The Path Forward for Rates
The December 2015 Projections Materials made available by the FOMC provide indications of the parameters FOMC members would use to determine the pace of future rate increases. The following table and graph summarize the stated FOMC member expectations which in turn provide us with quantitative benchmarks in guiding future rate increases.
Generally there are three dials: Real GDP, U3 and Core PCE. The low and high values provide us with a target range for each factor. For example, the median for real GDP this year is 2.4% with a range from 2.3% to 2.5%. If the GDP tracks or comes in at 2%, the FOMC will less likely raise rates. The same approach applies to the remaining two factors. Based on our analysis, the base case is that the FOMC will only raise interest rates on two occasions (instead of 4 as so implied by the FOMC). This 2016 base case assumes the Real GDP to be closer to 2%, core PCE to be closer to 1.5% and U3 to be closer to 4.9%. This base case assumes oil prices remain low, U.S. dollar remains strong (at least not weakened) against a basket of trade weighted currencies, international instability (political and market) remains heightened, and China will muddle through without a hard landing.

It’s All about China?!
To change from a command and control industrial based economy to a freewheeling capitalist services and consumer based society does not happen smoothly and easily. This is like domesticating an Asian Tiger. Furthermore, China’s 10-year plan is unprecedented and will not be unidirectional. This is all being engineered in real time and in a world economy that is still recovering from the Great Recession – adding risks and uncertainty to the grand experiment. Dr. Stephen Roach, then Chairman of Morgan Stanley Asia, warned in October 2009[14] that China’s growth was too dependent on exports and supply and not enough demand. He warned that the then economic growth rate at 8.9% during the third quarter was not sustainable at a time of global recession. Then the economy hit a nearly 12% rate in the first quarter in 2010 and continued at the rate of 10.3% during the second quarter. The success of China’s ability to recover from the global downturn (through massive policy responses) contributed to rising inflation which threatened price stability. The central bank raised interest rates five times from October 2010 through July 2011. At the time, the slowdown was engineered by the Chinese government to avoid furthering the real estate bubble and misappropriation of capital. Its manufacturing PMI began to slow. Economists and market observers began to debate if China will have a hard or soft landing. The slowdown story is not new news. The following graphs show the People’s Bank of China’s interest rate decisions since 2005 and the annual average inflation since 1996.
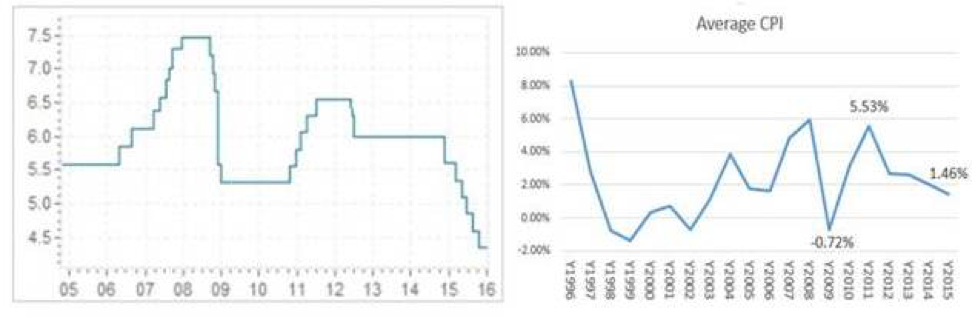 Source: Global-Rates.com[15]; Inflation.eu[16]
Thus the market response to China’s continuing slowing is a bit of a surprise. Back in June 2011, Dr. Nouriel Roubini, Dr. Doom, predicted that “China faces a “meaningful probability of a hard economic landing” after 2013 due to its misallocation of assets. Around the same time, A. Garry Shilling, a well-respected economist, suggested a China hard landing because China cannot continue its growth independent from the advanced economies which were struggling. Now, in 2016, the world continues to question if China is heading for a hard landing. The incomplete and non-transparent Chinese economic data contribute to this dialog and fear. The base case is that China will not implode economically.
Renminbi – People’s Currency
History
In the 90’s, China’s currency, Renminbi (RMB), was not a free floating currency and “maintained” by China on a fixed exchange rate basis to achieve exchange rate stability. This means it was illegal to exchange currency at any other rate. This fixed exchange rate was 8.11 RMB to $1 USD. In 2005, China moved from a fixed rate to a managed floating rate band approach. At the height of the Financial Crisis in 2009, the central parity price was set to track the USD by the People’s Bank of China (PBoC) daily, and the rate was allowed to float within a narrow band of 0.3%. This was sort of a “peg light” and has witnessed a steady and consistent rise against other currencies as USD gained strength as the U.S. economy recovers faster than most other countries. The band was widened to 0.5% in 2007, 1% in 2012 and 2% in 2014 in an attempt to further liberalize the RMB as the PBoC promised in 2010 “reform of the RMB exchange rate regime and increase the RMB exchange rate flexibility”. Even with this widening, the RMB continues its ascension along with the USD. This was viewed favorably for its appreciation and stability.

This graph shows how the RMB (CNY) has tracked the rise of the USD (a weighted index basket) since before the Financial Crisis in an effort to keep the Chinese currency steady and predictable until last summer when China decided to “liberalize” or widen RMB’s trading range against the USD in hopes of being considered a world reserve currency by being added to the Special Drawing Right (SDR) basket in 2016. After China became a member of the World Trade Organization (WTO) in December 2001, an inclusion into the SDR would be another important milestone in the integration of the Chinese economy into the global market.
Every five years, the IMF reevaluates the composition and weighting of the Special Drawing Right basket of currencies[17]. Created by the IMF in 1969 to supplement its member countries’ official reserves, the SDR is an international reserve asset. Its value is currently based on a basket of four major currencies – the U.S. dollar, the euro, the Japanese yen and the British pound. Germany and the U.S. have given their conditional support for adding the RMB to the SDR basket provided that China must continue to liberalize trading in the yuan. On November 30, 2105, IMF announced that SDR basket will be expanded to include the RMB as the fifth currency[18], effective October 1, 2016. SDRs can be exchanged for freely usable currencies.” This marks the achievement of integrating into the global monetary system[19]. China would expands its ability to settle cross-board trades and use the RMB as an acceptable medium of exchange and moving towards a free floating currency with full and unrestrained convertibility.
De-Pegging from the USD
In late July last year, China announced its intention to widen the currency trading band from 2% to 3% against the dollar[20]. That means the Renminbi would be allowed to rise or fall 3% from a daily midpoint rate set by the PBoC every morning – the daily fix. This is a further sign where China is continuing its exchange rate flexibility for the RMB but also beginning to move the focus from a bilateral RMB-USD regime to a RMB-currency basket approach. In order to be recognized as a reserve currency with its own standing, the RMB needs to delink from the USD with China being recognized as having an important share of global export and its currency “freely usable”.
In January 2015, the China Foreign Exchange Trade System (CFTS) released the new CFETS RMB Index as a new and comprehensive way to assess RMB market conditions. When the RMB is referenced to a basket of currencies, it “does not mean pegging to a basket of currencies or adjusting RMB exchange rate mechanically in line with the movements of the exchange rate index of the currencies in the basket. Market supply and demand is another important reference.[22]” The following table compares the 13 currencies in the CFETS RMB Index against the BIS Currency Basket a currency pairs (Source: Institute for International Affairs, 2-16 01 12[23]):

SDR Basket 2010[24]
| Currency | Initial new
Weight (share) |
| Euro | 37.45% |
| Japanese yen | 9.4% |
| Pound Sterling | 11.3% |
| U.S. dollar | 41.9% |
Even though RMC will de-peg from the USD, the largest weight in its new index is still the USD. When compared to the Bank of International Settlement (BIS) basket, the overall weight for the USD, the euro (EUR) and the Japanese Yen (JPY) is 62.5% in the CFETS basket vis-à-vis 50.6% in the BIS basket.
Onshore and Offshore Challenge
As a summary highlight, in 2004, Hong Kong residents were allowed to purchase and hold RMB and make the first cross-border trading of the currency. In 2007, dim sum bonds issued by Chinese banks were introduced (bonds denominated in RMB) and subsequently foreign corporations (e.g. McDonalds) and banks (e.g. HSBC) became issuers. And in 2014, Dim Sum bonds were listed on the Luxembourg exchange. In 2008, geographically limited cross-broader RMB settlements were initiated. In 2009, China entered into currency swap agreements with 14 central banks for offshore RMB holdings. And in 2010, China and Russia agreed to trade using their own respective currencies in lieu of the USD. By 2014, 25 bilateral swap agreements were in place with other central banks. But the majority of the offshore deposits remain Hong Kong and the total represents an insignificant amount of onshore deposits in China. In 2015, China opened the inter-bank bond market for central banks, sovereign wealth funds and international financial institutions. The growth of the offshore RMB market – also referred to as the CNH market – came as a rush to own Chinese currency for its onshore stability and appreciation (since it has been pegged to the rising USD), but that has reversed. With the CNY de-pegging from the dollar, offshore CNH is being sold as investors and holders are expecting the CNY to devalue as it is managed and guided to a new basket of currencies. The following chart (from FactSet) on the left, dated 1-25-2016, shows where the market believes the CNH will settle going forward. It is a straight line up from here at 6.76 CHK to 1 USD to over 6.9 CHK. This represents another 6% devaluation.

The right chart above shows the history of the CNH and USD currency pair. The CNH market now serves as a forward looking indicator or market for what the holders and investors expect the CNY to be valued. This is delivering the outcome China wants to avoid – a lack of stability in the RMB.
This is a battle between the market and the PBoC. With over USD$3 Trillion, China has been spending approximately $100 billion a month to narrow the exchange gap between the market driven CNH rate and the managed rate of the CNY. PBoC has four approaches in achieving this outcome[25]. 1) Baby Steps – to continue the careful management of the gap and deploy the necessary foreign reserve to bring CNH inline; 2) Big Steps – use a one off large scale band widening (e.g. 7%) in hope to significantly reducing the market’s further desire to indirectly bet against the CNY through selling CNH, 3) Free Style – let the currency be entirely market driven or 4) Have a Party – bring other central bankers together to form a coordinated alliance to stabilize the RMB. Baby Steps is the base case approach and likely to remain as the approach in the foreseeable future along with policy guidance from the PBOC to amplify the desired effect. China understands the need to be a responsible global player and will try to balance short and long term objectives. With the sizable war chest, a repeat of George Soros’ style of breaking the British pound in 1999 by any group is not easily accomplished under a controlled currency environment. Moreover, China is most likely be initiating new rounds of fiscal stimulus and government spending to generate economic growth and maintaining employment at the desired level. If successful, this would reduce the pressure of capital flight and driving CNH lower. Of course, if the USD continue to strengthen, this would add more challenges to China’s effort.
China Slowdown
By every indication, China has and will continue to slow. This has contributed to a reduction in demand for all commodities globally. The fear is not simply China slowing but the speed and if it will it end in a crash. Moreover, the lack of transparency contributes to speculation and distrust of official data. When the CNY and the CNH devalue, its affects China’s trading partners and many of whom are also competitors. The fear of competitive devaluation and further driving disinflation in a deflationary world. The base case is that the Chinese economy will not have a crash and its GDP will drift lower as China moves to a more service based consumer economy. As the world’s second largest economy, this change will continue to impact the world economy as China’s trading partners and competitors adjust to the changing circumstances. Moreover, China’s stock market collapse has been widely broadcast and causing investor jittery. But Chinese stocks are not widely held by foreigners and the Chinese market is made up primarily of retail traders with more of a casino mentality than long term investors. Further, many of the companies that make up the current exchange indexes are from state owned enterprises and the manufacturing economy that China intends to steer away from. Although the Chinese stock market is very relevant to the local population, its impact on the world equity markets is more psychological.
Global Growth
According to IMF Economic Outlook World Growth Projections & Adjustments[26], its global growth forecast is revised down from 3.5% to 3.4% for in 2016 and from 3.8% to 3.6% for 2017. The following table summarizes the revisions and adjustments since 2009. With very few exceptions, the initial projections for global growth have been too optimistic.

One of the biggest factors that continue to place pressure on the global economy is the seemingly bottomless oil price. The virtual collapse of the oil cartel, the rapid ramp up of Iran as a serious oil supplier, the revenue starved producers such as Russia, Venezuela, and Nigeria believe that they have no choice but to keep pumping are all pushing down oil prices. As a counter measure, large producers, such as Saudi Arabia took the position that maintaining market share is critical for its long term survival. Not unlike any other commodities, price is ultimately determined by supply and demand. In this case the supply is increasing while global demand has retreated. While recognizing that low oil price will not likely be transitory, Saudi Arabia in late December announced that it will cut 10% off its 2016 budget to adjust to the new reality. According to a recent Bloomberg report, many sovereign wealth funds that have ballooned their coffers came from oil producing nations.
The chart below shows how the assets have shrunk within a year. This is actually a serious sign. If this is sustained, each country will begin to cut entitlements and benefits to adjust to the lower revenue generated from natural resources. This would have significant social and political impact that may even lead to radicalism. Also ratings for sovereign bonds from some oil producers would be called into question and the tremor from a persistent low oil price is felt by finance, investment and cost of capital.

The New Regime – Volatility is Here to Stay
Since August last year when the world reacted to the devaluation of the CHY and the market correction in China, we have all been awakened to market volatility after many years of Fed induced hibernation.
 This graph clearly illustrates the rise in volatility for bonds (1 month Merrill MOVE index), CBOE VIX (proxy for US market), CBOE Crude Oil and the Deutsche Ban foreign exchange (Fx). The relative calmness since 2013 has given way to volatility spikes. This also helps to explain the overall poor returns for diversified portfolios last year. No one single factor can explain the rise in volatility, but it coincides with the Fed’s normalization, the collapse of oil price (demand reduction and over supply), general global economic slowdown where China is the poster child, geopolitical tension, and the shrinking of market liquidity. None of these factors appear to be reversing in the near term, and we should expect similar market volatility.
The following chart shows the National Financial Condition Index along with its three sub-components from the Chicago Fed. It is clear that financial conditions have tightened since the recent lows in 2013.

The Long Goodbye
It is well recognized that in the long run, monetary policies have their limits on the economy and alone cannot be the elixir of all economic ills. The world has relied and expected too much from central bankers. There has been a reluctance, perhaps due to political risks and absence of will, to take action on fiscal policies and structural reform. It is only human nature to rely on the path of least resistance with low short term risk to kick the can down the road. The rationale being that if we can all buy enough time, growth will be back to save us all – as if growth is an alienable right to us all.
The massive quantitative easing programs and the zero bound interest rate policy by the Fed truncated the economic free fall into depression in 2009. The Japanese’s experience, informs us that excessive debt (personal, corporate or government) fueled financial bubbles causes significant long-term damage to an economy. Twenty years of monetary follies coupled with false starts and stops have failed to meaningfully return Japan’s economy to “normal”. Mario Draghi’s famous July 26, 2012, statement in a speech at the Global Investment Conference in London that “the ECB is ready to do whatever it takes to preserve the euro. And believe me, it will be enough” launched the European phase of unlimited monetary willingness to save the day. Since then the printing press has been on overdrive – €1.1 trillion addition of asset purchase program starting in January 2015[27] in addition to a negative interest policy. On December 3, 2015, seeing the market turmoil and euro gaining strength, Mario Draghi pledged to extend its €60bn-a-month bond buying effort for another six months until March 2017 “or beyond”. Finally, on January 21, in his prepared remarks, he suggested that the ECB is willing to take more action if necessary when they meet in March[28]. The culprit is an increase in downside risk and uncertainty germinated from poor “emerging market economies’ growth prospects, volatility in financial and commodity markets, and geopolitical risks.”

Central banks have a specific mandate to maintain price stability. In the U.S., it also has the function to maintain maximum employment, but no central bankers have a mandate to maintain a buoyant market. Today, the financial markets are placing significant pressure (and central banks are responding in kind) on central bankers to maintain extreme dovishness. This may be helpful to dampen volatility, but it ultimately distorts markets and the economy. Everyone recognizes the limitation of monetary policies but like a bad habit that we cannot free ourselves of. We are hopeful that the Fed will not reverse course on its normalization or enter into a negative yield policy environment let alone restart QE. Sensible fiscal and tax policy changes would be more impactful in returning our economy to normal.
Conclusion
The Chinese will be celebrating their 4713th year on February 8th. This will be the year of the monkey. The monkey is typically thought of as smart, naughty, and unpredictable. If there is any truth to the Chinese horoscope, we need to be smart to overcome a naughty and unpredictable market. Then again, I don’t recall the last time the stock market was predictable.
[1] http://www.federalreserve.gov/monetarypolicy/fomccalendars.htm
[2] https://www.frbatlanta.org/cqer/research/gdpnow.aspx?panel=1
[3] NAIRU refers to a level of unemployment below which inflation rises and is deemed to be the natural rate of unemployment. http://scholar.harvard.edu/files/mankiw/files/jep.ballmankiw.pdf
[4] http://www.federalreserve.gov/newsevents/press/monetary/20141217a.htm
[5] http://www.federalreserve.gov/monetarypolicy/files/monetary20151216a1.pdf
[6] http://www.bls.gov/emp/ep_table_303.htm
[7] https://www.frbatlanta.org/cqer/research/gdpnow.aspx?panel=1
[8] https://www.instituteforsupplymanagement.org/ismreport/mfgrob.cfm
[9] https://www.instituteforsupplymanagement.org/ismreport/nonmfgrob.cfm
[10] http://www.sca.isr.umich.edu/
[11] https://research.stlouisfed.org/fred2/series/T10YIE
[12] http://www.bondeconomics.com/2014/05/primer-what-is-breakeven-inflation.html
[13] http://www.bls.gov/news.release/cpi.nr0.htm
[14] http://www.telegraph.co.uk/finance/financialcrisis/6432094/China-faces-economic-slowdown-in-2010.html
[15] http://www.global-rates.com/interest-rates/central-banks/central-bank-china/pbc-interest-rate.aspx
[16] http://www.inflation.eu/inflation-rates/china/historic-inflation/cpi-inflation-china.aspx
[17] http://www.imf.org/external/np/pp/eng/2015/071615.pdf
[18] http://www.imf.org/external/np/exr/faq/sdrfaq.htm
[19] http://www.brookings.edu/research/reports/2012/02/renminbi-monetary-system-prasad
[20] http://www.cnbc.com/2015/07/27/china-to-widen-yuan-trading-band.html
[22] http://hwww.chinamoney.com.cn/fe/Info/15875909
[23] http://www.iima.or.jp/Docs/column/2016/0112_e.pdf
[24] http://www.imf.org/external/np/tre/sdr/sdrbasket.htm
[25] http://www.bloomberg.com/news/videos/2016-01-15/crescenzi-markets-don-t-know-what-china-will-do-next
[26] http://www.imf.org/external/ns/cs.aspx?id=28
[27] http://www.ecb.europa.eu/press/pr/date/2015/html/pr150122_1.en.html
[28] https://www.ecb.europa.eu/press/pressconf/2016/html/is160121.en.html