The Year of the Horse
The Year of the Horse is expected to be a year in search of leadership. It has been quite befitting for the market’s January performance. After experiencing a low volatility high return 2013, the equity market during this first month of the year has been jagged. The lack of a directional conviction has reminded us that the risk and behavior of the equity markets is like a pony running wild. There are many factors that may contribute to the erratic market movements, and the most often cited factor is the beginning of the winding down process to the large scale asset program (i.e. tapering of quantitative easing) by the Federal Reserve. When tapering was first whispered back in May 2013, the market misinterpreted it as the beginning of the Federal Reserve raising interest rates. At that point, the equity market globally, especially the emerging markets, sold off. After the much anticipated Federal Reserve tapering decision in September failed to materialize, the market rebounded. At the Federal Open Market Committee (“FOMC”) meeting in December, Chairman Bernanke announced the first reduction of the QE program, and during the final FOMC meeting for the retiring Chairman last month, he confirmed an additional $10 billion per month reduction in QE.
The US Economy – Encouraging Signs
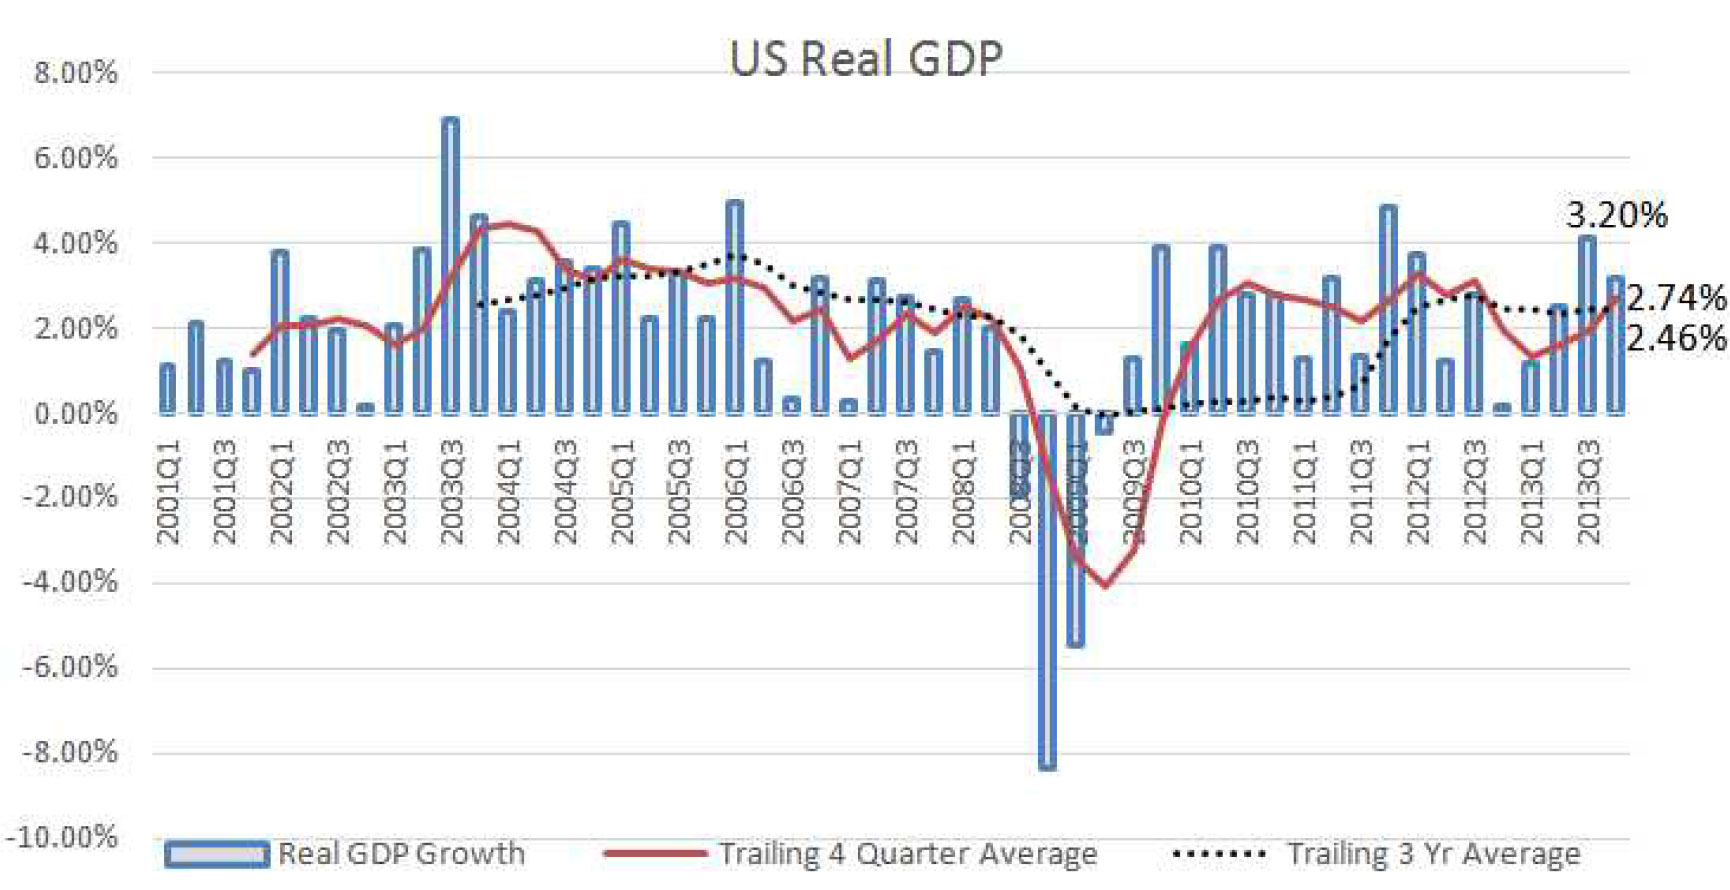
The real gross domestic product (GDP) released for the fourth quarter is 3.2%. For the year, the GDP grew at a 2.74% rate, which is higher than 1.9% for 2012.
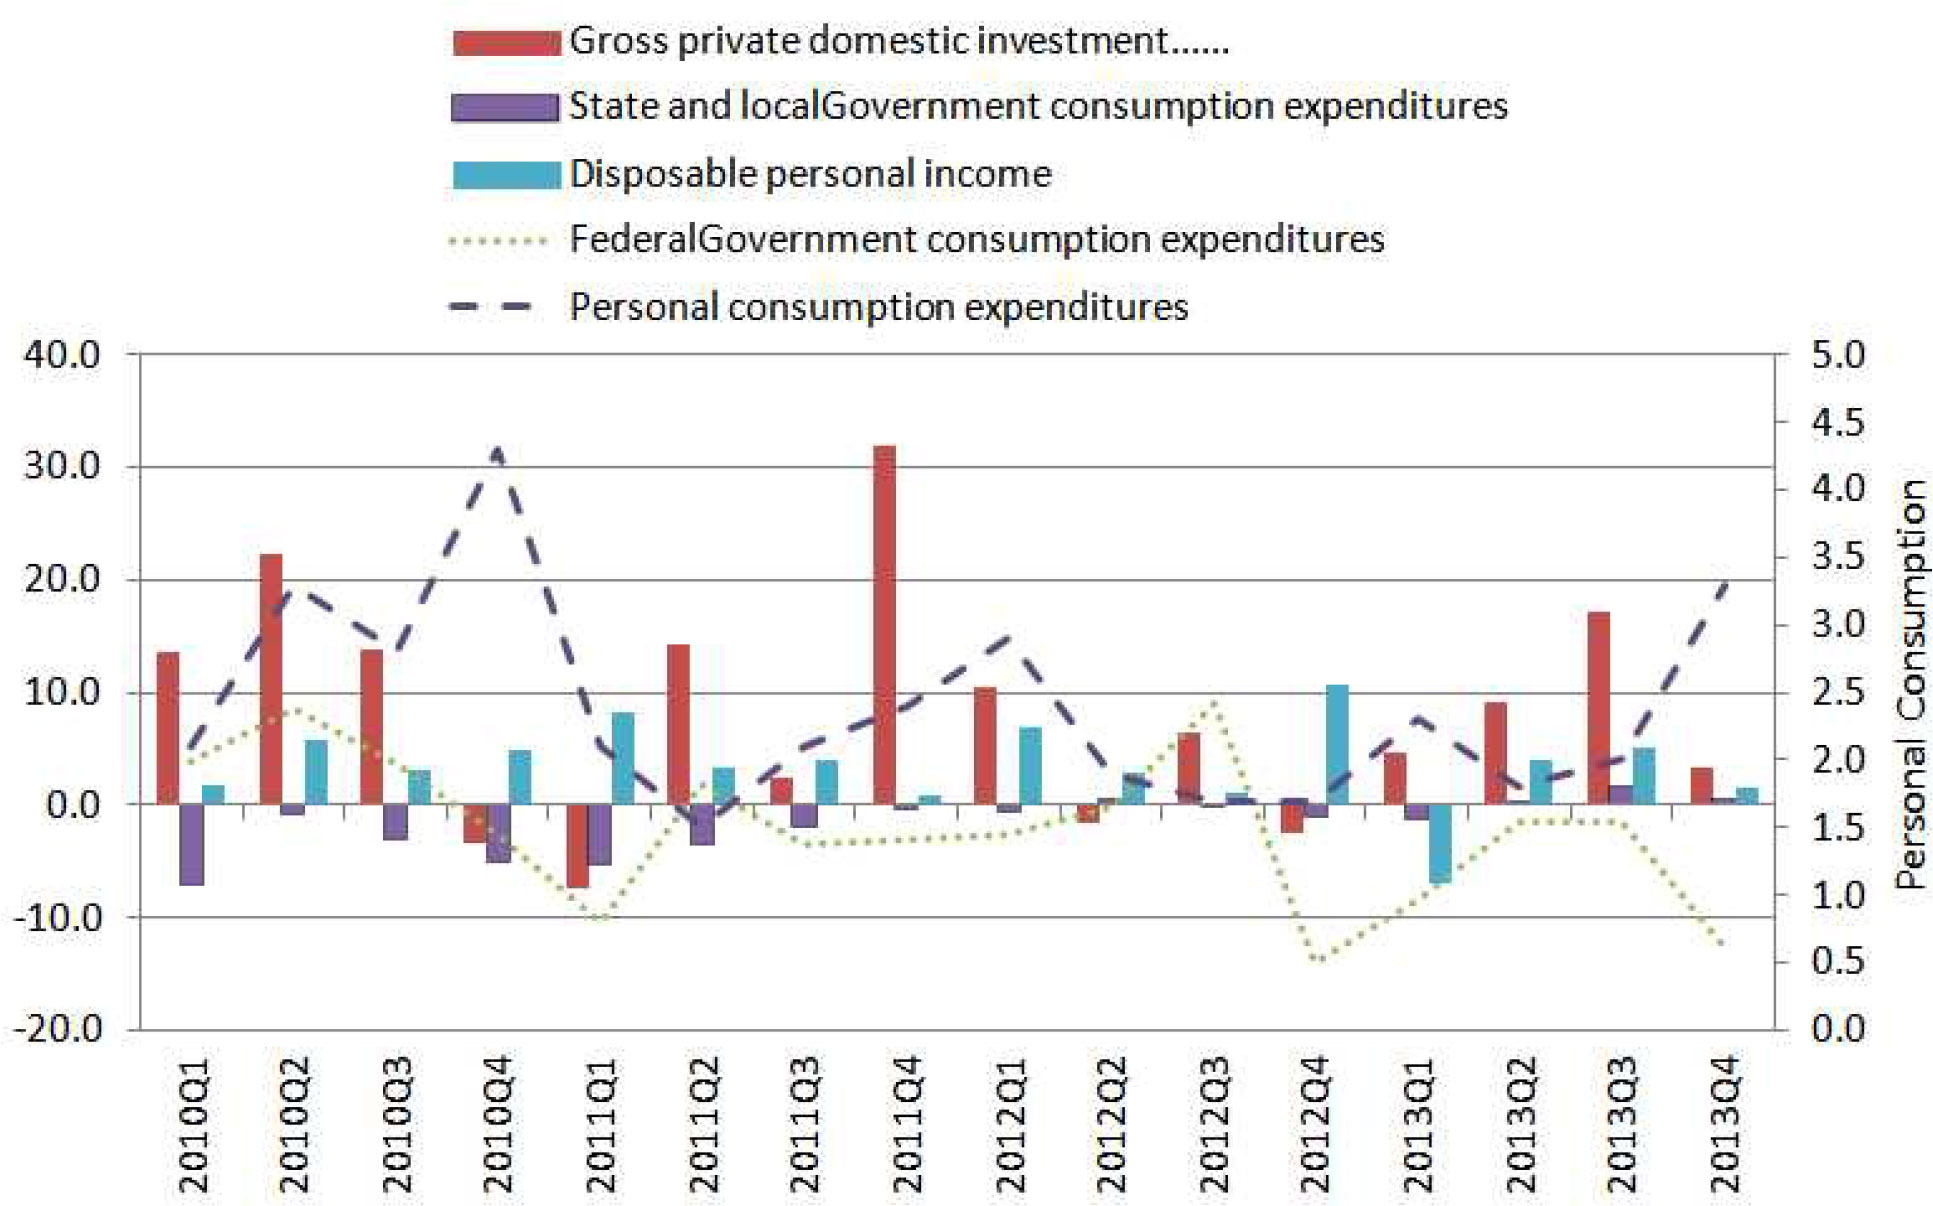
The GDP graph shows the quarter-by-quarter performance of the US economy since 2001. Quarterly GDP values can be quite volatile and do not necessarily paint a forward looking picture of the economy. Trailing periods offer a better guide about the economy. The graph shows a trailing average of 2.74% for the past 4 quarters and 2.46% for the trailing 3 years. This shows a definitive pick up in GDP since 2013. The US economy is recovering and at an improving rate. As a part of the 4th quarter advance estimate released by the Bureau of Economic Analysis, factors that contribute to the 4th quarter rate were provided1 .
Private domestic investment shows a slowdown from the prior quarter with negative contributors from residential and non residential construction. State and local government spending remains positive and steady. However, federal government spending continues to be negative and was the biggest detractor for the quarter (government shut down and sequestration). At the same time, personal consumption continued to expand with nondurable goods purchased being the big contributor. Finally, disposable income shrank compared to the prior quarter. The contrast between the contraction of federal government spending and the expansion of consumer spending shows early signs of a possible (successful) economic handoff from the public to the private sector. Another encouraging sign is the passing of the $1.1 trillion compromised spending bill to fund the government for the New Year. The bill rolls back some spending cuts and increases income for federal workers and military personnel. The reduction in budget cuts will be supportive to the economy this year.
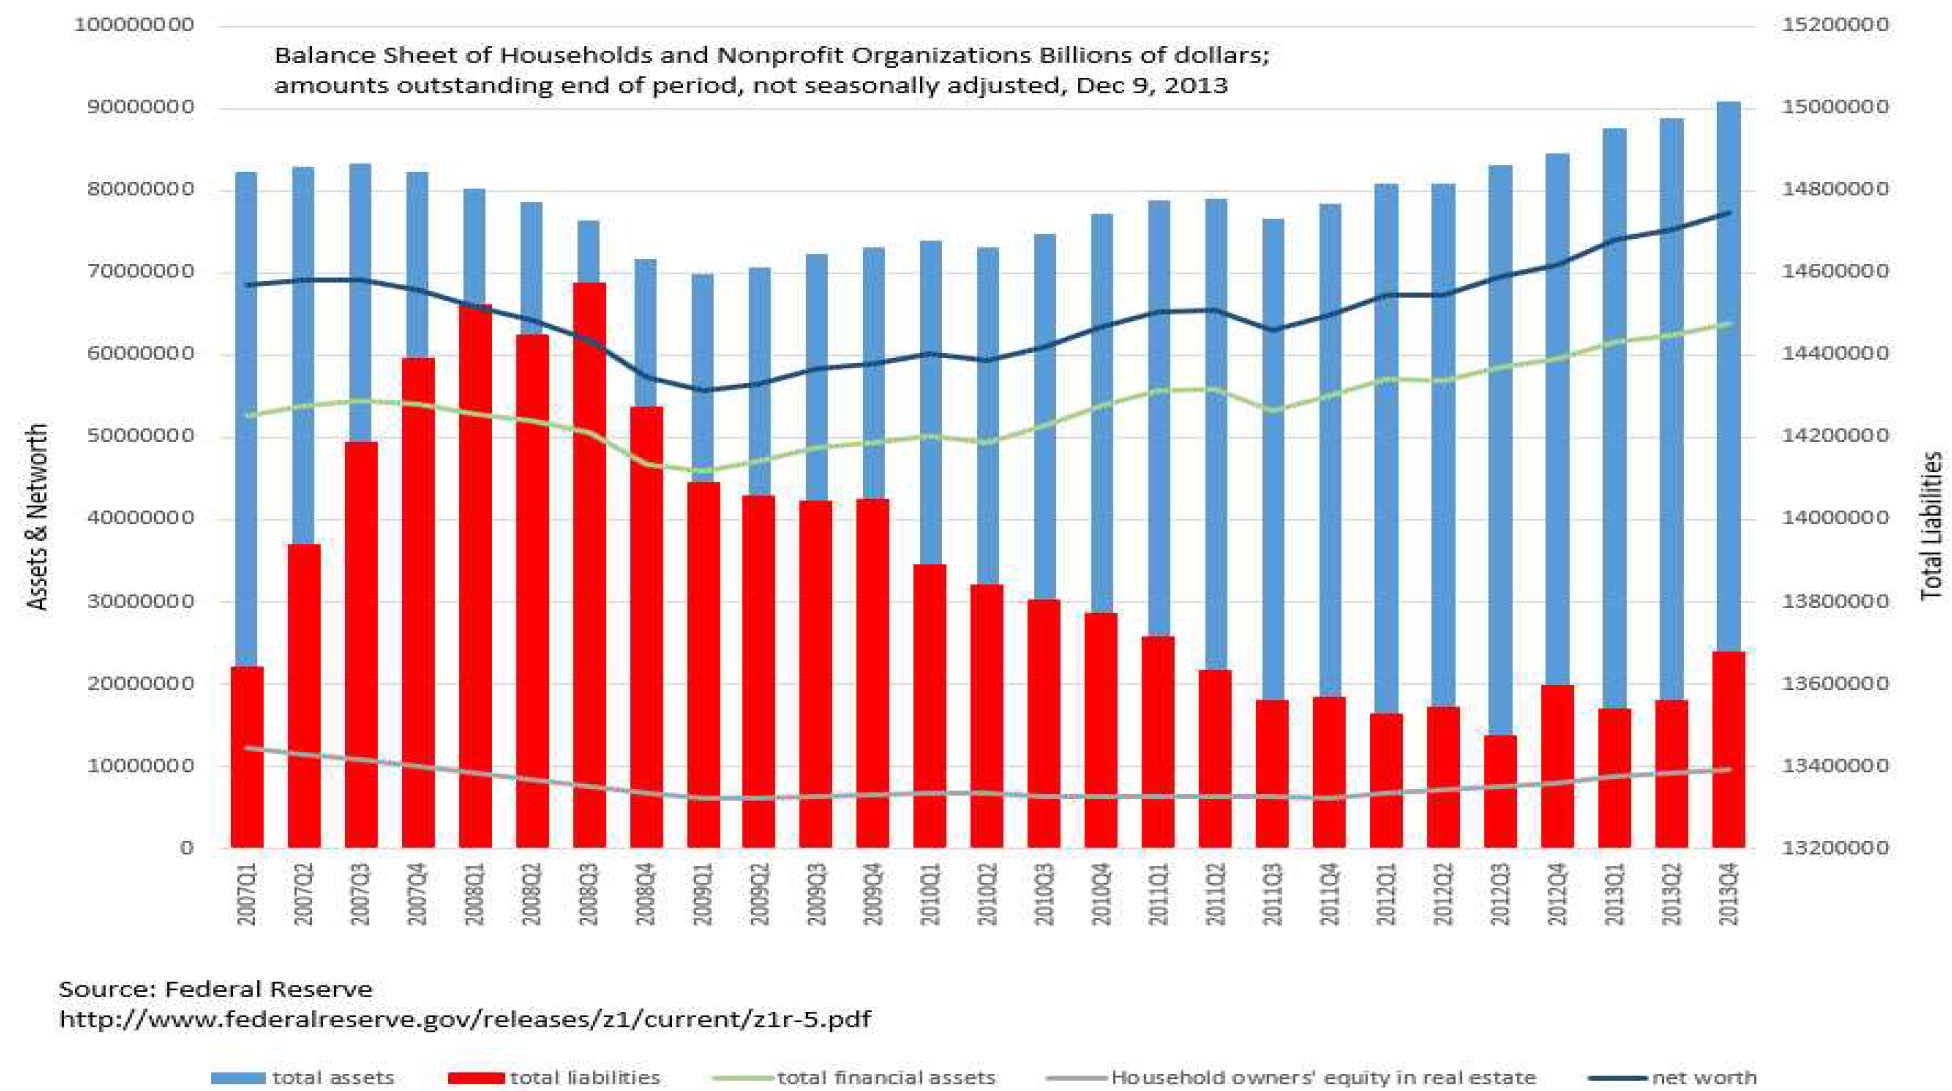
Anecdotal evidence of confidence regarding the US economy can be traced to the all-time-high household net worth reached in September (based on the Federal Reserve’s latest report, dated December 9, 2013, for the third quarter). The value of residential real estate rose by $428 billion, and corporate equities and mutual funds were up by $917 billion over the same quarter.
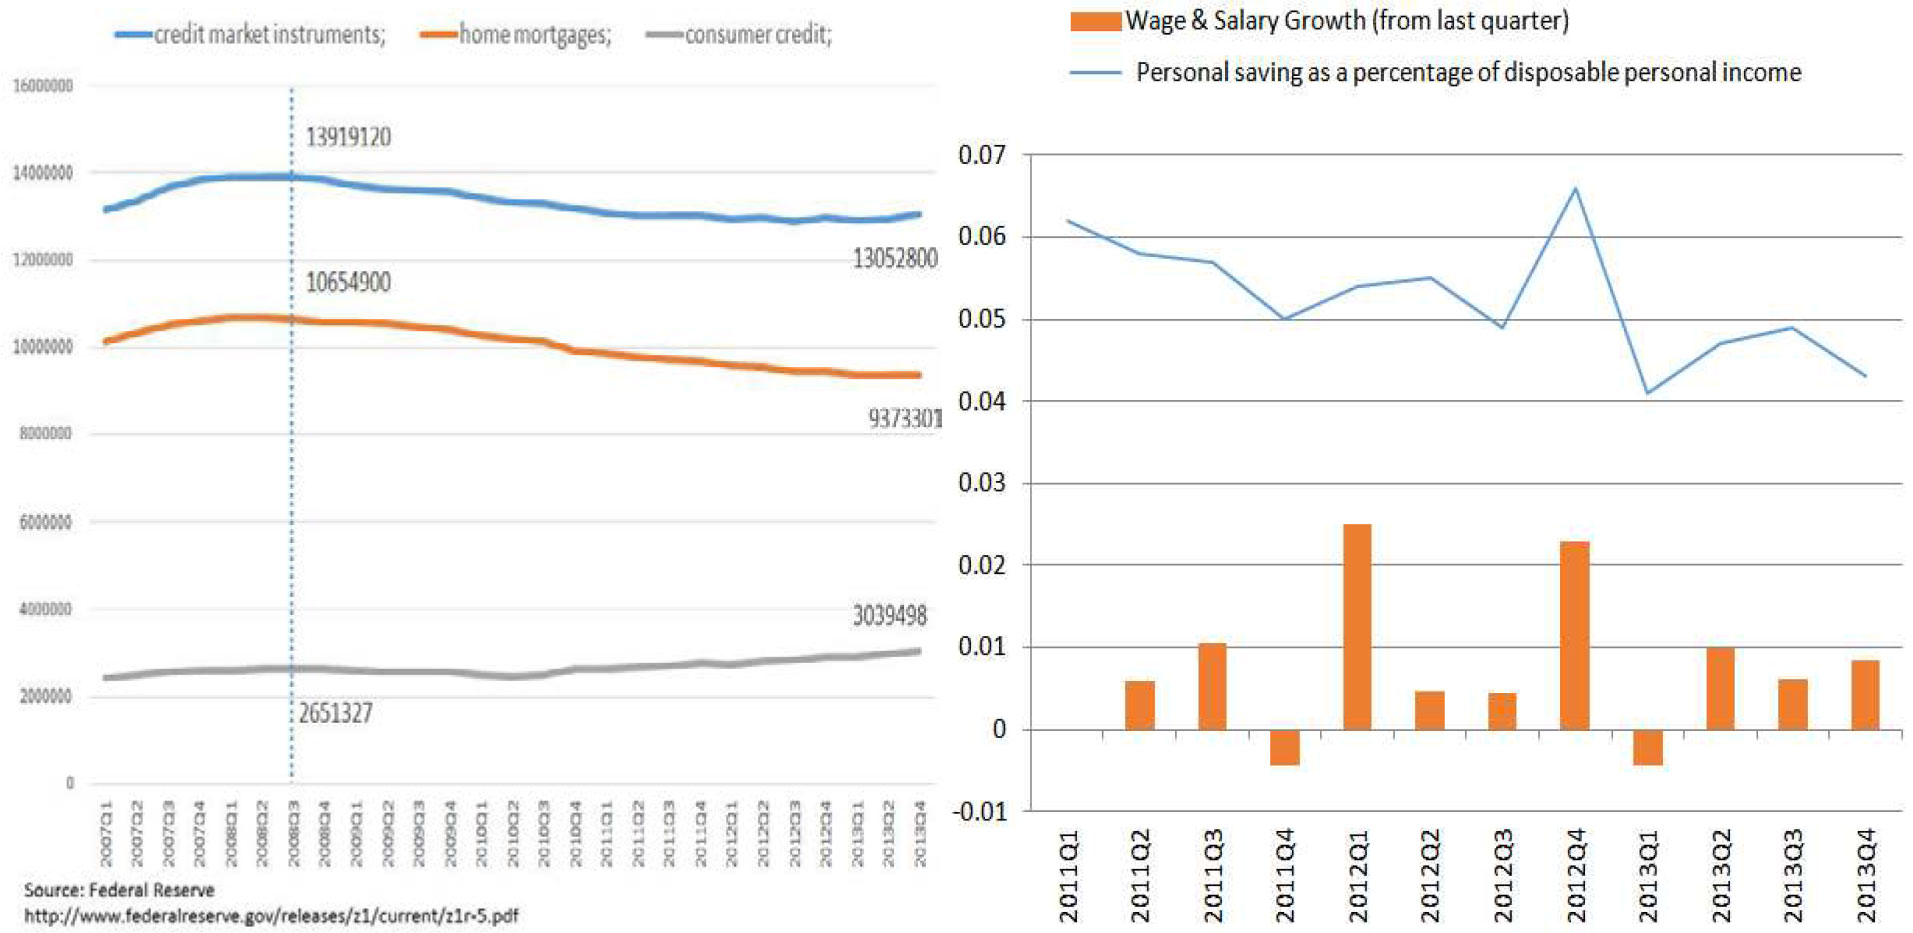
At the same time, the total debt remains below the height reached during the third quarter 2008 as evidence of deleveraging and balance sheet repair by consumers since the Great Recession. An exception is that consumer credit is slowly expanding even under stagnant wages. This may be an additional source for continuing personal consumption expansion.
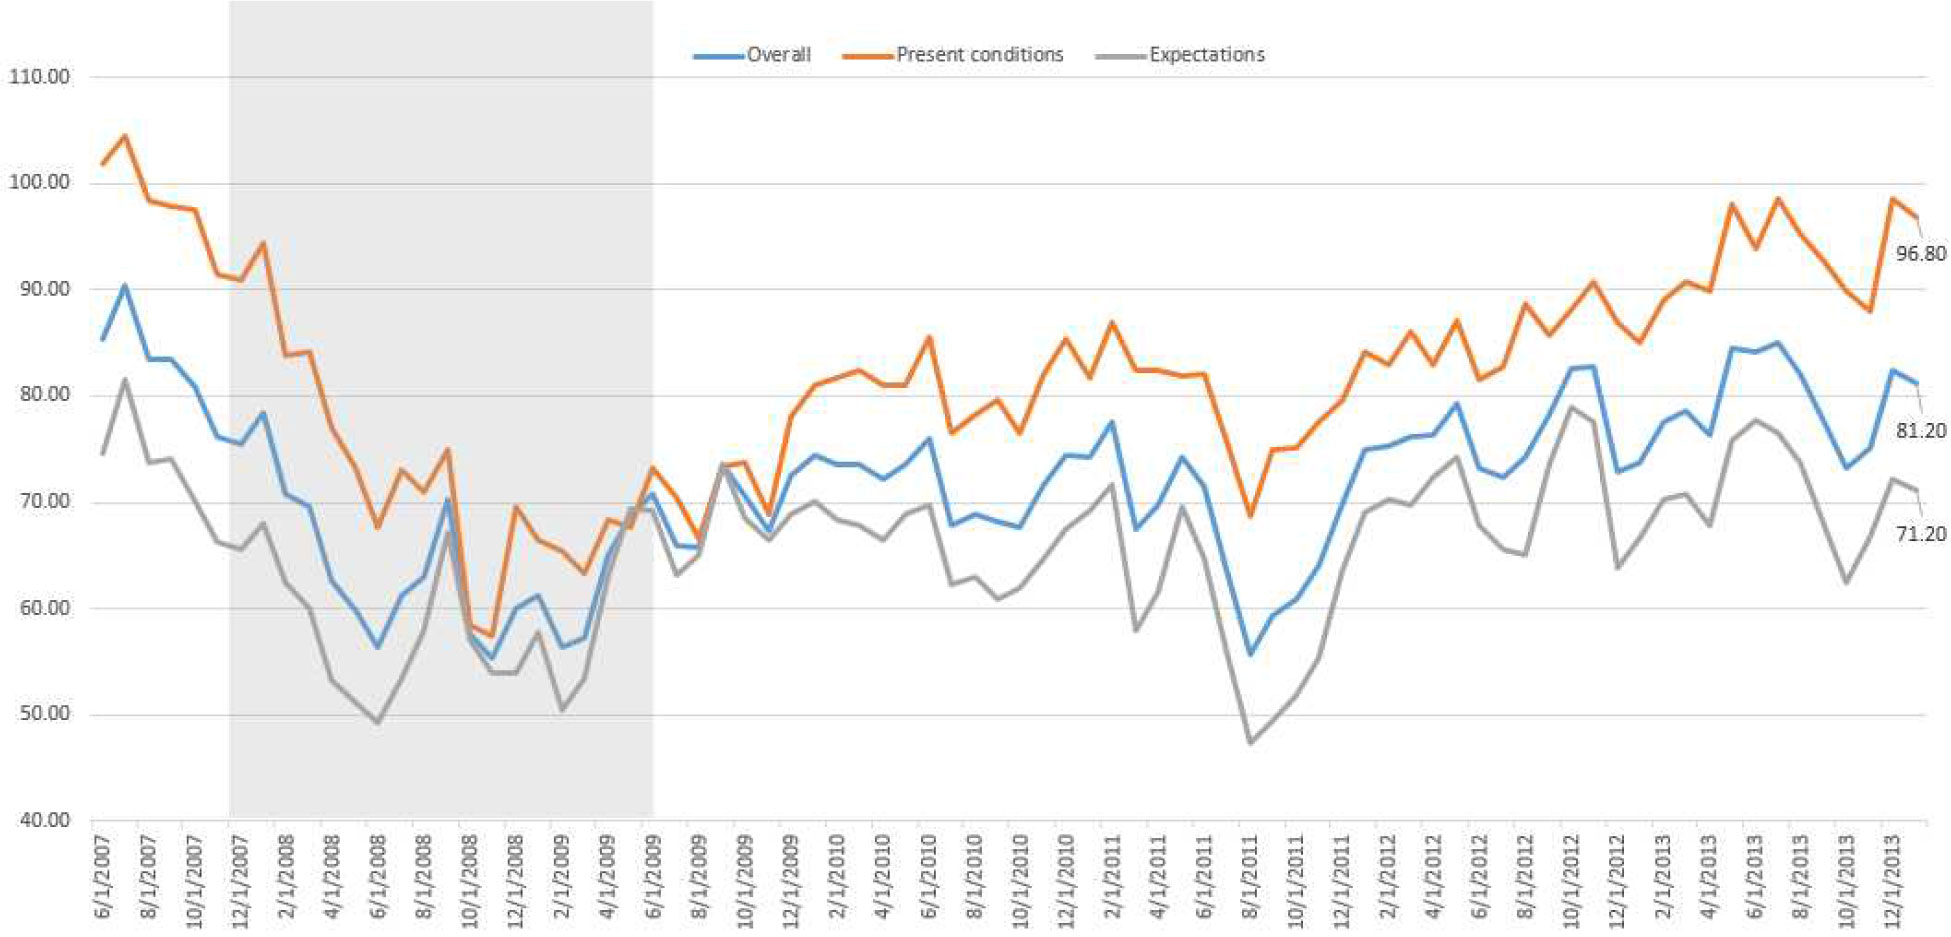
A continuing troubling sign however is the anemic wage growth. According to the latest Bureau of Economic Analysis report, the wage growth is barely keeping up with inflation. With consumers representing roughly 67% of the GDP, how consumers feel now and about the future provides a useful perspective about the future course of the US economy. The monthly Surveys of Consumers since 1946 are conducted by the Survey Research Center at the University of Michigan2 . The Index of Consumer Expectations focuses on three areas: how consumers view prospects for their own financial situation, how they view prospects for the general economy over the near term, and their view of prospects for the economy over the long term.
Although present condition index and the expectation index have both recovered from the low in October and November last year, the trend is slightly down even with the seasonally adjusted holiday spending of 0.6% increase in November and 0.4% in December which marked the best consecutive gains since 2012.
Unemployment – Mixed Picture
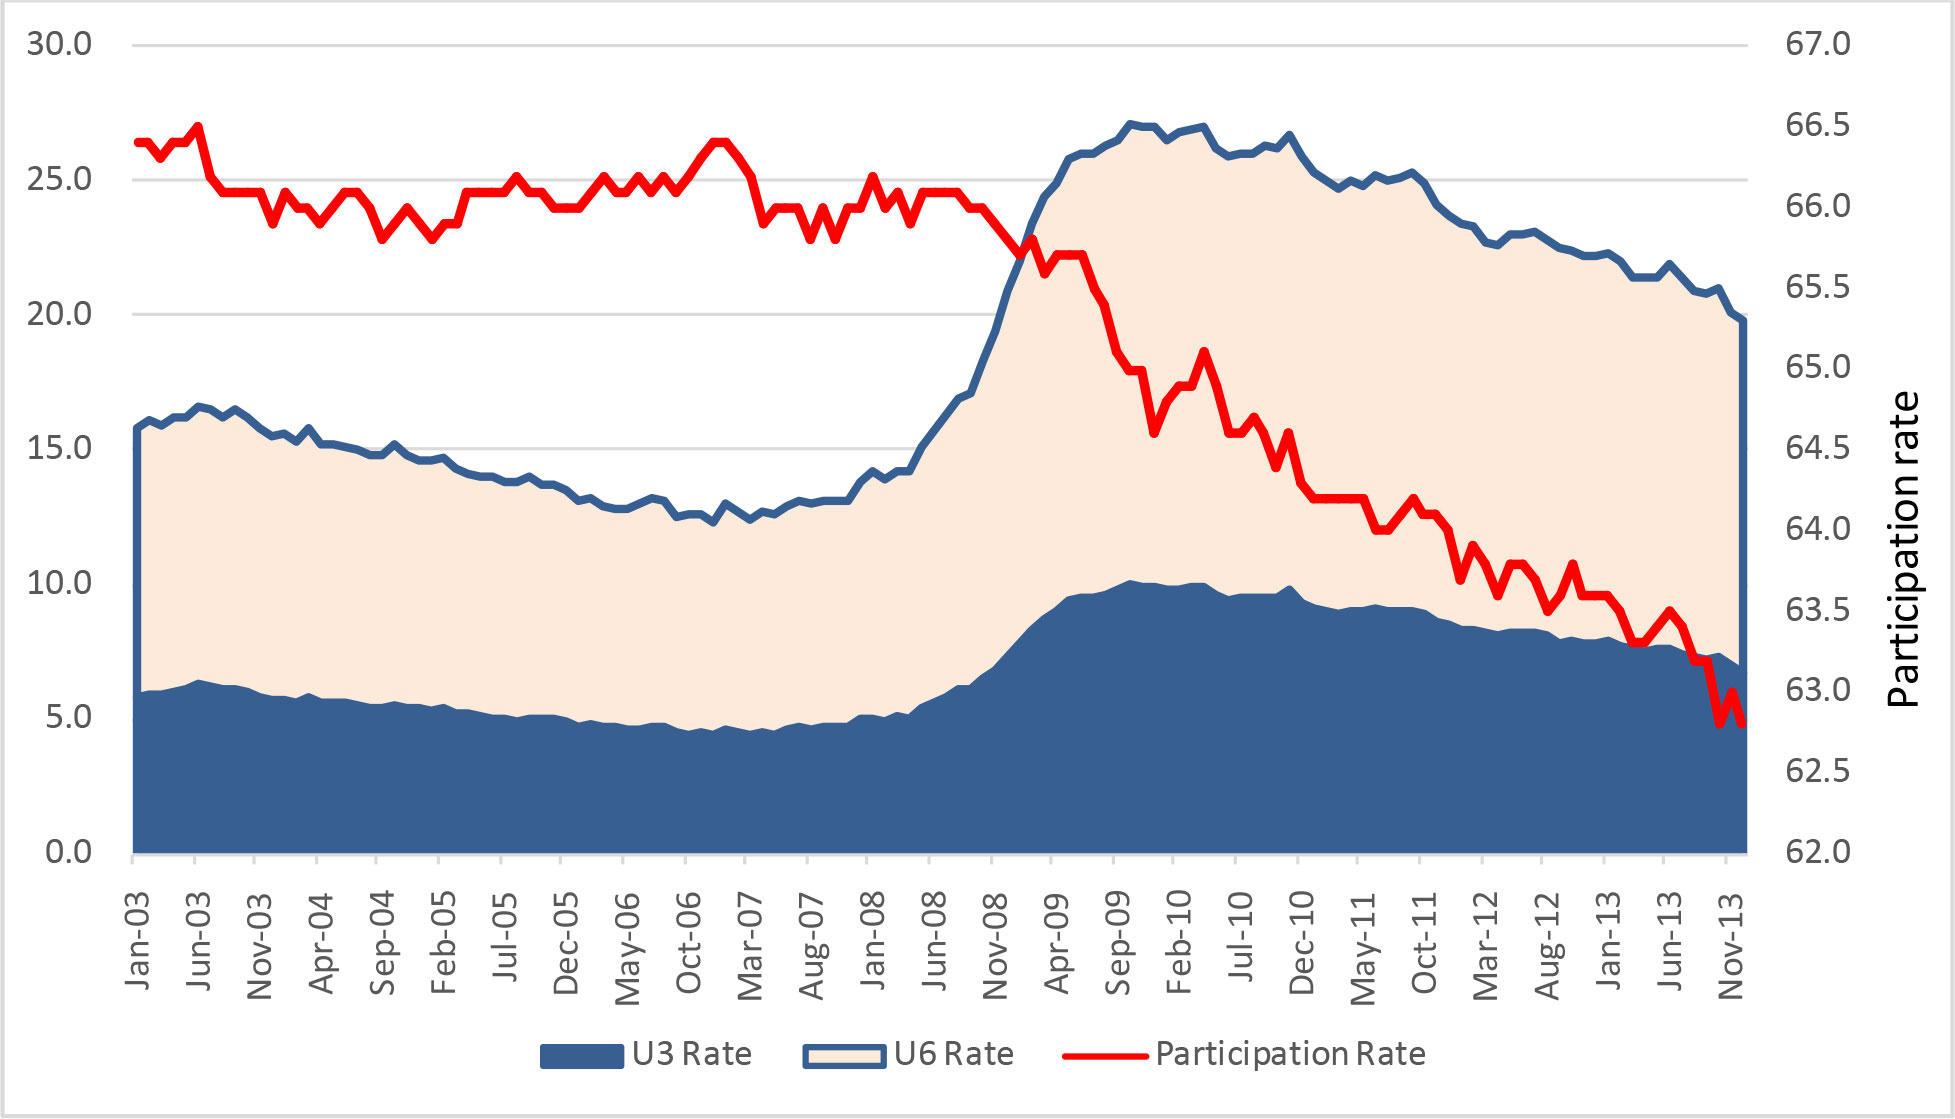
The official unemployment rate (U3) dropped to 6.7%, but the more complete gauge of U6 remains high at 13.1% and the labor participating rate continues to decline and is now at 62.8% in December. The U6 rate has trended lower but at a more gradual pace. The U6 unemployment rate includes people without work seeking full-time employment (i.e. the U-3 rate), but also includes “marginally attached workers and those working part-time for economic reasons.” Note that some of these part-time workers counted as employed by U-3 could be working as little as an hour a week, and the “marginally attached workers” include those who have gotten discouraged and stopped looking but still want to work. U6 is a more complete indicator of the employment picture rather than the strictly defined unemployed.
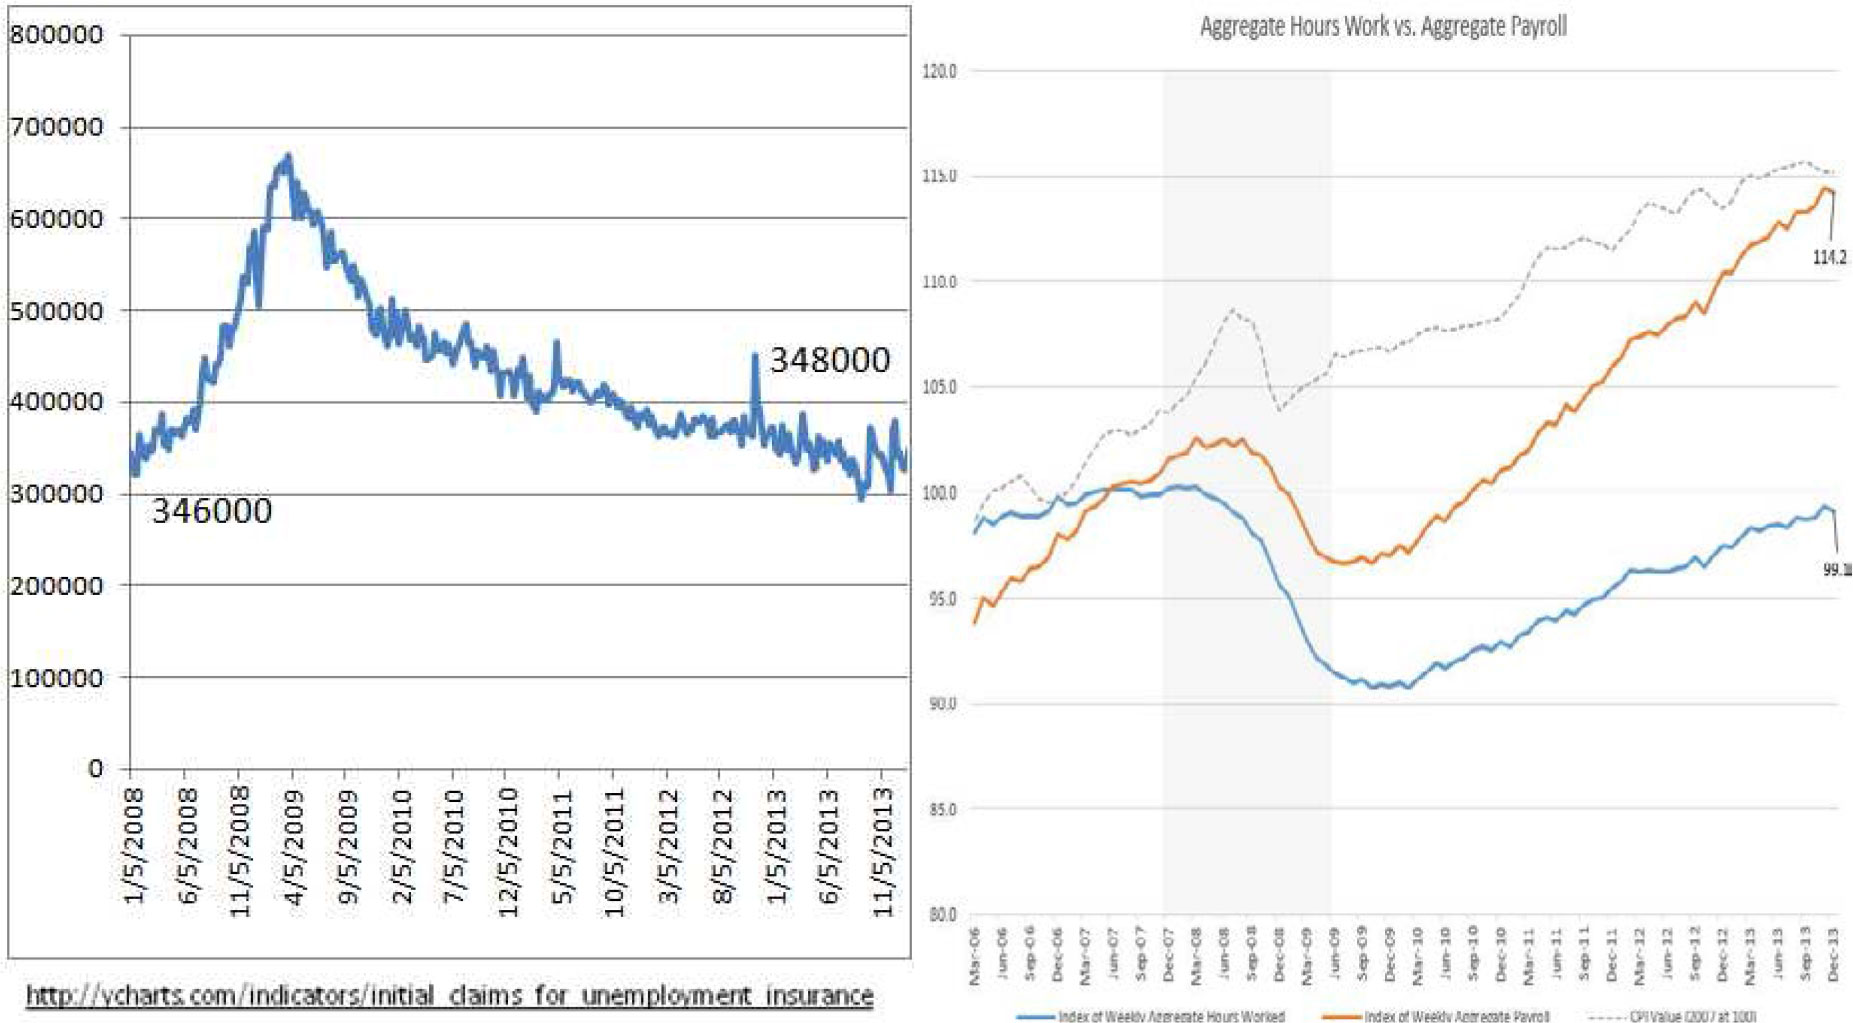
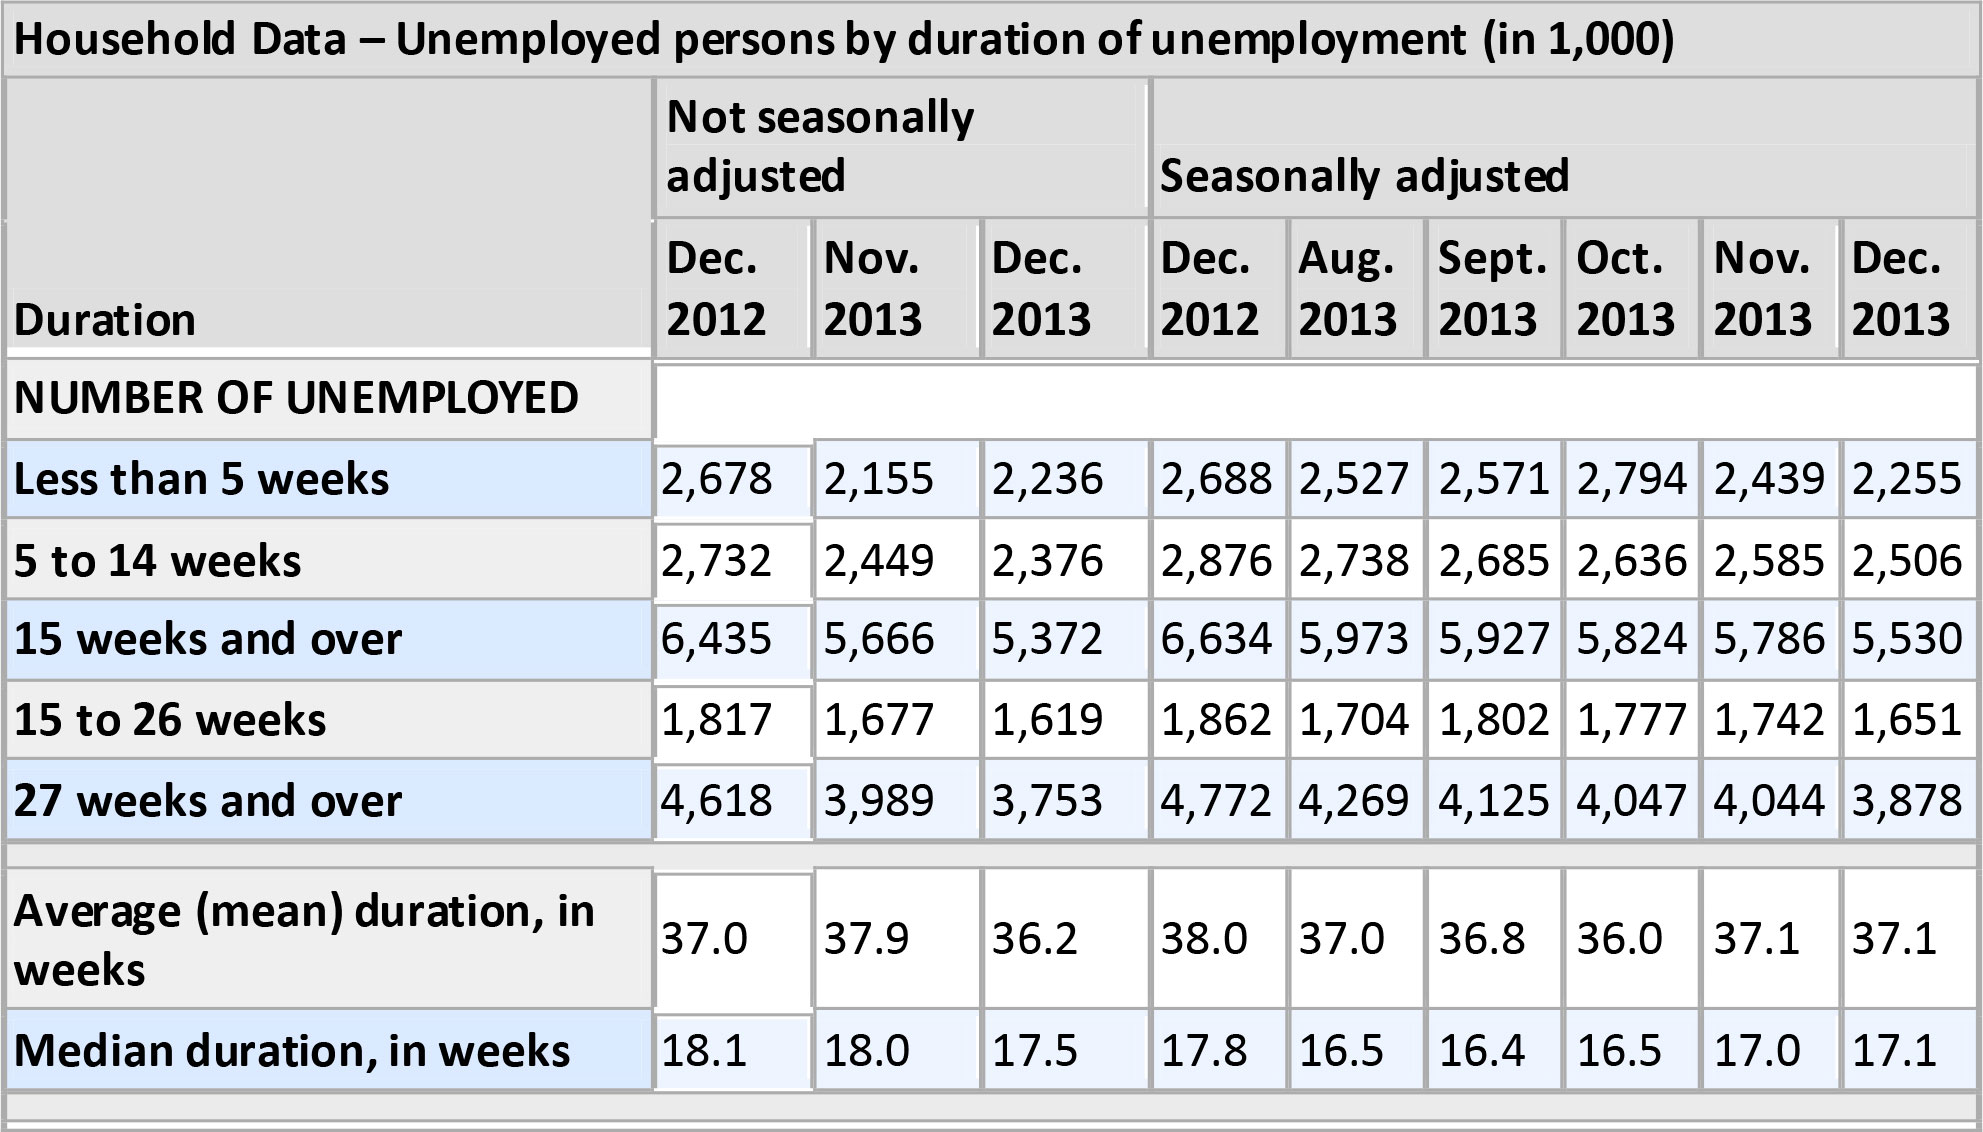
The initial jobless claims for the week of January 25, 2014, were 348,000 as compared to 670,000 for the week of March 28, 2009. In fact, the initial jobless claim has fallen back to the January 5, 2008, rate of 346,000 when the recession was just beginning.The index of weekly aggregate payroll3 continues to move upwards even though it is barely keeping up with inflation, But the index of aggregate weekly hours worked4 remains below pre-recession level.According to the DOL data5 , the long-term unemployed (27weeks or longer) remains very high.
The data suggests an employment picture of a persistent group of workers unable to get jobs and contributes to the structural unemployment condition. At the same time U3 unemployment rate continued to improve suggests the rest of the non-discouraged working age population gets and keeps jobs and is moving on.
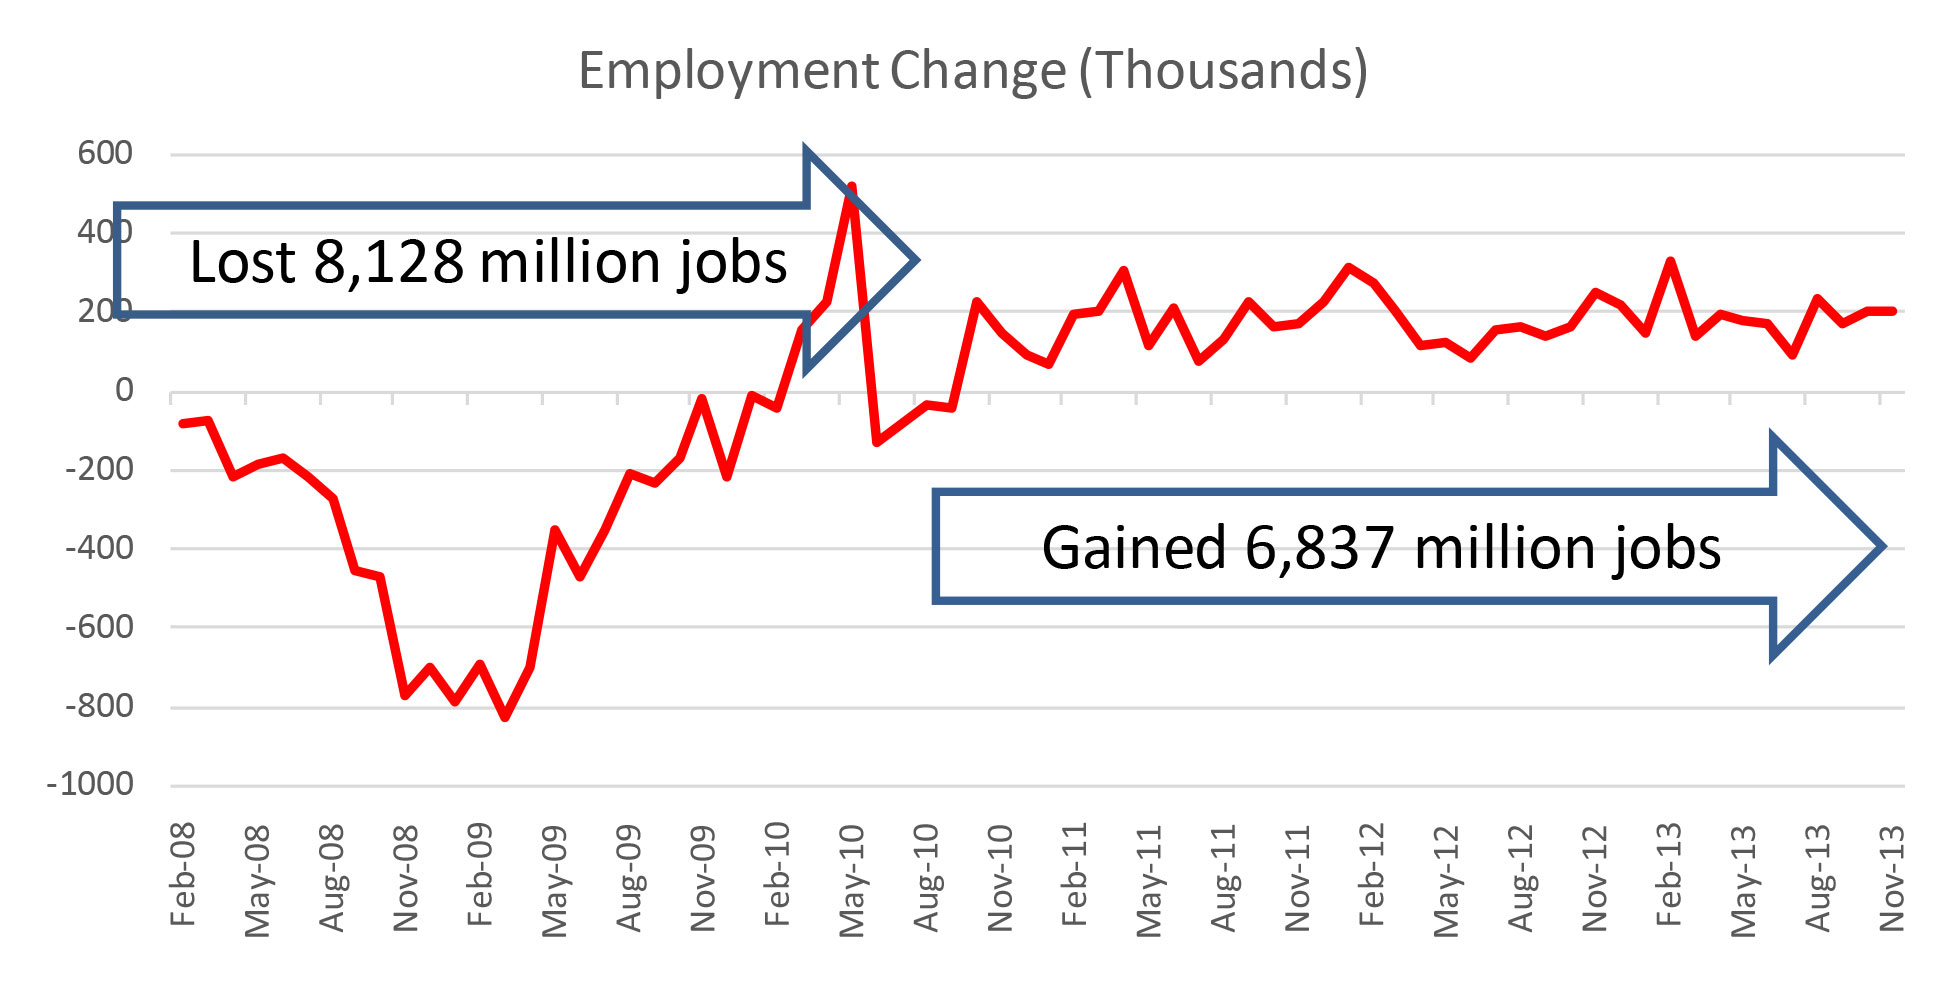
During the Great Recession, over 8 million jobs were lost, and since the beginning of the economic recovery, over 6.8 million jobs have been gained. Although the prior chart does not speak to the type and quality of jobs gained, some of the remaining 1.3 million jobs lost are likely to be permanent.
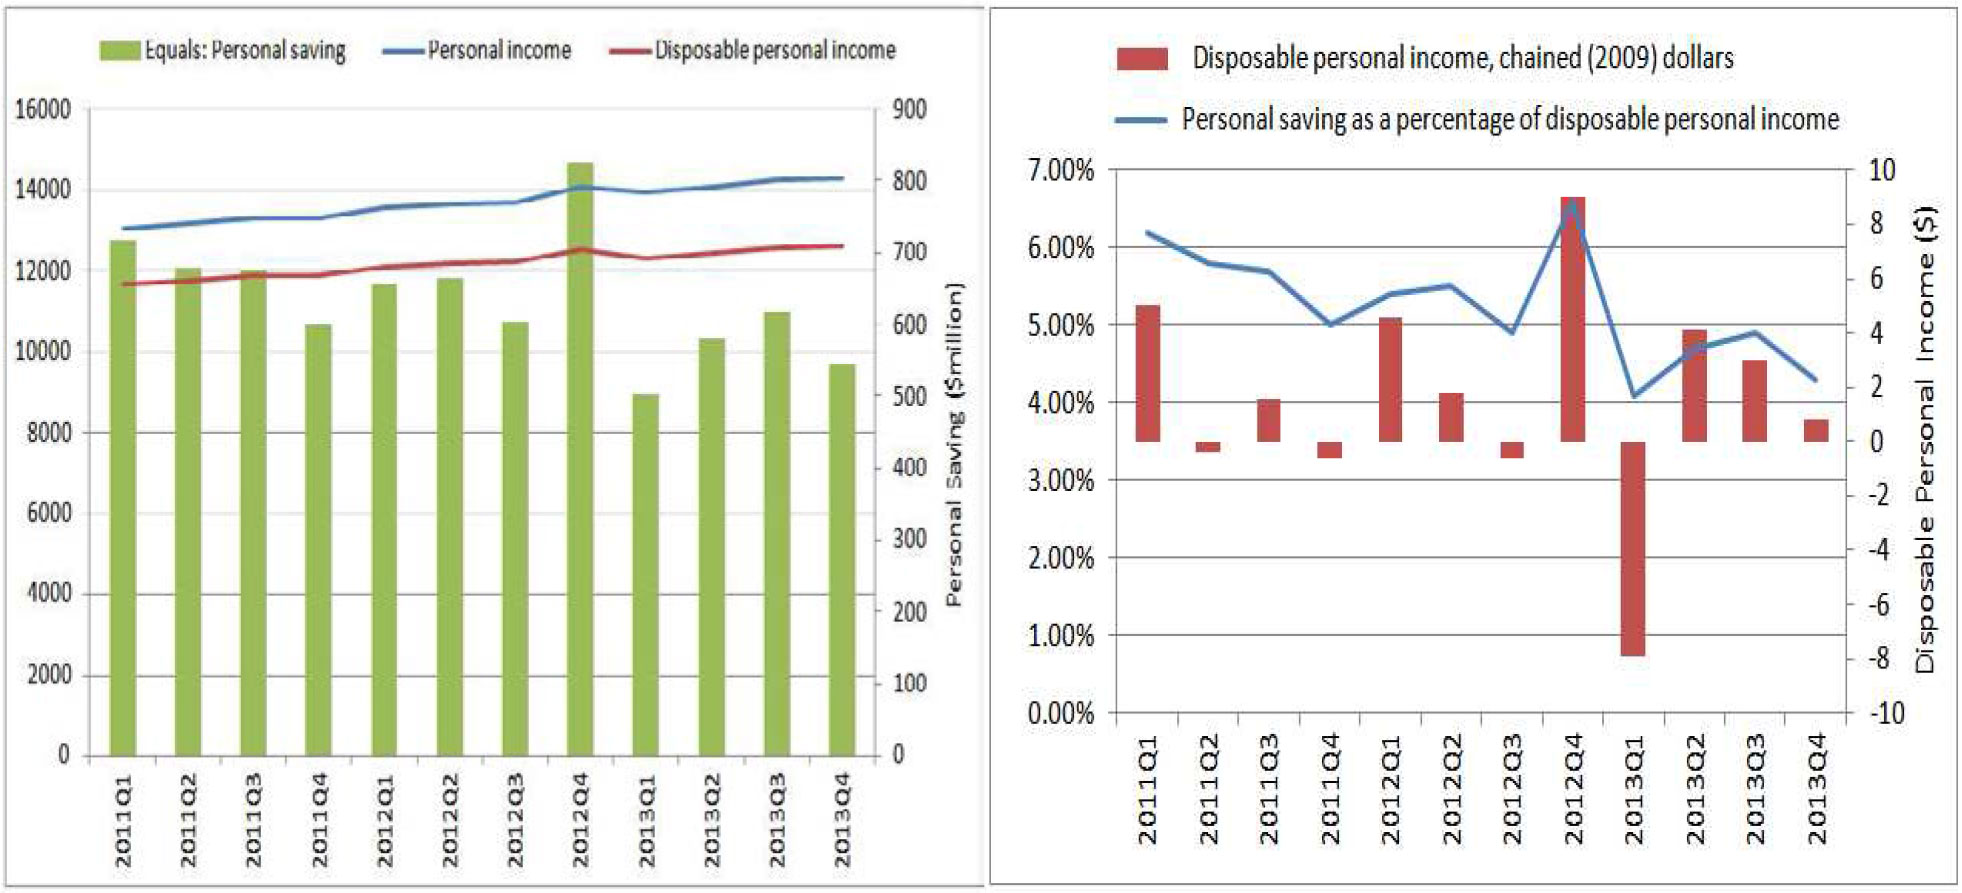
Personal income continues its slow but steady rise with disposable income weakening a bit. As stated earlier, the personal spending component of the 4th quarter GDP shows a healthy increase and it is at a cost to lower savings. One view is that the employed workers are feeling better about their economic condition and the US economy overall and are willing to spend “again”(or maybe just feel like spending after a number of years of belt tightening). There is a general sense that the economy is moving on with or without the unemployed, but the social and financial costs in supporting the unemployed, “marginally attached workers and those working part-time for economic reasons,” continue to place a drag on the economy.
Federal Reserve – May Be Encouraging News for the US
The December 17-18 meeting last year ushered in the long awaited “tapering” to the large scale asset purchase program (a.k.a. Quantitative Easing or QE) where the Federal Reserve has been purchasing $40 billion agency mortgage-backed securities and $45 billion longer-term Treasury securities each month. The reasons given to support the $10 billion reduction in QE are the continuing improvement in the broad economy as well as the labor market. The meeting press release stated (underline for emphasis):
Taking into account the extent of federal fiscal retrenchment since the inception of its current asset purchase program, the Committee sees the improvement in economic activity and labor market conditions over that period as consistent with growing underlying strength in the broader economy. In light of the cumulative progress toward maximum employment and the improvement in the outlook for labor market conditions, the Committee decided to modestly reduce the pace of its asset purchases. Beginning in January, the Committee will add to its holdings of agency mortgage-backed securities at a pace of $35 billion per month rather than $40 billion per month, and will add to its holdings of longer-term Treasury securities at a pace of $40 billion per month rather than $45 billion per month. The Committee is maintaining its existing policy of reinvesting principal payments from its holdings of agency debt and agency mortgage-backed securities in agency mortgage-backed securities and of rolling over maturing Treasury securities at auction. The Committee’s sizable and still-increasing holdings of longer-term securities should maintain downward pressure on longer-term interest rates, support mortgage markets, and help to make broader financial conditions more accommodative, which in turn should promote a stronger economic recovery and help to ensure that inflation, over time, is at the rate most consistent with the Committee’s dual mandate.
In the FOMC minutes for this year end meeting, the following summary of projections was provided:
| Central tendency6 | |||||
| Variable | 2013 | 2014 | 2015 | 2016 | Longer run |
| Change in real GDP | 2.2 to 2.3 | 2.8 to 3.2 | 3.0 to 3.4 | 2.5 to 3.2 | 2.2 to 2.4 |
| September projection | 2.0 to 2.3 | 2.9 to 3.1 | 3.0 to 3.5 | 2.5 to 3.3 | 2.2 to 2.5 |
| Unemployment rate | 7.0 to 7.1 | 6.3 to 6.6 | 5.8 to 6.1 | 5.3 to 5.8 | 5.2 to 5.8 |
| September projection | 7.1 to 7.3 | 6.4 to 6.8 | 5.9 to 6.2 | 5.4 to 5.9 | 5.2 to 5.8 |
| PCE inflation | 0.9 to 1.0 | 1.4 to 1.6 | 1.5 to 2.0 | 1.7 to 2.0 | 2.0 |
| September projection | 1.1 to 1.2 | 1.3 to 1.8 | 1.6 to 2.0 | 1.7 to 2.0 | 2.0 |
| Core PCE inflation | 1.1 to 1.2 | 1.4 to 1.6 | 1.6 to 2.0 | 1.8 to 2.0 | |
| September projection | 1.2 to 1.3 | 1.5 to 1.7 | 1.7 to 2.0 | 1.9 to 2.0 | |
The Federal Reserve is expecting a continual but gradual improvement in the GDP and is in line with the current modest trend improvement from 1.9% in 2012, 2.74% in 2013 and around 3% for 2014.
Also, the unemployment rate is expected to gradually decrease as well with inflation continuing to remain below the 2% target through 2016.
According to the January 29, 2014, FOMC press release for its latest meeting, another $10 billion reduction in QE will be made in February citing the same supporting factors of continuing improvement in the broad economy as well as the labor market.
The Committee expects that, with appropriate policy accommodation, economic activity will expand at a moderate pace and the unemployment rate will gradually decline toward levels the Committee judges consistent with its dual mandate. The Committee sees the risks to the outlook for the economy and the labor market as having become more nearly balanced. The Committee recognizes that inflation persistently below its 2 percent objective could pose risks to economic performance, and it is monitoring inflation developments carefully for evidence that inflation will move back toward its objective over the medium term.
Taking into account the extent of federal fiscal retrenchment since the inception of its current asset purchase program, the Committee continues to see the improvement in economic activity and labor market conditions over that period as consistent with growing underlying strength in the broader economy. In light of the cumulative progress toward maximum employment and the improvement in the outlook for labor market conditions, the Committee decided to make a further measured reduction in the pace of its asset purchases. Beginning in February, the Committee will add to its holdings of agency mortgage-backed securities at a pace of $30 billion per month rather than $35 billion per month, and will add to its holdings of longer-term Treasury securities at a pace of $35 billion per month rather than $40 billion per month. The Committee is maintaining its existing policy of reinvesting principal payments from its holdings of agency debt and agency mortgage-backed securities in agency mortgage-backed securities and of rolling over maturing Treasury securities at auction.
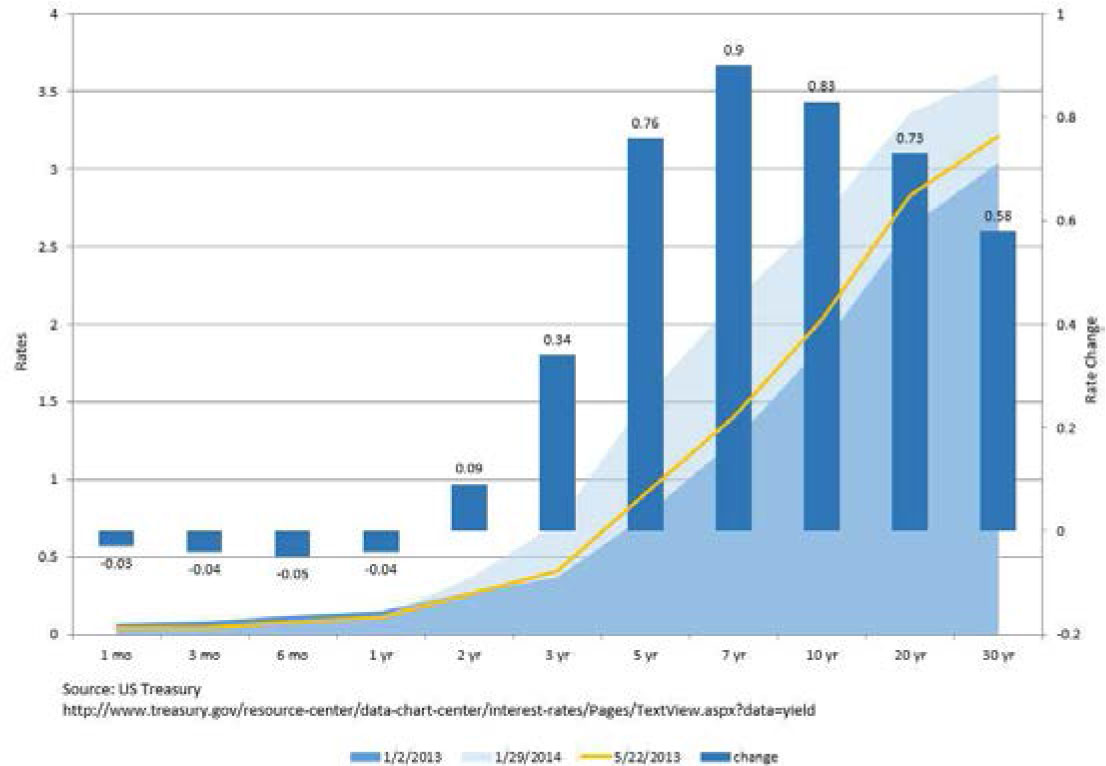
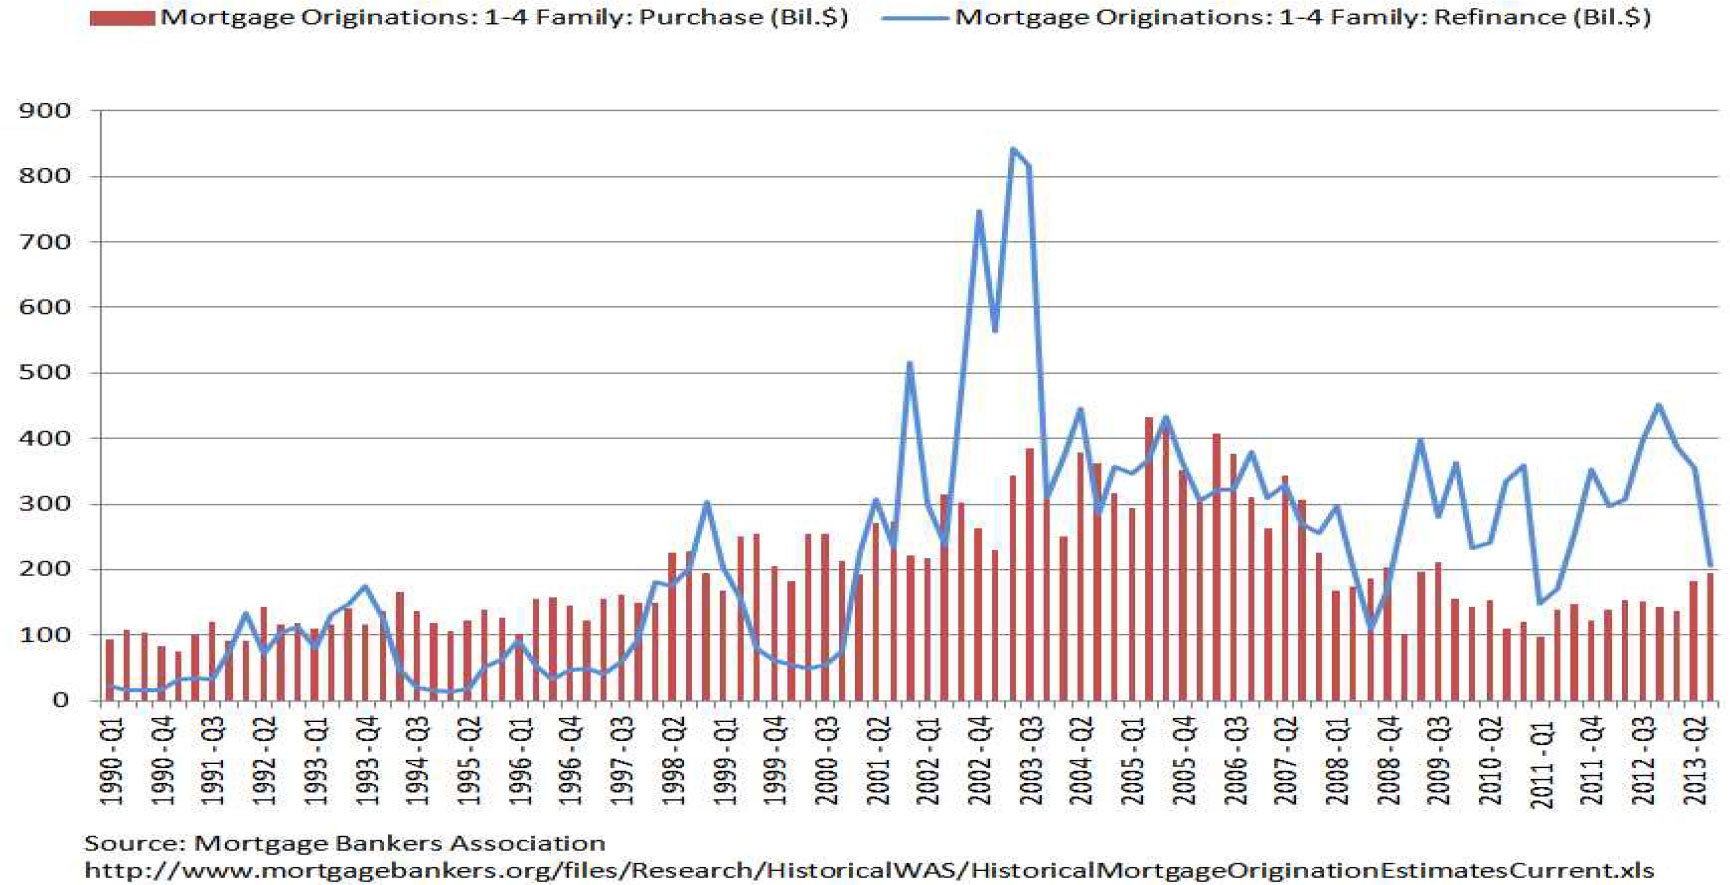
The first whisper of a Federal Reserve taper on May 22 and the ultimate taper that started in January have shifted the yield curve to a new rate band. The left graph shows the movement of the yield curve from the beginning of 2013 through the May 20th whisper to current. The blue bar shows the change in rate. It is clear that the market has come to the understanding that tapering does not equate to raising rates by the Federal Reserve. In fact, this graph shows that short term yields (1 month to 1 year) have gone down from January 2013. The largest rate impact is centered along the “belly” of the yield curve. The 5-, 7- and 10-year yields have been most impacted. This is also the portion of the curve to which mortgage and commercial credits are tied. Thus, it is not surprising to witness a significant drop in mortgage refinancing activities.
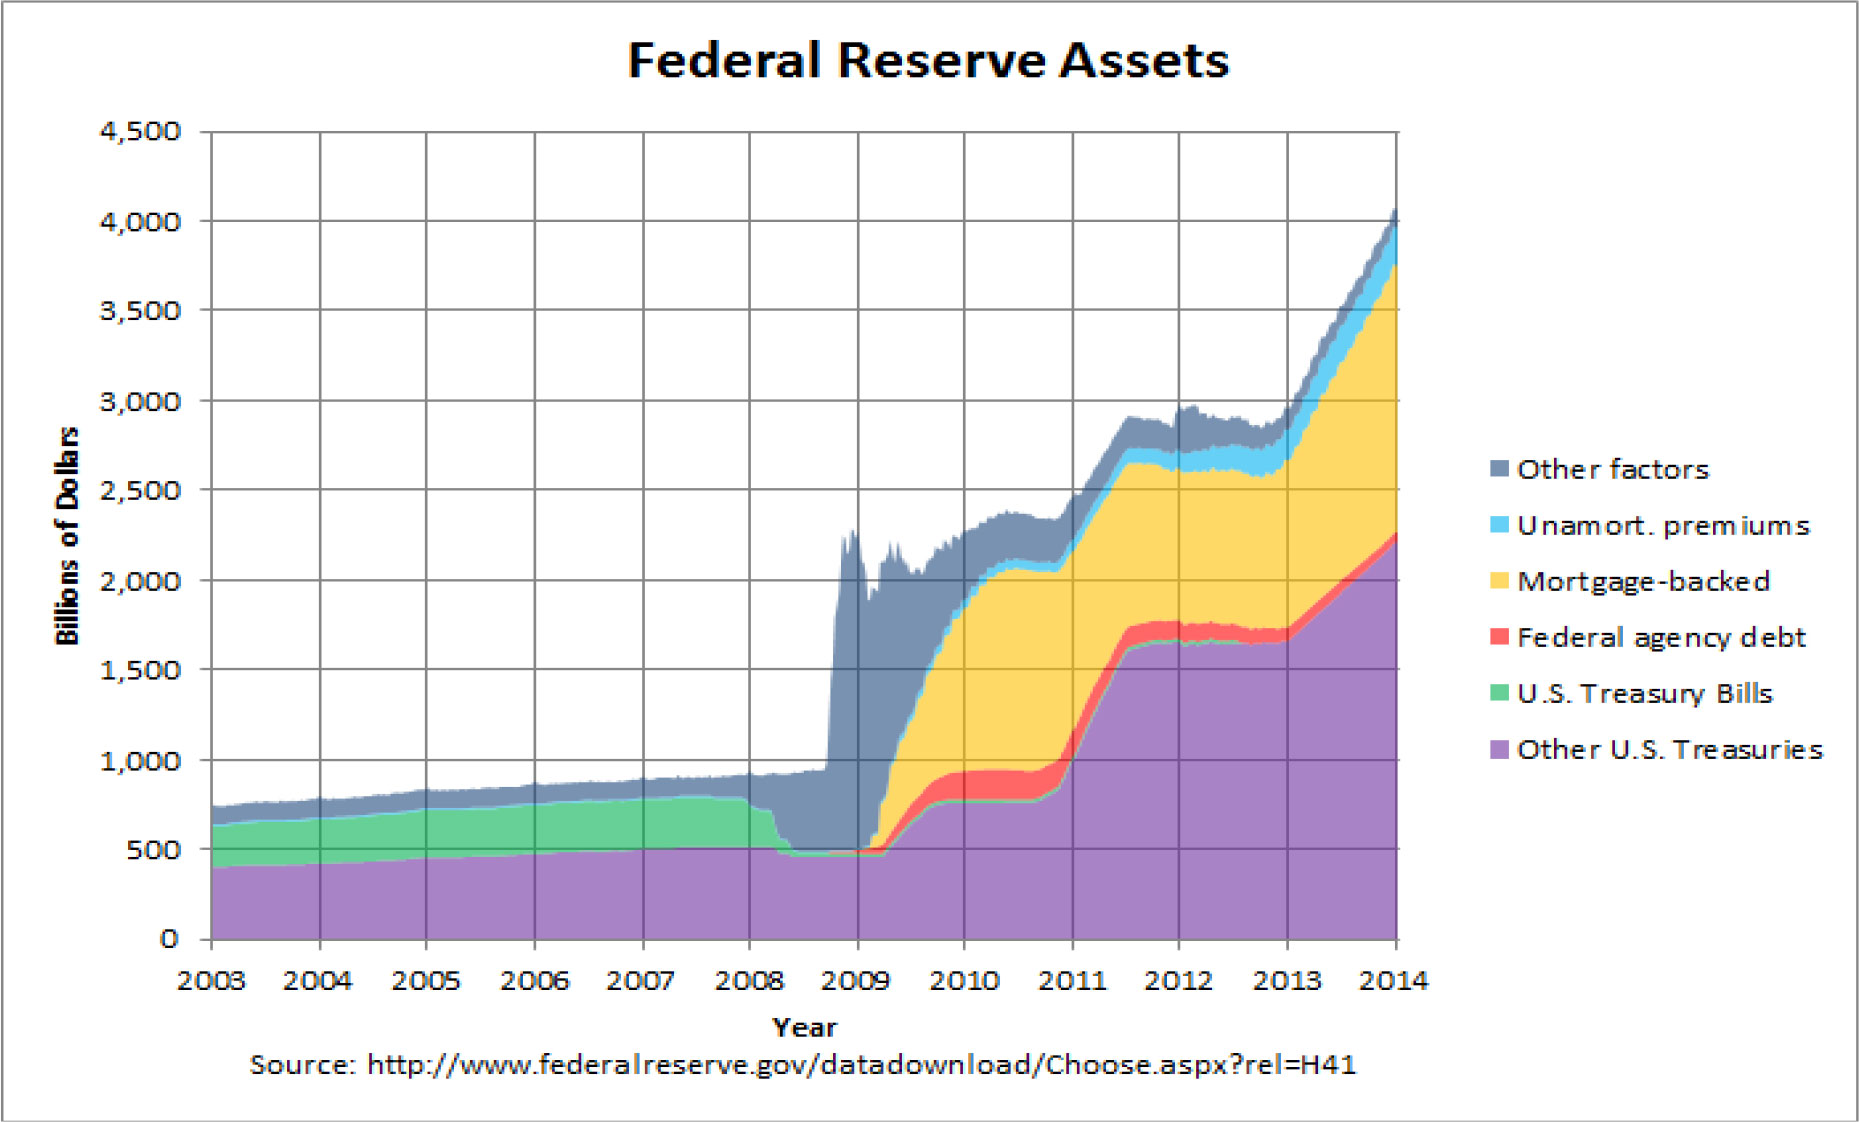
The end of the Bernanke era marks the beginning of the end of an expanding Federal Reserve balance sheet. Since January 30, 2013, the Federal Reserve has increased its balance by $1.095 trillion, and according to the Federal Reserve’s January 30, 2104 Statistical Release7 , its balance sheet is now $4.145 trillion.
The beginning of the Janet Yellon era is to continue the Federal Reserve’s dual statutory mandate to foster maximum employment and price stability. Chairman Yellon is expected to continue the FOMC’s accommodative monetary policy stance. The use of forward guidance will continue to make the Federal Reserve appear transparent about its policy directions while hedging its decision based on real time information on economic and financial developments. For now, a measured reduction in the pace of its asset purchases is likely to continue, and the market expects the QE program will come to an end by the end of 2014. Forward guidance will continue to serve as an important tool to manage expectations and to drive towards the Federal Reserve’s desired outcome. The Federal Reserve needs to make certain that the short term interest rates are near 0% and the 2% inflation target are both well anchored and unyielding by market perception.
Emerging Markets – Dealing with Global Imbalance
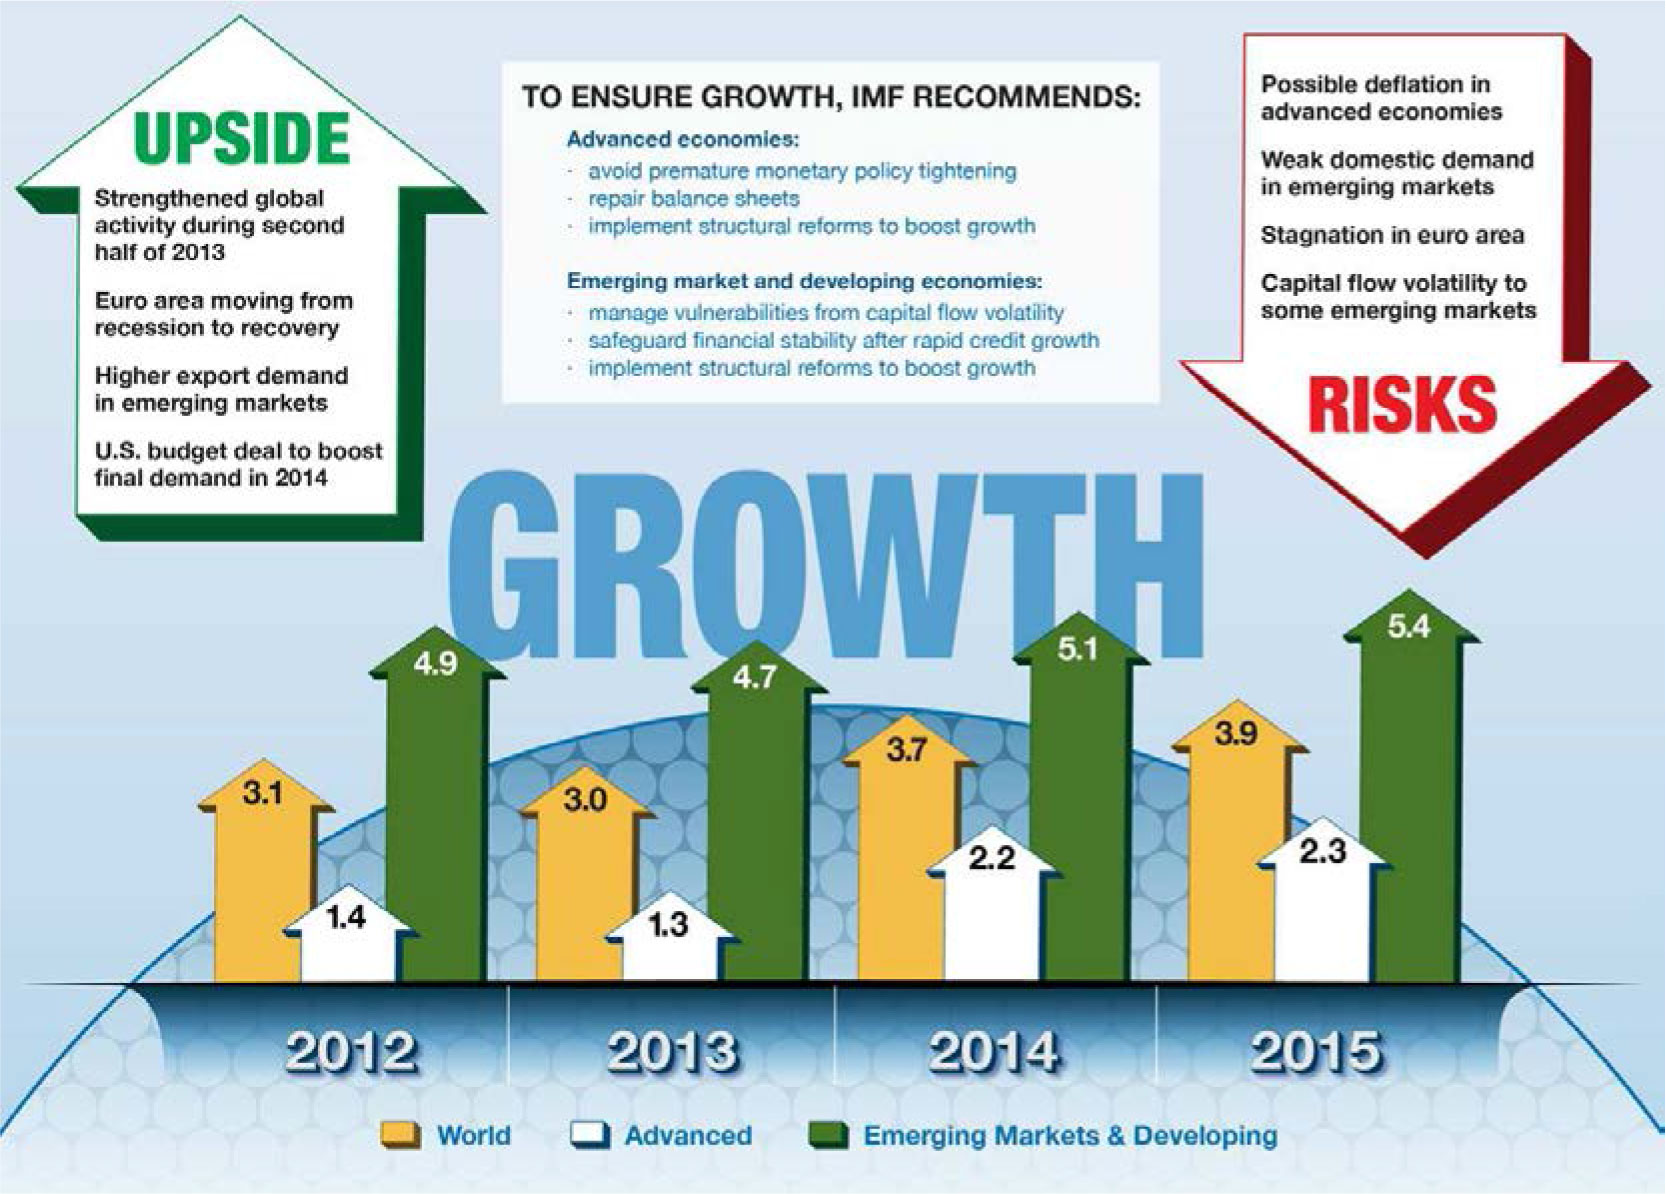
According to the January 2014 International Monetary Fund World Economic Outlook Update8 (IMF Outlook), the multi-speed world is alive and there are upsides and downsides to the global economy.
The prediction is that advance economies, led by the US, will grow faster while emerging markets and developing economies will grow a little less speedily as compared to previous estimates. Almost everyone agrees that a single data point does not define a trend. We suggest that even two data points do not necessarily define a trend in today’s post-financial crisis world of disequilibrium. The final two quarters in 2013 are showing more economic strength, but the second half of each calendar year tends to be more robust than the first half. The entire global recovery scenario is predicated on the stronger export demand from developed economies as they continue to recover or expend from the financial crisis/recession and the gradual structural improvement in emerging markets and developing economies. The US is expected to grow at 2.8% this year (at the lower range of the FOMC December meeting projection) while Europe is expected at 1%. It appears that we are as connected as we have ever been, and there are buyer countries and seller countries. We have seen this imbalance movie before. We are only willing or have the impetus to act when we are forced to do so. If the global structure changes are not made, we will surely repeat our experiences of the past.
The IMF Outlook highlights 4 downside risks:
- Possible Deflation in Advanced Economies
- Weak Domestic Demand in Emerging Markets
- Stagnation in euro area
- Capital flow volatility to some emerging markets.
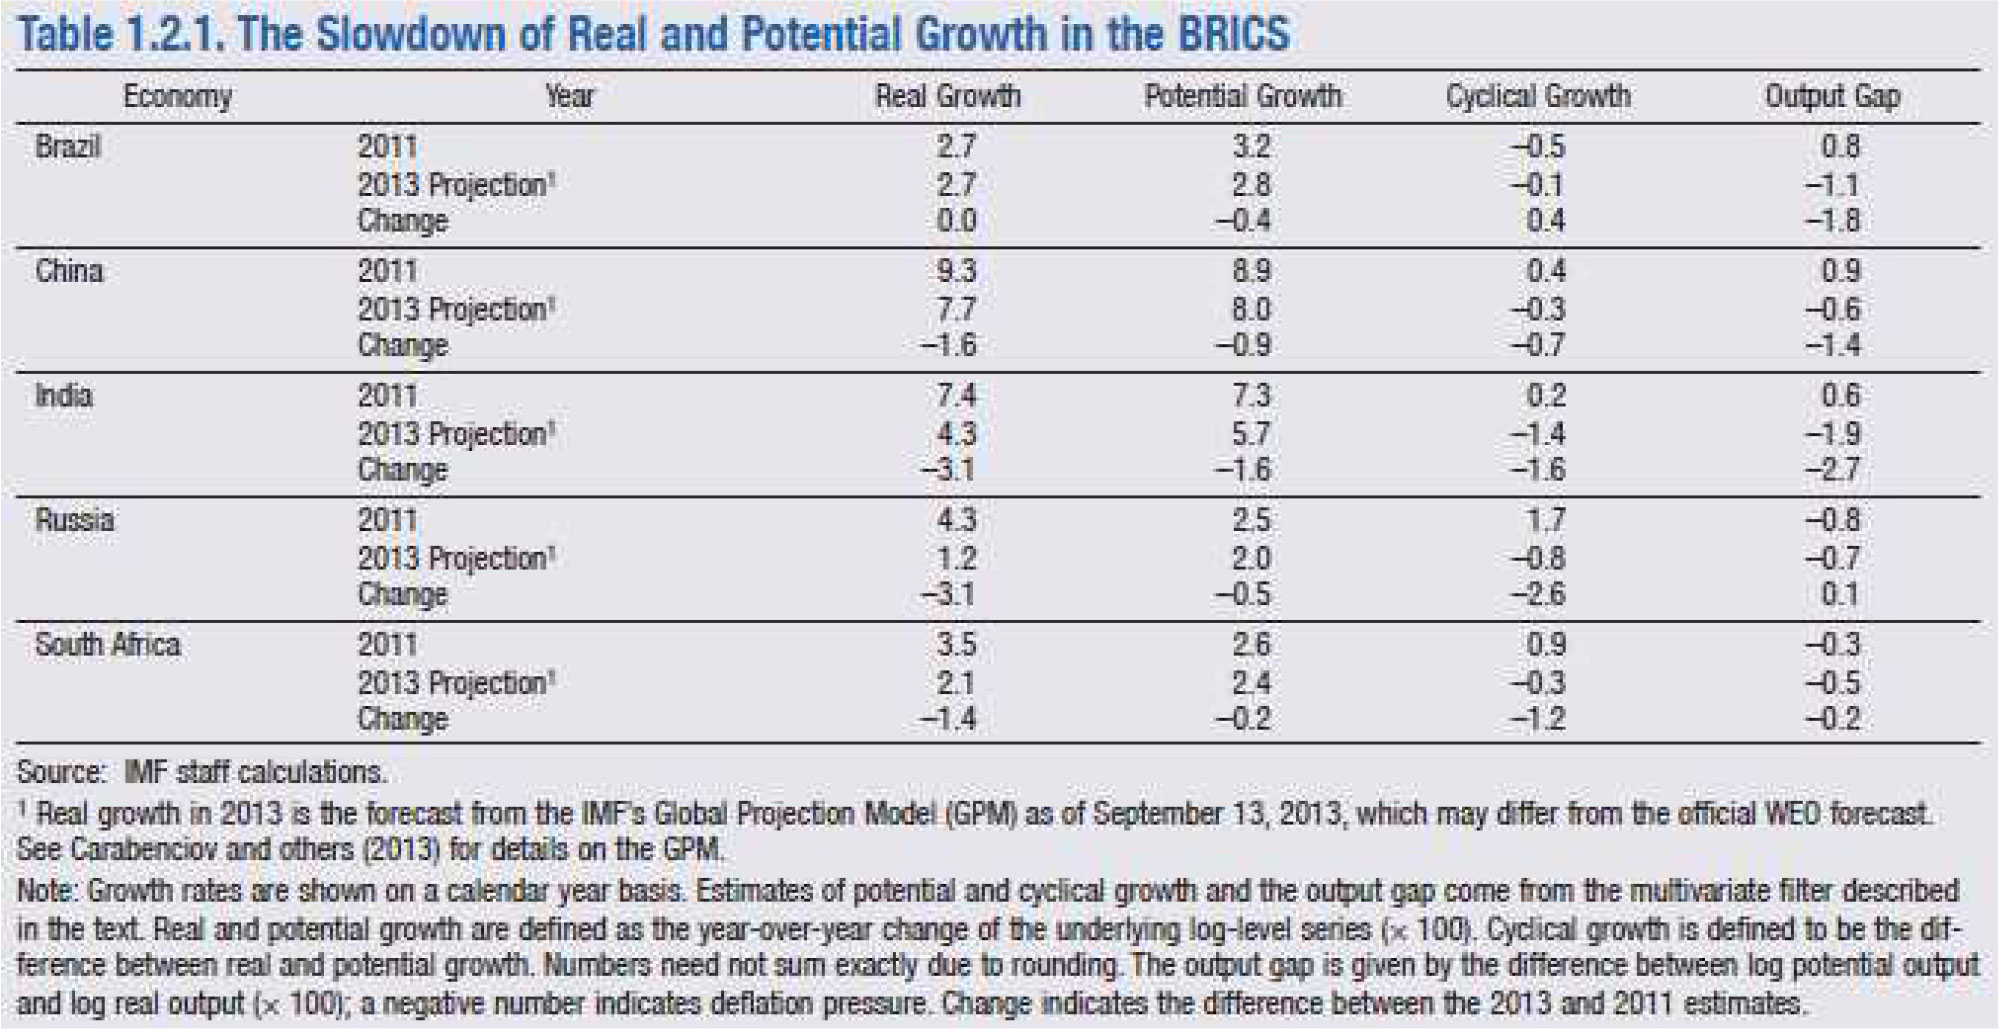
After three massive QEs from the US and QEs from other central banks, the world is saturated with liquidity and investors have been seeking opportunities everywhere for yield and return. Over the past 6 years, the world has grown accustomed to the ever flowing “punch bowl”. Complacency sets in and imbalances become exaggerated with misallocation of capital and asset bubbles. In this section, we will focus on the two risks related to the Emerging Market economies. Brazil, Russia, India, China and South Africa (BRICS) have come to represent the poster child for growth since the term was coined. They are made up of commodity producers and consumers and have created a virtuous trading cycle. Over the past couple of years, the wheels seem to have fallen off as the consuming countries slowed their growth at a much greater rate than the moderate economic deceleration anticipated after the financial crisis. The following table from the October 2013 IMF World Economic Outlook9 shows the change in growth just between 2011 and 2013. This slowdown and the expected continuing economic deceleration have created rippling effects globally.
China, being the second largest economy, has significant influence on the world economy. With its successful fiscal policy to insulate China from the financial crisis, China saw domestic investment reaching 50% and credit equaling 200% of its GDP. This investment and credit led expansion, which contributed to misallocation of capital, growing deterioration of asset quality and financial instability, is obviously not sustainable, and China’s central government has been engineering a “soft” landing for its economy. For the betterment of the long term economy, short term growth must be muted. China is attempting to balance political, social, and financial risks which will likely produce unintended consequences to its neighbors and trading partners globally. At the end, China is interested in raising the standard of living of its citizens and its own status globally. The slowing of China (i.e. weakening demand) will continue to have a rippling effect on commodity producing nations and other partners that have supported China during the over-leverage, infrastructure investment era. The longer term sustainable model for China is to develop and foster a private, consumer-based economy. There is no assurance the orderly transformation will happen or happen within an intermediate term period for this multi-year double digit export juggernaut to morph into a much slower 7 to 7.5% per year growth rate without unintended consequences in China and globally.
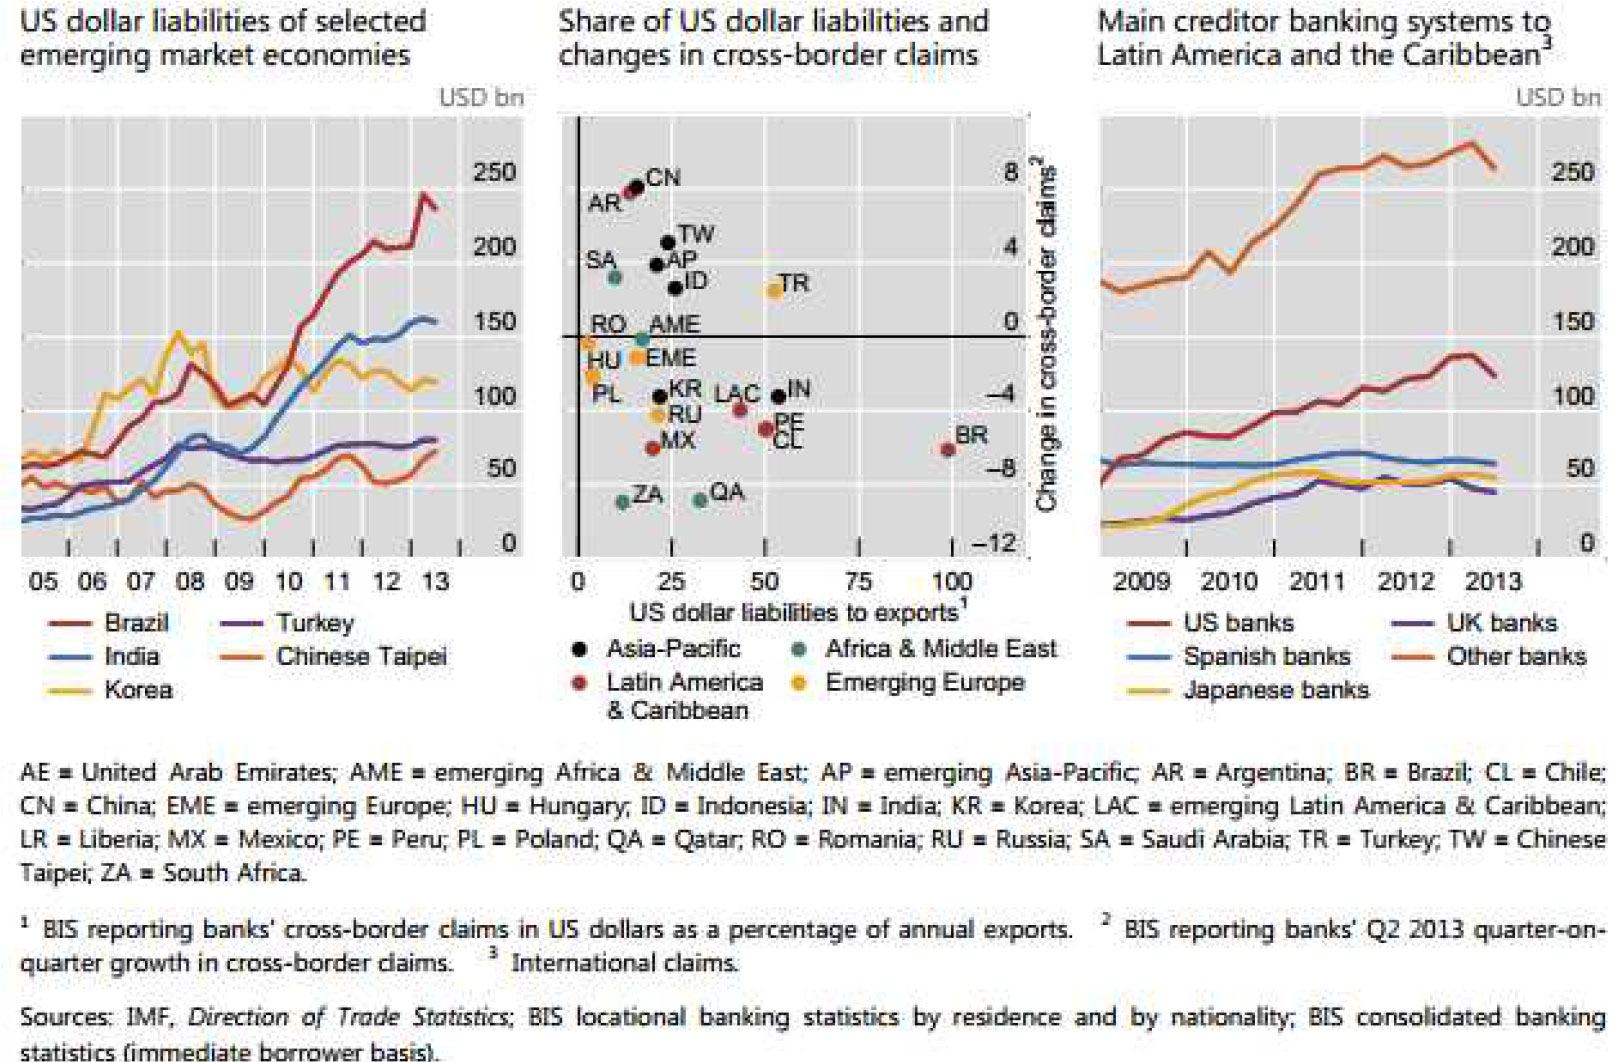
Capital flows to the emerging economies dropped significantly during the financial crisis and again during the euro crisis. Since then, capital flow has returned dramatically. In May, the whisper of tapering by Chairman Bernanke caused an immediate reaction in the emerging markets to the expected tightening in the external financing environment. During the period of extraordinary monetary policy globally (especially in the US), central banks anchored short term interest rates at zero or near zero while expanding their balance sheets by purchasing longer-dated sovereign bonds to place downward pressure on the desired portion of the yield curve. In effect, the central banks are punishing the savings and the income seekers in favor of the borrowers. Savers and investors looked to alternative markets to seek higher returns which boosted capital flow to emerging markets where rates are higher, investing in dollar- or euro-denominated emerging market bonds and subsequently local currency denominated bonds. This insatiable desire for yield has placed upward pressure on their currencies and created financial imbalances. With the trajectory of tighter US monetary policy going forward, US rates are expected to continue to rise and will raise the refinancing costs of US dollar denominated emerging market bonds and, at the same time, create a systematic retreat from local currency denominated bonds. Thus a US monetary tightening has similar or even exaggerated tightening effects in emerging economies carrying large US dollar liabilities or US dollar denominated imports. According to the Bank of International Settlement December 2013 Quarterly Review10 , the cross-border credit to a large number of emerging market economies with sizeable US dollar-denominated liabilities fell in the second quarter of 2013 (Graph A, center panel). Those most affected were located predominantly in Latin America. The drop was largest for Brazil (with a ratio of US dollar liabilities to exports of 99%) but was also quite sharp for Chile (50%), Mexico (20%) and Peru (50%). In other regions, claims on India and Russia contracted as well. In contrast, cross-border credit to Turkey (52%) and several emerging Asian countries increased, most notably to Taiwan and Indonesia.
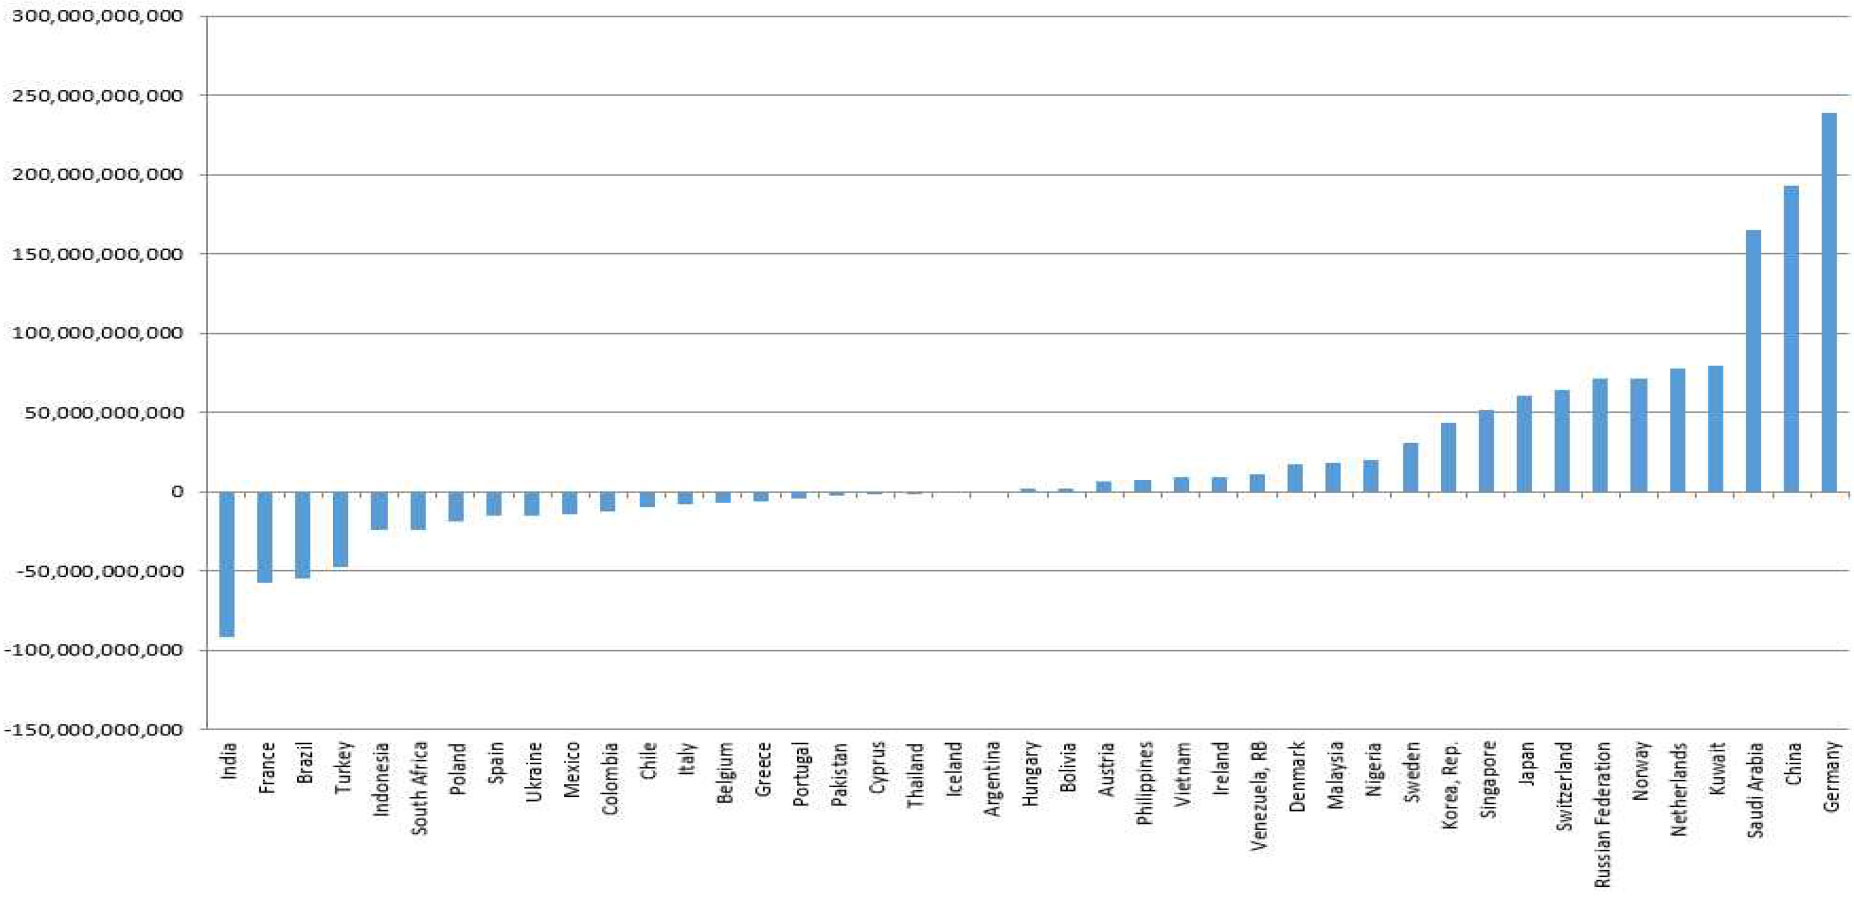
The following is a sample list of countries and their current account positions (deficits and surpluses in US dollars):
Recently, central banks of Brazil, India, Indonesia, South Africa and Turkey have all raised interest rates to stem a depreciating currency and to fight domestic inflation. This is the group of countries with large current account deficits and who rely heavily on foreign capital to finance their economies, but the central bank actions may be insufficient in meeting their desired outcome for long. With the Federal Reserve tapering and US rates on the rise, investors expect a higher real (i.e. inflation adjusted) interest rate in emerging markets to compensate for the risk. The current re-pricing of the market, although painful, is necessary. A part of the current movement is to adjust to a new real rate and risk environment globally. Those countries with substantial external imbalances must attempt to balance a weaker currency and maintain a higher real interest rate. What we should be concerned about is indiscriminately exiting from the emerging markets that could lead to a contagion effect with significant stress to the world economy. On the other hand, raising interest rates significantly to stem capital flight may work, but the cost to the underlying economy can be just as painful.
Although a difficult balancing act, currency depreciation is not an option for those countries that peg their currency to the euro. By being a part of the monetary union, countries in the eurozone gave up their ability to independently adjust their currencies. According to IMF, the peripheral countries of Greece, Spain, Portugal, and Italy can only become more competitive by “1) a fall in the price of non-tradable goods [i.e. non export] with tradable goods [i.e. export] to help reorient domestic production towards tradables and 2) a decline in the price of domestic tradable goods relative to foreign tradable goods to help boost external competiveness and exports.” These none currency debasement approaches can only be attained through outright deflation in these economies, a form of internal currency devaluation (lower wages, lower benefits, and lower standard of living). This is exactly what is transpiring in Greece.
Inflation, Disinflation & Deflation
According to the Federal Reserve Bank of San Francisco11 , the MIT Dictionary of Modern Economics defines deflation as “a sustained fall in the general price level”. Deflation represents the opposite of inflation, which is defined as an increase in the overall price level over a period of time. In contrast, disinflation represents a period when the inflation rate is positive but declining over time. Deflation, inflation, and disinflation represent different behaviors of the price level.
Almost all central banks are at least charged with maintaining price stability. For most, this means keeping inflation expectations in check and controlling forward inflation through monetary policies and tools. Although runaway inflation is devastating, central banks have proven ways to break the back of inflation. However, there are almost no tools in fighting deflation. This is especially true when interest rates are at or near zero and the world is struggling with high unemployment and slow growth. The years of overspending, overbuilding and easy credit were indeed prosperous for producers and consumers. These were borrow-forward years. In other words, they usurped the spending, building and credit of tomorrow for the present. The financial crisis forced the world to reset and adjust. The extraordinary monetary policies helped to stabilize the financial world and the world economy while masking necessary structural reforms and global imbalances and creating new ones.
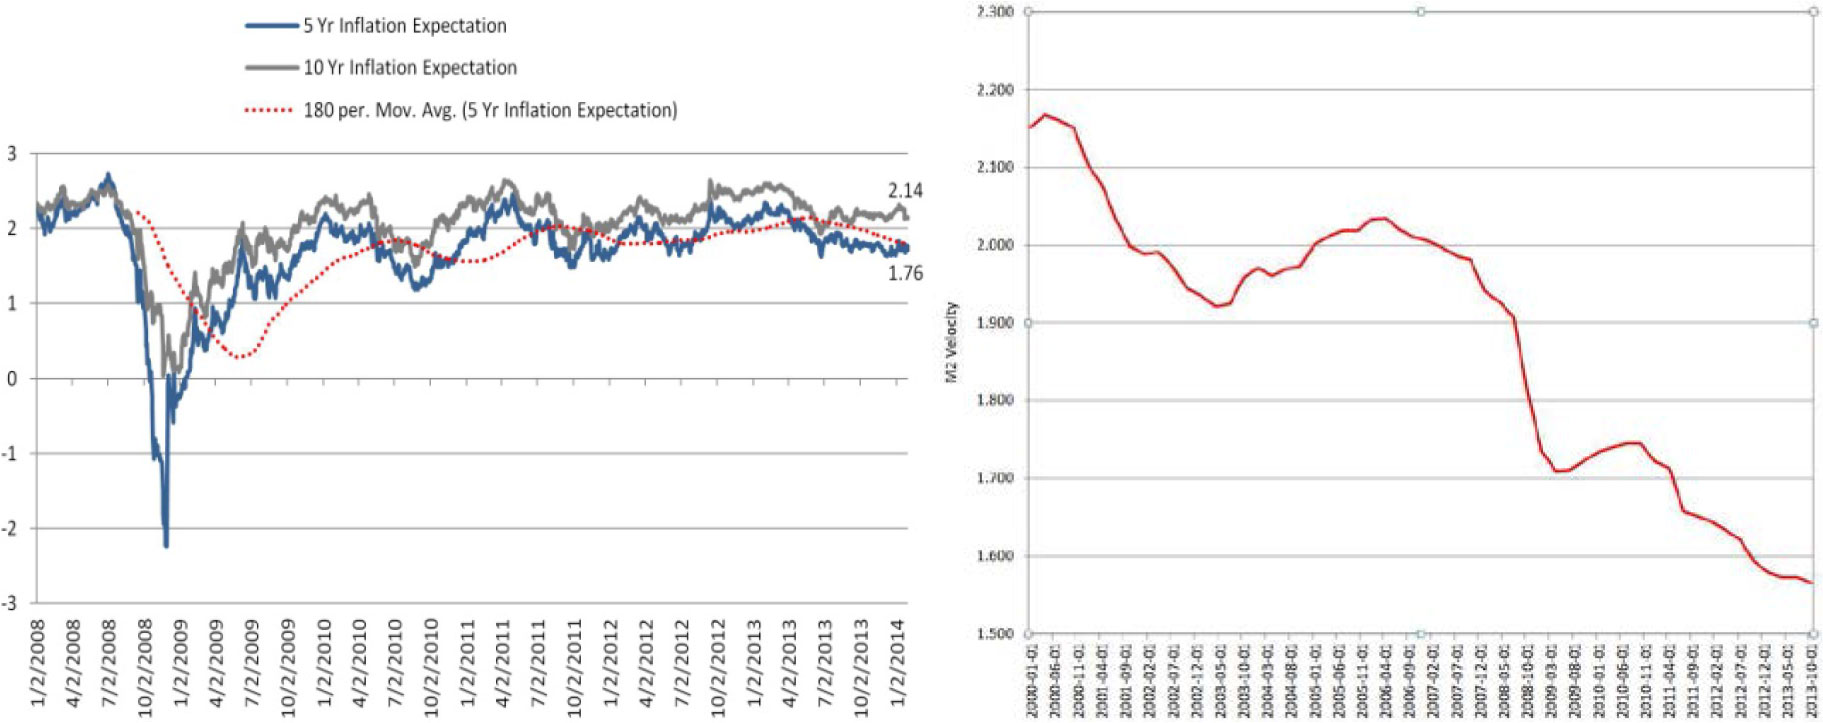
The Federal Reserve has set a 2% inflation target, and the 5 year inflation expectation continues to fall below the 2% target since 2013. The following graph illustrates the forward looking breakeven inflation rate (BEI) which plots the difference betweennominal 5 and 10 year US treasuries and real yields (i.e. Treasury Inflation Protected Securities, TIPS) of the same maturity.
BEI is viewed as the compensation required by investors in nominal bonds for being exposed to inflation and uncertainty about inflation (inflation risk). This is occurring during the period where the Federal Reserve balance sheet expanded from below $1 trillion to over $4 trillion since the financial crisis. The lack of velocity of money is evidenced by the fact that the majority of the newly minted dollars remains at the Federal Reserve and not in the hands of the private sector. The above right chart shows the velocity of money for M212 (cash, checking account deposits, savings accounts and money market accounts). The velocity of money is the frequency at which one unit of currency is used to purchase domestically-produced goods and services within a given time period. In other words, it is the number of times one dollar is spent to buy goods and services per unit of time. If the velocity of money is increasing, then more transactions are occurring between individuals in an economy. Until we see an increase in the velocity of money, inflation is not a concern, but this also means that aggregate demand is not optimal either. Of course, over time as the economy continues to heal and expand with: 1) higher confidence about the economy, 2) reduced policy risks and uncertainty, 3) more relaxed lending standards, 4) consumers gaining capacity and willingness to spend, and 5) private sectors willing to take risk and invest, the velocity of money will turn and inflation will come back. The Federal Reserve is concerned that, if its current balance sheet continues to expand, it would be very difficult to control inflation when the economy heats up. It is with prudence that they begin to taper currently. However, if this tapering is happening too soon and the private sector handoff is not successful or creates unintended consequences globally that impact our economy, price stability risk due to inflation would remain a non-issue.
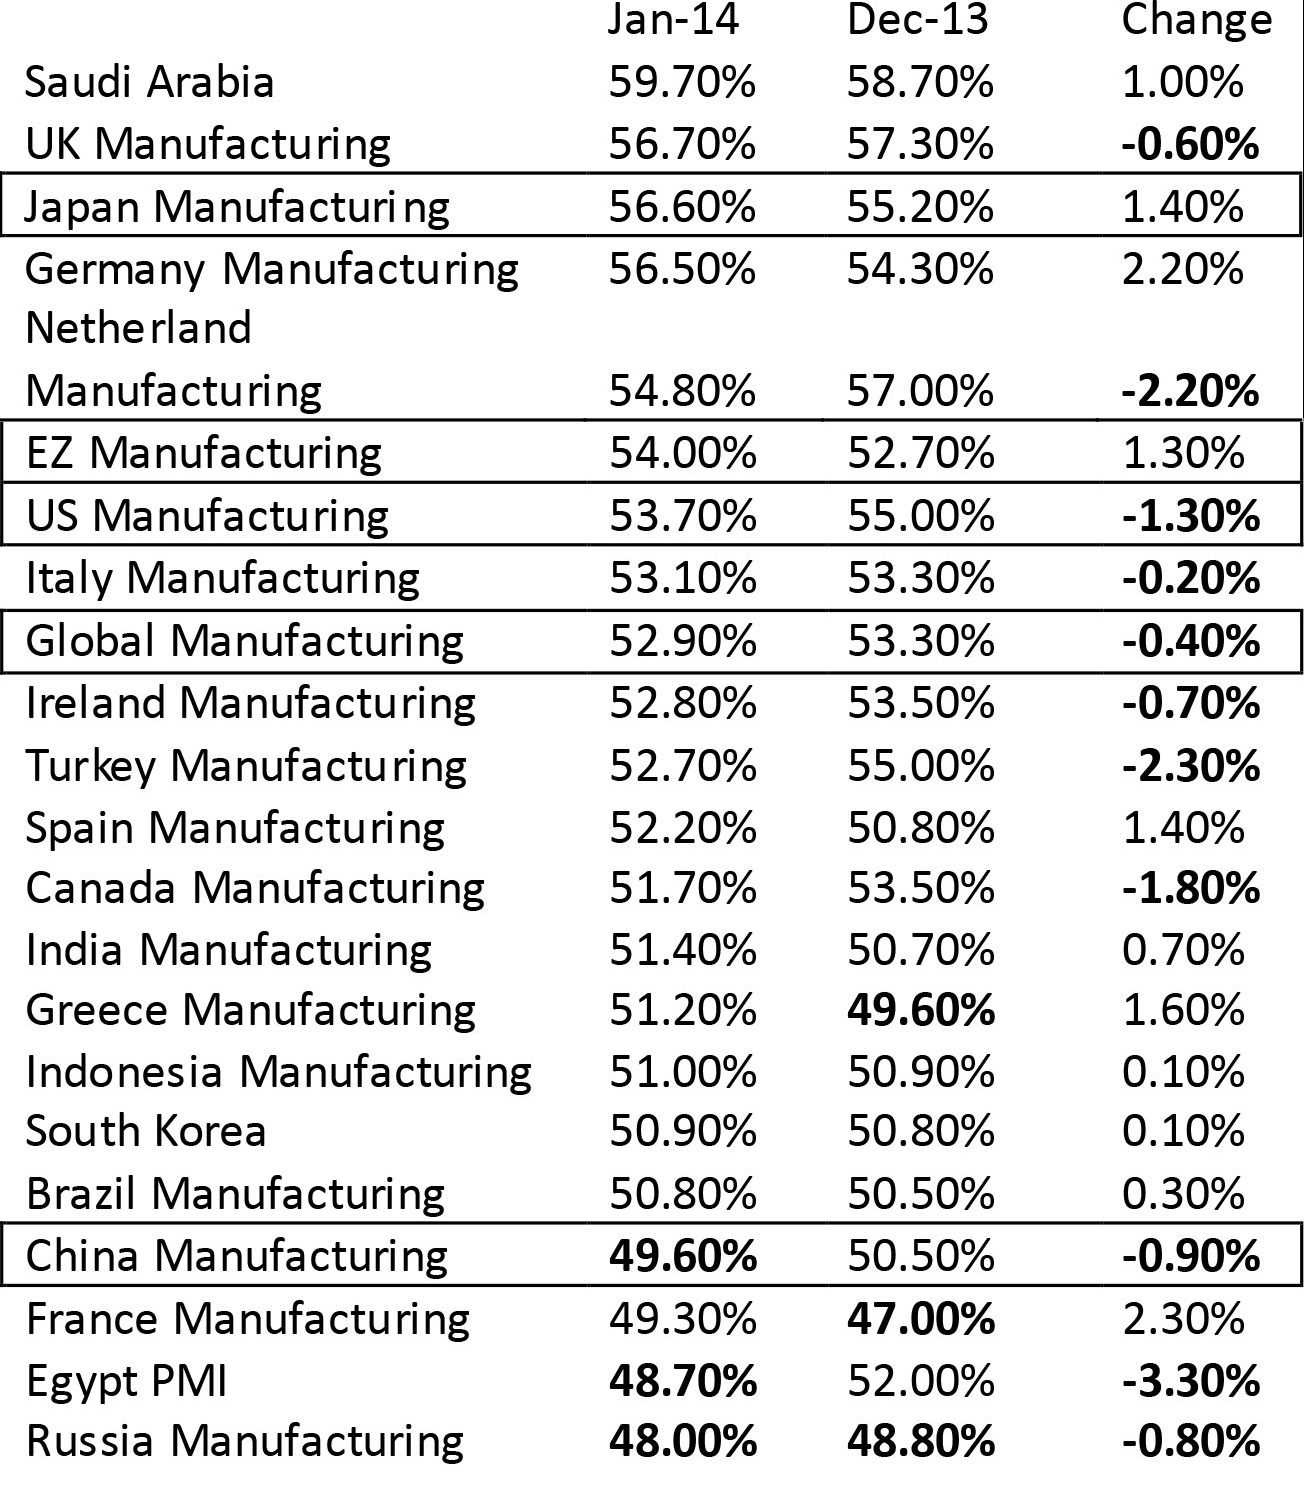
According the Markit Financial Information Services data, the following is a sample of Purchasing Manager Index (PMI) for a sample of economies for December 2013 and January 2014.
Over the two data points, it appears that the eurozone continues to recover from its recession and demonstrates strength in its manufacturing sector. Japan is also showing a positive manufacturing trend and shows the power of continuing currency devaluation in that country. What is troubling is the contraction in China manufacturing (contraction is a value below 50) and the unexpected slowing in US manufacturing.
There are a couple of forces that shape deflation and recession. The first is from the producing countries where capacity is underutilized – a case of over manufacturing capacity and infrastructure. Further, with increase in productivity, much of the misallocated assets (labor, infrastructure and equipment) will either permanently be displaced or will take a long time to be reabsorbed. The second is a lack of demand from the consuming economy. With a high and prolonged structural unemployment in the consuming economies of the developed world and the tepid and extended economic recovery cycle, escape velocity has not been reached and animal spirit is not found. This degrades aggregate demand and leads to lower consumer rates.
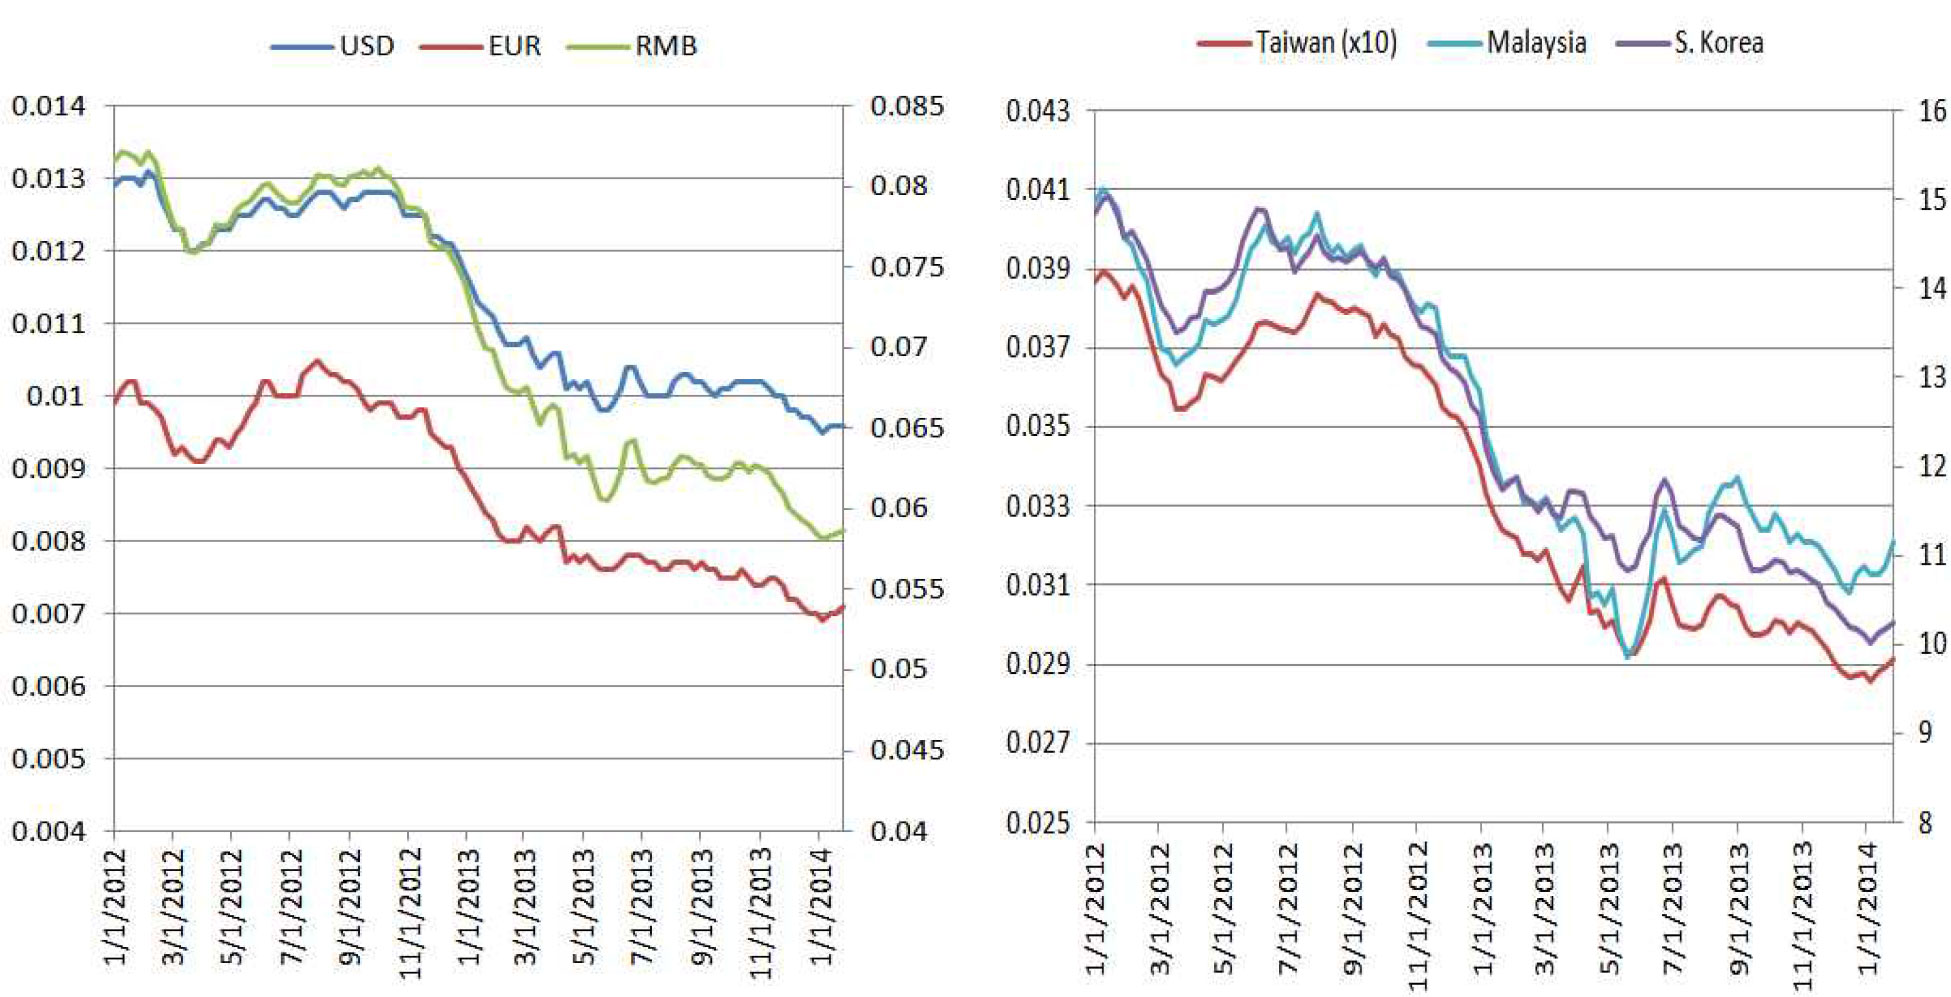
After two decades of slow growth and deflation in Japan, the newly elected prime Shinzo Abe introduced the now famous “three arrows” in an effort to revive the Japanese economy: 1) a massive fiscal stimulus, 2) aggressive monetary easing from the Bank of Japan, and 3) structural reforms to boost Japan’s competitiveness. By the end of February last year, the yen had depreciated 22% and its stock market skyrocketed. The Japan’s central bank also followed the US Federal reserve in setting an inflation target of 2%. Abenomics intends to import inflation and export deflation, and since then, we have witnessed an increase in Japanese export and domestic inflation. The following are charts showing the yen depreciation against a number of trading partners:
This is probably welcomed news to consumers of Japanese products, but this pricing advantage could be viewed as an unfair global competitive advantage. Theeurozone, where the collective economy is barely out of a recession, and countries looking to create their own export advantage will likely find the Japanese currency intolerable over time. In Asia, where Japanese trading partners are also competitors, one will also find a significantly cheaper yen is not a sustainable currency exchange rate. Unless growth and aggregate demand comes back in a meaningful way (growth is the cure for all ills) it is plausible that there will be a series of currency devaluations to minimize the unfair trade advantage. The base case is that the disinflation wind is blowing, and if we are not careful, more countries will be facing deflation within the next few years.
Conclusion
The US led the world into the Great Recession resulting from the burst of the financial bubble. The depth and severity of the crisis can be traced to the structural and financial imbalances globally and the excessive and perhaps irresponsible use of debt and leverage. Global deleveraging and fiscal tightening were natural responses, and we went through a near disintegration of the European monetary union (EMU) and the euro. Advanced economies (a.k.a. developed economies or high income countries) with the highest level of debts contracted while developing economies (a.k.a. emerging markets or low income countries) slowed. Rich countries in the developed world are deemed to be the poor heavily indebted economies as compared to poor countries in the developing world that were deemed to be the rich lender economies. However, the idea that developing economies will continue to prosper and decouple from the developed economies vanished quickly as consumption and economic activities plummeted. After a massive infusion of cash resulting from fiscal policies stabilizing the world economy from falling into a depression, unprecedented monetary policy by central banks globally was enacted to provide the confidence and liquidity to sustain the fragile recovery. The balancing act between fiscal and monetary policies continues till today.
Although we are now in a multi-speed world, the economic acceleration rates are beginning to converge with the US expected to lead the way for developed economies. Europe is barely out of a multi-year recession and is not expected to have much growth, and much of the sovereign debt and banking problems that almost brought the eurozone to implosion remain unresolved. Emerging markets and the developing economies continue to slow and adjust to structural issues and global imbalances. The saving grace is that these economies are typically in a higher interest rate environment and have sovereignty over their own currencies that allows them policy options. Unlike the EMU, these developing and emerging countries can take action over time to drive down their exchange rates and attempt to drive up export along the way to build a more sustainable domestic consumer based economy. Globally, growth remains elusive and governments are all looking to export their way back into prosperity. Moreover, for some countries (e.g. Japan), by depreciating their currencies and making their exports immediately more competitive would import inflation that would likely lead to stronger economic activities. This reminds me of homeowners who blow their leaves away from their residences. They believe that as long as the dead leaves and debris are out of sight, they have a clean front yard. This may be true for the first few homeowners in the neighborhood. But if every homeowner yanks out their leaf blower and pushes their dead leaves and debris away from their front doors to their neighbors without picking them up, all of them are simply trading dead leaves and debris, i.e. a kind of zero sum gain. Thus for emerging market economies, driving domestic consumption and transforming from an infrastructure construction and/or export dependent manufacturing based economy are critical to bringing global economy into a sustainable equilibrium. This type of change requires more than just recognition. Successful transformation will likely take multi years if not decades. At the same time, global demographic shifts will add further pressure on consumption since the multiplier effect and duration for each dollar in old age consumption is much different than for household formation segment of the population.
As always, what goes on in the economy can often decouple from the financial markets. We all live in today’s economy but invest in tomorrow’s economy. As such, all the rational thoughts and sequencing regarding the economy and economic activities globally may have little to no influence on financial markets in the short run. Economists, policy makers and financial market observers talk about process and investors care only about outcome. For 2014:
- Although we are guardedly positive regarding the US economy, we do not expect a repeat of the last year’s equity market performance. The single detractor is beginning to the end of QE.
- On a relative basis, equity prices in developed Europe, especially core countries, are considered better value than in the US and Japan. If ECB initiates more QE like activities in a meaningful way to offset banking rule driven liquidity issues and to stay ahead of deflation or a return to recession, European equities should perform well (potentially tracing the 2011 through 2013 US equity market experience.)
- The US dollar should remain strong if we continue the economic expansion in a meaningful way and the Federal Reserve continues to taper as compared to Europe, Japan, commodity producers, and export driven emerging market currencies.
- If consumer and corporate confidence continues to rise (or not fall), the much awaited capital expenditure by corporations is expected to be realized and further drive the economic expansion. As such, it is logical to favor industry sectors of basic materials and IT/technology.
- After years of corporations meeting and exceeding their “bottom line” through increasing productivity (code word for laying off workers and replacing them with technology) and cutting cost while increasing their share value through increasing dividends and initiating stock buybacks, generating “top line” revenue is now more urgent. As such, mergers and acquisitions (M&A) are the next logical step for revenue growth. Small to mid-size companies are the likely targets for M&A.
- With little to no inflation pressure in a disinflationary world of overcapacity and tapered demand, commodities and inflation sensitive assets should remain under pressure.
- The overall low volatility environment last year is an exception and should not be considered a new investment reality. As such, going forward, “normal” risk levels for equity markets should return as the extraordinary monetary support in the US is gradually removed. Although we hope and pray (not an investment strategy, of course) that the hand off will finally be successful and smooth from the sovereign (public) to the consumer (private), this is not assured and can be quite jagged. Taking steps to protect a portfolio’s downside is only prudent – diversify.
- Emerging markets cannot be thought of as a single market. Instead, differentiating those with low debt and who are not foreign investments dependent from the rest makes sense. Nonetheless, we expect continuing market volatility as the world resets itself once again.
Although we no longer live in a unipolar world of America, the world once again looks to and relies on the American economic engine as the locomotive for global growth and stability. At the end, it is all about American confidence led consumerism that will drive commerce globally. There seems to be many positive signs and expectations for the US at the beginning of this year. One important sign is the significant reduction in policy uncertainty (although mid-term elections may introduce extreme rhetoric and headline risks). In the past three years, the perceived and unquantifiable risks associated with repeated debt ceiling debates, fiscal cliff/sequestration, potential US default, and the lack of a permanent budget have all contributed to uncertainty for investment in the US and spilled over globally. Ultimately this held back economic activities with corporations holding on to unprecedented amounts of cash instead of reinvesting for their future. After the failed government shutdown engineered by the Republican Party to gain concession from the Obama Administration, there is little to no appetite for any more “fights” in Congress. In this new year of the horse, we hope and pray that the US will demonstrate the escape velocity to provide the economic leadership that the world seeks.
This quarterly commentary is strictly informational and should not be perceived as Chao & Company, Ltd. providing investment consulting or advice. Readers should not rely on any portion of this content in making any investment or financial related decisions.
- http://www.bea.gov/newsreleases/national/gdp/gdpnewsrelease.htm
- 2013-q4-Survey-of-Consumer-Attitudes.pdf
- Calculated by dividing the current month’s estimates of aggregate weekly payrolls by the corresponding 2002 annual average aggregate weekly payrolls. Aggregate payrolls estimates are the product of estimates of average hourly earnings, average weekly hours, and employment.
- Calculated by dividing the current month’s estimates of aggregate hours by the corresponding 2002 annual average aggregate hours. Aggregate hours estimates are the product of estimates of average weekly hours and employment
- http://www.bls.gov/news.release/empsit.t12.htm
- The central tendency excludes the three highest and three lowest projections for each variable in each year.
http://www.federalreserve.gov/monetarypolicy/files/fomcminutes20131218.pdf - http://www.federalreserve.gov/releases/h41/current/
- http://www.imf.org/external/pubs/ft/weo/2014/update/01/pdf/0114.pdf
- http://www.imf.org/external/pubs/ft/weo/2013/02/pdf/text.pdf
- http://www.bis.org/publ/qtrpdf/r_qt1312.pdf
- http://www.frbsf.org/education/publications/doctor-econ/1999/september/deflation-disinflation-causes
- http://research.stlouisfed.org/fred2/series/M2V?cid=32242
