Is it the Year of The Dragon or Year of the Groundhog?
We expect 2012, the Chinese year of the dragon, to be a continuation of 2011; substantial and significant risks and uncertainty remain. The tight linkage among governments, banks and financial markets will continue to drive market volatility which we had a good dose of last year. When the European sovereign debt crisis first started, the discussion was limited to PIIGS. The differentiation was clearly the European core vis-a-vis the European fringe. After over 3-years of “kicking the can down the road” policies, the eurozone financial stratification is moving to core, soft core, peripheral and Greece. There has been a systematic erosion of financial confidence, even within the core of Europe. Case in point is the recent downgrade of France sovereign debt, among other countries. The longer the eurozone is not implementing the obvious and well publicized tough actions, the greater the cost and damage going forward in putting Humpty Dumpty back together again. The expectation of economically growing their way out of the excessive sovereign debt simultaneously with implementing significant austerity is diametrically opposed. The process of “can kicking” to permit the eurozone to buy enough time to grow out of its fiscal troubles is based on false hope and bad policy. The eurozone is in a recession, and the periphery will remain in a recession for some time. In fact, Greece has just entered its fifth consecutive year of deep recession. The World Bank lowered its global economic growth forecast for 2012 to 2.5% versus the 3.6 % projected just in June last year, pointing to European financial turmoil and weakening growth prospects in emerging markets as the major contributors.
A Quick Look Back
After a topsy-turvy roller coaster ride of a global financial market in 2011, the U.S. is one of the few markets that ended the year without a loss. On a price basis, the S&P 500 Index ended exactly where the year started, and on a total return basis, the S&P 500 returned 2.11%. This does not tell the story of a very difficult and nowhere to hide 2011. The solid market gains during the first 5 months of the year were totally wiped out and gave way to a significant downturn in the second half of the year before returning to where we started.
As illustrated below, the violent movement of the S&P 500 has been spectacular.
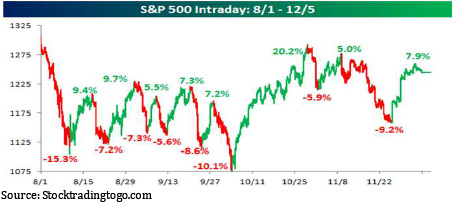
The market has been held hostage to global macro events primarily by the eurozone sovereign debt crisis. Wave after wave of bad news from around the world plus the downgrade of the U.S. sovereign debt rating by S&P and the failure of the Super Committee to agree on the U.S. debt ceiling issue further contributed to uncertainty in the markets.
The decoupling of the developed and the developing economies did not materialize as some have expected at the end of the Great Recession. There is no question that the developing economies are the growth engines of the world and represent the lion’s share of the world GDP. It is without dispute that the three largest developed economies of the U.S., the

eurozone and Japan are overleveraged, overbuilt, overspent, over-committed and will take a decade or more to recover, but the export-driven economies of the emerging world have not grown their domestic economies with diversity and sufficiency to absorb the retreating export revenue. The slowdown in the dominating advanced economies led to closing of factories in the emerging markets, loosening fiscal and monetary policies and softening demand for commodities worldwide, which further impacted commodity producing countries. This cascading effect produced one of the worst equity performing years for the emerging market as a whole. The previous graph ranks the MSCI country indexes from the highest return to the lowest for 2011. With the exception of Indonesia, which returned 4%, all other equity markets lost value, on a dollar basis. In fact, diversifying away from the U.S. or getting out of developing economies and moving into emerging markets produces the opposite effect. The slowdown in the developed markets has a direct impact on the emerging markets. Investing in emerging markets contributed negatively to portfolio performance last year. The world was concerned with the negative feedback loop that would create a synchronized global slowdown and drag every economy down further. This has not been true for oil prices. Thanks primarily to political uncertainty in many of the oil producing regions, oil prices have trended higher.
To put the rest of the investment world into perspective, the following chart provides a 2011 return summary of other investments.

The best performing sectors, according to the Reuter 2011 data, are highest quality assets or flight-to-safety assets. At the beginning of 2011, the market was concerned about rising interest rates as the U.S. economy seemed to be finally demonstrating some positive momentum. Investors shied away from US Treasuries expecting the
Federal Reserve to start talking up interest rates and normalize the yield curve. The U.S. economy took a decided downturn in the third quarter and the increasing likelihood of a major eurozone credit event, safety and return of (instead of on) capital became the dominant theme. High (credit) quality, fixed income instruments benefited along with safe heaven currencies and instruments denominated in such currencies, such as the Swiss franc, the U.S. dollar and the Japanese yen. The following trailing 1 year gold prices further illustrate the story of the risk-on and risk-off environment last year, an almost mirror image of the S&P 500 after the second quarter.

Asset allocation tends to be an insufficient and ineffective strategy to diversify portfolio risk under this environment. Although the long term macroeconomic direction may seem clear at times, short-term market reactions to macro events remain unpredictable. Investment allocations that seemed reasonable and well thought out at the time were stripped of all benefits when risk aversion stepped in. Global systemic risks were too great to be diversifiable by traditional means. When extreme fear took over, all bets were off.
World 2012
The multi speed world is alive and well. Except the speed for all regions continue to be revised downwards. Although the developing economies and emerging markets remain the growth engines of the world, the fiscal problems in the advanced economies are pulling them downward. Our base case for 2012 is the world will not experience a double dip recession with the US leading the way among the largest advanced economies through another year of a long run sub-par GDP growth. If the eurozone sovereign debt problem is not contained due to an unstructured Greek default or a loss of creditor confidence in the soft core or other periphery countries due to the inability of the eurozone leaders and super-sovereigns to take the needed actions, the fallout can be very serious and severe. The contagion effect will hit the banking system which serves as the transmission vehicle infecting the rest of the world economies. Freezing up of the banking system will bring the world into another recession. The following table containing the historic and projected GDP contribution by different countries and regions of the world has been prepared by The Conference Board’s Global Economic Outlook 2012.

Three observations jump out:: 1) the world GDP continues to shrink (3.9% to 3.5%); 2) the Advanced Economies will be even a smaller contributor than in the past (at 0.7% of the total 3.5%) to world growth even though the EM and Developing Markets also continue to slow (2.8% for 2012 as compared to 3.0% for 2011); and 3) the U.S. is expected to be the largest contributor to world GDP among advanced economies while the eurozone is expected to fall dramatically from1.4% to 0.2%. The following graph shows the historical trend from 1996 through 2011, and it is clear that the Advanced Economies, as a group, are representing a shrinking portion of the world GDP.

United States in 2012
The talk of a double dip recession in the U.S. has vanished as the economy continues to reverse its course from the first quarter of 2011. The latest quarterly result is respectable in today’s New Normal economy, but it came in less than the consensus of economists who expected a 3.2% GDP level for the fourth quarter. The main contributor to this increase is the $56 billion rebuilding of inventory by private businesses. We also know that consumers did spend more money during the holiday season – up to a 2% annual rate from 1.7% in the prior quarter. However, much of this came from their savings, and this is obviously unsustainable. For the year, U.S. GDP increased by 1.7% as compared to 3% in 2010.

Another important economic measure is the employment rate. The economy added 200,000 jobs in December (private sector added 212,000 while public sector shed 12,000). The Great Recession removed 8.7 million jobs and, according to the Department of Labor, the 6 months prior to 2012 is the strongest for job creation since 2006. Now the U3 unemployment rate stands at 8.5%, the lowest since February 2009. For 2011, 1.6 million jobs were added as compared to 940,000 during 2010 and a loss of 5 million during 2009.

- U-1 = Persons unemployed 15 weeks or longer
- U-2 = Job losers and persons who completed temporary jobs
- U-3 = Total unemployed
- U-4 = Total unemployed + discouraged workers
- U-5 = Total unemployed + discouraged workers + all other marginally attached workers
- U-6 = U5 + total employed part-time for economic reasons
The U1 through U6 data reported by the Bureau of Labor Statistics represents one set of statistics with U3 being the most often referenced gauge for unemployment in the U.S. Unemployment statistics basically divide the number of people unemployed by the total employment population. Using the employment-to-population ratio of 25 to 54-year-olds (this represents the most stable and largest portion of the workforce), the employment picture has hardly changed since the significant plunge that occurred during the Great Recession. Since August 2009, the employment-to-population ratio has hovered around 75 million on average. This means that the decline in the unemployment rate from 10% to the latest 8.5% has not been the result of more employment but is primarily due to people leaving the labor force (the denominator is getting smaller).

Below is a portion of the statement the Fed released on January 25, 2011 after its FOMC policy meeting (emphasis added):
“Consistent with its statutory mandate, the Committee seeks to foster maximum employment and price stability. The Committee expects economic growth over coming quarters to be modest and consequently anticipates that the unemployment rate will decline only gradually toward levels that the Committee judges to be consistent with its dual mandate.
Strains in global financial markets continue to pose significant downside risks to the economic outlook. The Committee also anticipates that over coming quarters, inflation will run at levels at or below those consistent with the Committee’s dual mandate.
To support a stronger economic recovery and to help ensure that inflation, over time, is at levels consistent with the dual mandate, the Committee expects to maintain a highly accommodative stance for monetary policy.In particular, the Committee decided today to keep the target range for the federal funds rate at 0 to 1/4 percent and currently anticipates that economic conditions–including low rates of resource utilization and a subdued outlook for inflation over the medium run–are likely to warrant exceptionally low levels for the federal funds rate at least through late 2014.
The Committee also decided to continue its program to extend the average maturity of its holdings of securities as announced in September. The Committee is maintaining its existing policies of reinvesting principal payments from its holdings of agency debt and agency mortgage-backed securities in agency mortgage-backed securities and of rolling over maturing Treasury securities at auction.”
This statement clearly reveals the concerns of the Federal Reserve. Even with an improving GDP and employment numbers of late, the FOMC is concerned with the fragility of the recovery and the severe global macro risks that are omnipresent. With the exception of the extension of the exceptionally low interest rate policy through late 2014 (adding another 15 months from the last statement), the basic policy of keeping interest rates low along the yield curve remains intact. Operation Twist, the process of selling $400 billion in short-term Treasuries in exchange for the same amount of longer dated bonds, is continuing through June along with reinvesting principal repayments from debts the Fed holds back into mortgages and Treasury securities. This remains Quantitative Easing (QE) 2.5 and not a new large scale asset purchase program or QE3.
Additionally, the FMOC released a statement of longer-run goals stating that “[t]he inflation rate over the longer run is primarily determined by monetary policy, and hence the Committee has the ability to specify a longer-run goal for inflation. The Committee judges that inflation at the rate of 2 percent, as measured by the annual change in the price index for personal consumption expenditures, is most consistent over the longer run with the Federal Reserve’s statutory mandate.” This points to the Fed’s lingering concern about deflation. The combination of a weak economy bumping along at the bottom and a possibility of falling back into a recession leaves the door open for QE3. Since the announcement, the yield curve has moved significantly. The following chart illustrates the movement of the yields from the day before the announcement to two days after.

The Fed will maintain an exceptionally accommodative interest rate policy on the short end of the yield curve with its finger on the QE3 button. In this extraordinarily uncertain time, the Fed continues to make investors uneasy, investing in low risk assets and in the hope of investors and savers venture out of their comfort zone and up the risk ladder to seek a better return. Further, by keeping short terms rates uncomfortably low, the Fed is hoping banks will lend and citizens and companies will borrow more to drive economic recovery.
Europe 2012
Last quarter we discussed in great details how the eurozone sovereign debt-liquidity-banking crisis started and how challenging it is for 17 counties which share a common currency to agree to a sustainable solution. The desire to remain as a monetary union is both political and financial, and eurozone leaders and policymakers understand the importance of staying together so that the eurozone can compete effectively and remain relevant globally. This is also the mechanism for the rest of Europe to keep Germany in check after two world wars. Last year we saw the changing of the guards at the European Central Bank which ushered in rate reduction. The new members appear to be more pragmatic and cohesive and willing to take some action.
The sovereign debt crisis can be divided into four financing or funding problems:
- Funding and refunding for the Sovereign
- Solvency or Debt/GDP Ratio of the Sovereign
- Solvency for Banks
- Liquidity and funding for banks
On December 8, 2011, the ECB, sensing the potential freezing of the banking system (i.e. tackling item 4 above), announced additional enhanced credit support measures to support bank lending and liquidity in the euro area money market. In particular, the ECB agreed:
- To conduct two longer-term refinancing operations (LTROs) with a maturity of 36 months and the option of early repayment after one year. The first operation will be allotted on December 21, 2011 and the second on February 29, 2012.
- To reduce the reserve ratio from 2%, to 1% as of the reserve maintenance period starting on January 18, 2012.
- To increase collateral availability by (i) reducing the rating threshold for certain asset-backed securities and (ii) allowing national central banks, as a temporary solution, to accept as collateral additional performing credit claims (i.e. bank loans) that satisfy specific eligibility criteria.
The European Central Bank allotted a record €489.19 billion in the first of two three-year LTRO operations to 523 banks. The heavy demand demonstrates the need for liquidity among the banks. Banks used some of that to pay off shorter term loans from the ECB. Net lending of €235 billion brought the ECB’s total loans to banks to almost €1 trillion. However this and the next LTRO will not provide any permanent solution to the overall solvency problem.
The EU leaders are holding another summit in Brussels. This is the 16th in 2 years. 25 out of the 27 EU member countries have agreed to sign a new “Treaty on Stability, Coordination and Governance” (a.k.a. the Fiscal Compact). The new treaty requires national budgets to be in balance or in surplus with annual structural government deficit not exceeding 0.5% of nominal GDP. If a member state deviates from this rule, an automatic correction mechanism will be triggered. Furthermore, the member states will have to incorporate this “balanced budget rule” into their national legal systems. The deadline for doing so is one year at the latest after the entry into force of the treaty. Should a member state fail to transpose the balanced budget rule on time, the EU Court of Justice will have jurisdiction to take a decision on the matter. The Court’s decision will be binding, and, if not implemented, can be followed up with a penalty of up to 0.1% of GDP. This amount will be payable to the European Stability Mechanism if the country’s currency is the euro, otherwise to the general budget of the EU. This treaty’s aim is a first step towards fiscal union and to set up a side “insurance” fund for those countries to pay a “penalty” for not being able to meet the treaty conditions. This treaty is another agreement that is great at the macro level but the timing is too ambitious since every government must internally approve and make part of its “national legal system”. This treaty is to memorialize what has been obvious. The manifestation of the European crisis is expressed through sovereign debt and banking problems, but the crisis stems from too much debt, too much government and too little economic growth. Moreover, the magnitude of the European crisis is a spurred by the absence of a fiscal union. This treaty is not likely to be done within the timeframe and will do little to help the crisis in the short term. Further, this treaty is only the first step towards any meaningful fiscal union to prevent a similar crisis in the future. Don’t forget, EU, eurozone or EMU are not all the same. 17 countries are in the euro zone, 23 in the Euro-Plus Pact, 25 signed the treaty, 27 all EU member states and 28 countries are involved (including the soon-to-be-member Croatia). Trying to get all or any fraction of them to agree on anything takes time and time is not a luxury the euroland has.
The following is a list of near term dates, as so reported by the Wall Street Journal, which could contribute to market volatility depending on their outcome:
- Friday, Feb. 3: Euro-zone January services PMI data.
- Monday, Feb. 6: Italian parliament must have approved government’s fiscal, growth package by this date.
- Wednesday, Feb. 8: German bond auction.
- Thursday, Feb. 9: ECB interest-rate statement, press conference.
- Friday, Feb. 10: EUR1.0 billion in Greek debt maturing.
- Monday, Feb. 13: Deadline for formal Greek debt restructuring offer to creditors. Italian T-bill auction.
- Tuesday, Feb. 14: Italian BTP auction. Greek and Spanish T-bill auctions. German February ZEW economic sentiment indicator.
- Wednesday, Feb. 15: Portuguese T-bill auction. Flash data on fourth-quarter E.U. gross domestic product.
- Thursday, Feb. 16: French and Spanish bond auctions. Spain fourth-quarter final gross domestic product data.
- Friday, Feb. 17: EUR1.6 billion Greek T-bills maturing.
- Monday, Feb. 20: Euro-zone finance ministers meet. Flash euro-zone February PMI data.
- Tuesday, Feb. 21: European Union finance ministers meet. Greek and Spanish T-bill auctions.
- Wednesday, Feb. 22: German bond auction.
- Thursday, Feb. 23: German February Ifo business climate index.
- Friday, Feb. 24: Italian bond auction.
- Saturday, Feb. 25: Group of 20 finance ministers, central-bank governors meet.
- Monday, Feb. 27: Belgian bond auction, Italian T-bill auction.
- Tuesday, Feb. 28: ECB three-month, three-year long-term refinancing operation. Italian bond auction.
- Wednesday, Feb. 29: EUR10.6 billion of Italian CTZ bonds mature. German bond auction.
- Thursday, March 1: EUR14.9 billion of Italian BTP and EUR12.3 billion CCT bonds mature. Euro-zone February manufacturing PMI data. Spanish and French bond auctions.
- Thursday, March 1-Friday, March 2: E.U. leaders summit.
- Monday, March 5: Euro-zone February services PMI data.
- Tuesday, March 6: Revised E.U. fourth-quarter GDP growth data.
- Wednesday, March 7: German bond auction.
- Thursday, March 8: ECB interest rate decision. German January industrial production data.
- Monday, March 12: Euro-zone finance ministers meet.
- Tuesday, March 13: German March ZEW economic sentiment indicator. Italian and Greek T-bill auctions.
- Wednesday, March 14: Italian bond auction.
- Thursday, March 15: Spanish and French bond auctions.
- Tuesday, March 20: EUR14.4 billion of Greek government bonds mature. Spanish and Greek T-bill auctions.
- Wednesday, March 21: German bond auction.
- Thursday, March 22: Flash euro-zone March PMI data.
- Monday, March 26: German March Ifo business climate index. Belgium bond auction.
- Tuesday, March 27: Spanish T-bill auction. Italian bond auction.
- Wednesday, March 28: ECB three-month long-term refinancing operation. Italian T-bill auction.
- Thursday, March 29: Italian bond auction.
- Friday, March 30: Euro-zone finance ministers meet.
Financial Repression
The amount of debt carried by the public sector in the advanced economies has proven to be unsustainable. According to Carmen Reinhart (co-author with Ken Rogoff of “The Time if Different” 2010) historically highly indebted sovereigns have taken one or more of the following actions to reduce public debt:
- economic growth
- substantial fiscal realignment (e.g. austerity)
- hard or soft default
- drive up inflation
- financial repression (refers to the notion that a set of government regulations, laws, and other non-market restrictions prevent or otherwise purposefully manipulate the financial intermediaries of an economy from functioning at “normal” or in an efficient way under a free market system).
According to Reinhart (Financial Repression Redux, Finance & Development, June 2011, Vol48, No1, http://www.imf.org/external/pubs/ft/fandd/2011/06/reinhart.htm), financial repression occurs when governments implement policies to channel to themselves funds that in a deregulated market environment would go elsewhere. In the name of protecting the health of the financial system, governments implement policies that serve its own purposes. Policies such as directed lending to the government by pension funds or domestic banks, explicit or implicit caps on interest rates, and regulation of cross-border capital movements. Financial repression is often associated with relatively high reserve requirements for banks, securities transaction taxes, prohibition of gold purchases, or the purchase of significant amounts of nonmarketable government debt.
By keeping rates low, the government pays less interest for each unit of debt and makes repayment a bit easier. When the real interest rates (i.e. interest rates after adjusting for inflation) are negative, the debt is reduced at the expense of the creditor or saver. This is the case currently in the U.S. We are penalizing the savers and creditors by paying them negative real rate of interest while favoring the borrowers. The Federal Reserve is making no secret of targeting re-inflation and, by doing so while keeping interest rates low, borrowers (such as the government) repay their debts with inflated currency at very low interest. This is a double tax against savers and creditors. One other benefit the government intends to receive is to maintain trade competitiveness by keeping its currency low. Using strategies such as QE or massive borrowing by the central bank to buy more public debt implicitly or explicitly erodes the confidence and value of its currency. This further aids the government’s effort to keep its goods and services competitively priced on the world stage to stimulate economic growth – which leads to a better ability to repay the mountain of debt.
In Carmen Reinhart’s updated paper on this subject, “A Series of Unfortunate Events: Common Sequencing Patterns in Financial Crises” January 2012, Centre for Economic Policy Research, she concludes that the consequences of high public and private debts in the advanced economies countries are using macroprudential regulation to fence in domestic capital to service the public debt in the highly indebted countries of the advanced economies; and fence out foreign capital by the developing economies to avoid potential overheating, rising inflationary pressures and the related competitiveness issues. This home-bias and significant re-regulation will eventually lead to financial de-globalization.
So… Where Are We Going?
The Europeans are emotionally committed to the European Monetary Union (EMU) and the eurozone and as such will continue to take the necessary (albeit the minimum amount that they can get away with) steps to prevent: a) a Greek unstructured default , b) Greece or any other nation from leaving the EMU, c) a banking or economic collapse by continuing its process of building a fire wall around the at-risk countries, d) the appreciation of the euro over time, and they will continue the can-kicking policy to muddle through the crisis over an extended period of time. Europe is in a recession now, and the depth and breadth of this recession is predicated on how the policies will be implemented on a eurozone and country-by-country basis. The base case is that the eurozone will be in recession this year and slowly climb out of the recession next year and bounce along the 0% to 1% GDP range of anemic economic growth.
The U.S. remains the least dirty among the dirty shirts. The base case is for the economy to grow at a rate of between 1.5% to 2.0%. This sub-par growth is a consequence of persistent high unemployment, lack of real wage growth, consumer deleveraging, uncertain regulations, reduction in government spending, shrinking of the public sector, housing remaining in the doldrums and inflation in check. Compared to 2011, this is a slight improvement and more so if the base case for Europe pans out. Market volatility remains as the world continues to react to all the macro factors and especially to Europe. The U.S. stock market is expected to produce a positive return this year in the range of 5% to 10% as corporate profit continues to rise. As for the rest of the world, they are all slowing down. For those
who have the investment time horizon and the appetite and appreciation for risk, investing in developing economies should provide relative outsized return over time.
The change from 2011 to 2012 is subtle but important. Last year the statistical term “tail risk ” dominated the investment lexicon. This is the portion of the risk distribution that happens (in theory) rarely but when it happens the consequence is severe. It is sometimes thought of as the “hundred year flood” that happens very rarely and when it does villages and towns are wiped out. Going forward, the tails are getting larger and the distribution is getting flatter. Due to a confluence of events and systematic depletion of shock absorbers in the system, the chance of a hundred year flood is far more frequent. Although the signs point to “walking away from the abyss” by the Europeans since October last year, the road ahead remains treacherous and full of policy and political risks. The deleveraging by the private sector and the re-leveraging by the sovereign and super-sovereign through excessive monetary easing will contribute to a series of unintended consequences. We should also be concerned with the ongoing Arab Spring movement as well as the Iran-Palestinian-Israel tension. This could heighten with significant spillover effects on world oil supply and price.
According to the chinesezodiac.com website, the new year of the Dragon occupies the 5th position in the Chinese 12 zodiac signs. “The Dragon is the mightiest of the signs. Dragons symbolize such character traits as dominance and ambition. Dragons prefer to live by their own rules, and if left on their own, are usually successful. They’re driven, unafraid of challenges, and willing to take risks. They’re passionate in all they do, and they do things in grand fashion. Unfortunately, this passion and enthusiasm can leave Dragons feeling exhausted and interestingly, unfulfilled.” In this Age of Great Consequences, we need to be ever more focused on risk and risk management and use a balanced approach to control short-term reactions with long-term objectives. So far this year, risk has been on but not to worry or be too content. Risk will be off soon. At which point, don’t despair. At the end, investing is as much about knowing oneself as it is about knowing about the ever changing world around us.