The financial markets in the second quarter have been negative overall with increased volatility and uncertainty brought on by the anticipation of the Federal Reserve’s interest rate move and the high probability of a Greek exit (Grexit) from the European Monetary Union (EMU). The spectacular equity market correction in China coupled with the threat of the biggest municipal bond default from Puerto Rico (the U.S. version of Greece) also contributed to overall market fears. Each event has been self-contained and has not contributed to a global contagion nor short-term spillover effects across markets, but investor psychology can be quite unpredictable and “change on a dime”.
The U.S. Economy and Rate Normalization
Federal Reserve chair, Janet Yellen, gave a speech1 at the City Club of Cleveland on July 10, 2015, which offered a preview to her upcoming semi-annual monetary policy report to the Congressional Committee on Financial Services, on July 16, 2015. Chair Yellen reported on the state of the U.S. economy, the employment picture and inflation expectation. She concluded by affirming that rate normalization (“Lift Off”) remains on track for 2015. Since the Lift Off decision remains data dependent, a review of each major component of her speech against current economic data helps to inform us regarding the timing for Lift Off.
The Economy
Chair Yellen offered a summary of both negative and positive factors on the U.S. economy.
Negative Factors – She reiterated that the slow first quarter GDP rate is attributable to factors that weighed on economic output and industrial production:
- Transitory factors
- Unusually severe winter weather
- West Coast port labor dispute
- Persistent factors
- Higher foreign exchange value of the dollar and the weak growth in some foreign economies have restrained the demand for U.S. exports.
- Lower crude oil prices have significantly depressed business investment in the domestic energy sector.
The Federal Reserve expects the drag on domestic economic activity to ease over the course of this year, as the value of the dollar and crude oil prices stabilize.
For the longer term, Chair Yellen cited a couple of factors that could restrain economic growth:
- Businesses remain cautious and have not substantially increased their capital expenditures. They are holding large amounts of cash on their balance sheets, which may suggest that greater risk aversion is playing a role.
- While national home prices have been rising for a few years and home sales have improved recently, residential construction has remained quite soft. Many households still find it difficult to obtain mortgage credit, but, more generally, the weak job market and slow wage gains in recent years appear to have a drag on housing.
Positive Factors –
- Many of the fundamental factors underlying U.S. economic activity are solid and should lead to some pickup in the pace of economic growth in the coming years.
- Employment will continue to expand and the unemployment rate will decline further.
- An improving job market should help support a faster pace of household spending growth.
- Additional jobs and potentially faster wage growth bolster household incomes, and lower energy prices mean consumers have more money to spend on goods and services.
- Growing employment and wages should make consumers more comfortable in spending a greater portion of their incomes.
- Increases in house values and stock market prices, along with reductions in debt in recent years, have pushed up households’ net worth, which also should support more spending.
- Interest rates faced by borrowers remain low, reflecting the FOMC’s highly accommodative monetary policies.
- The drag on economic growth from changes in federal fiscal policies appears to have waned.
The Federal Reserve Bank of Atlanta maintains a proprietary real time measure of U.S. GDP. It is a quantitative model which is continuously updated as new information and data are released. The GDPNow model mimics the methods used by the Bureau of Economic Analysis (BEA) to estimate real GDP growth. The GDPNow forecast is constructed by aggregating statistical model forecasts of 13 subcomponents that comprise GDP. Other private forecasters use similar approaches to “nowcast” GDP growth. The GDPNow model forecast for real GDP growth (seasonally adjusted annual rate) in the second quarter of 2015 was 2.3% on July 7, up from 2.15% on July 1.
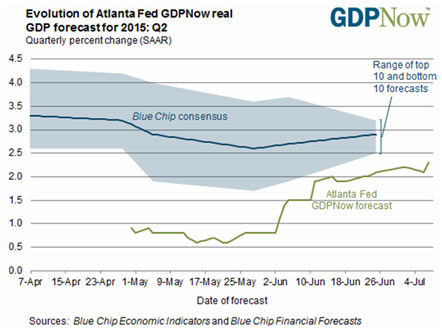
According to the meeting minutes under the Summary of Economic Projections (June 2015 Projections) section reporting estimates from June 2014 through June 2015 meetings, the following are the real GDP “Blue Dot” ranges. This clearly shows that the FOMC voting members substantially moved down their expectations for the 2015 real GDP range to between 1.7% and 2.3%

According to the Atlanta Fed, the following are the contributors to the US economy.

*CIPI1 = change in private inventories
The largest detractors to the current estimated 2.3% GDP growth for the second quarter are non-residential construction and the change in private inventories. The largest contributors are residential investment and intellectual property production. This tells us that businesses are not spending or investing in commercial structures (some spending in equipment) and are drawing down their inventories while consumers are improving their spending and residential investments are on the upswing.
Quarterly GDP data can be noisy and volatile due to various factors. The average value of trailing 4 quarter data smooths the various factors and offers a clearer picture of the U.S. economy. Even assuming a 2.5% real annualized GDP for the second quarter after a negative 0.17% rate in the first quarter, the economy is back to a sub-2.5% growth rate. With the exception of the 2013 fourth quarter, the average 4 quarter trailing real GDP rates have been firmly in the sub-3% annualized rate. In order for the economy to break out of this “New Normal” world and back to the “Old Normal” world of 3.5% and greater, the economy has to grow at a rate of no less than 4.7% each quarter until the end of this year. There are no known factors that would get us there. Even though the bounce back from the first quarter is helpful and expected, the bounce back is significantly less than the bounce back from the second quarter of 2014. Although it is still too early to tell, the U.S. economy may be slowing a bit towards the end of this year as compared to the current general consensus. In fact, the Blue Dots suggest a longer term real GDP rate remains firmly below 3% with a range between 1.8% and 2.5%.
Full Employment
Chair Yellen stated that “[t]he lower level of the unemployment rate today probably does not fully capture the extent of slack remaining in the labor market – in other words, how far away we are from a full-employment economy.”
“Cyclical and structural factors both have affected a number of measures of labor market outcomes that bear on our assessment of slack, including labor force participation (that is, how many people are working or are actively looking for work), the number of people working part time who would rather work full time, the pace of hiring, and the rate at which people are quitting jobs.”
Chair Yellen believes that “a significant number of individuals still are not seeking work because they perceive a lack of good job opportunities, and that a stronger economy would draw some of them back into the labor force.”
Chair Yellen is a labor economist by training and believes that a full recovery of the U.S. economy cannot be achieved without a full employment and a full employment is not simply meeting NAIRU – the non-accelerating inflation rate of unemployment, but to remove slack in the system. To put it another way, she is not satisfied with the current U3 employment rate even though it is approaching a rate that has traditionally been considered full employment in the U.S.
The June 2015 Projections provided the following Blue Dot ranges for employment:

The full range expressed during the June 2015 meeting is between 5% and 5.3%, which is less aggressive than the 4.8% and 5.3% range from the March meeting. For the longer term, beyond next year, the FOMC is expecting a slight increase in the U3 unemployment rate. According to the most recent Bureau of Labor Statistics (BLS) report, the U3 and U6 rates have both continued to drift downward.

The latest U3 rate has furthered improved to 5.3% while the U6, the broader measure, has dipped to 10.5%. However, the participation rate continues its drift downwards with ever more Americans leaving the labor force.

With over 94 million Americans no longer participating in the labor force (either voluntarily or involuntarily) and a participation rate of 62.6%, Chair Yellen is concerned about the slack since the U3 rate does not reflect the ever shrinking employed pool of workers and the disenfranchised. Since March 2014, the U.S. economy has produced over 200,000 net new jobs per month (except March and April this year). Yet, the number of hours worked per week and real wage inflation have remain stagnant. The latest showing of a slightly higher wage increase may be a reflection of a broad increase in minimum wage for service workers.

(Source: BLS -http://data.bls.gov/pdq/SurveyOutputServlet?request_action=wh&graph_name=EC_ectbrief)
These indicators suggest that the types of employment gains in the system may have been low wage jobs that do not fully utilize the skills of the newly employed or re-employed. Certainly, being employed is better than unemployed, and even at low wage positions, it contributes to workforce participation and overall ability to consume. Thus, even with a decreasing U3 rate, Chair Yellen remains dissatisfied with the employment picture. Another indicator that is followed by the FOMC is the Quit Rate reported in the Job Openings and Labor Turnover Survey. The Quit Rate reports the proportion of workers who quit their jobs in any given month. This indicates how many people are leaving their jobs voluntarily. A higher or increasing quit rate suggests increasing worker confidence and labor market recovery where workers are willing to quit their current position because of better positions or offers. But the quit rate also includes those voluntarily leaving the workforce to go back to school or a variety of other reasons (see labor participation rate section). Throughout the current economic recovery, the quit rate has not returned to its pre-recession level. This suggests that there remains slack in the labor market even though net new jobs created are healthy and the U3 rate is dropping quickly.

Inflation and Price Stability
Chair Yellen suggested that the recent effects of lower prices for crude oil and for imports on overall inflation are expected to wane during this year. Combined with further tightening in labor and product markets, she expects inflation will move toward the FOMC’s 2% objective over the next few years. Importantly, a number of different surveys indicate that longer-term inflation expectations have remained stable even as recent readings on inflation have fallen.
The June 2015 Projections provided the following Blue Dot ranges for employment:

On a monthly basis, the Federal Reserve Bank of Cleveland3 uses a model to estimate the inflation expectation in the future. The Cleveland Fed’s estimate of inflation expectations is based on a model that combines information from a number of sources to address the shortcomings of other, commonly used measures, such as the “break-even” rate derived from Treasury inflation protected securities (TIPS) or survey-based estimates. The latest estimate of 10-year expected inflation is 1.82%. This means that the public currently expects the inflation rate to be less than 2% on average over the next decade.
The two predominant measures of inflation are the Consumer Price Index (CPI) and the Personal Consumption Expenditure (PCE).
The FOMC prefers PCE over CPI and also places more emphasis on the core PCE (i.e. excluding the volatile food and energy components). Based on the latest reading, the core PCE is 1.3% at the end of the first quarter. This remains well below the 2% target Chair Yellen and the FOMC are targeting. The transitory factors that were mentioned by Chair Yellen are likely contributors to maintaining a low core PCE rate currently.

In the case of CPI, the BLS reported in May4 that core CPI was up 1.7% year-on-year while CPI was 0%. Although the core excludes the volatile energy prices, the overall economic spillover effect of a sharp drop in energy prices do bleed into the core CPI over time. This could drag down the core CPI and mask the real inflation rate of the general economy. The bottom line is that core inflation will not move meaningfully until there is meaningful wage inflation.
Lift Off is On Track
Chair Yellen stated that she expects it will be appropriate at some point later this year to take the first step to raise the federal funds rate and thus begin normalizing monetary policy. She emphasized that the course of the economy and inflation remain highly uncertain, and unanticipated developments could delay or accelerate this first step. The FOMC wants continued improvement in labor market conditions and to be reasonably confident that inflation will move back to 2% in the next few years.
She reiterated the FOMC’s position that the appropriate pace of normalization will be gradual and that monetary policy will need to be highly supportive of economic activity for quite some time. Nonetheless, the degree of monetary policy accommodation will be predicated on the speed of the progress in which employment and inflation expectation goals are obtained.
The June 2015 Projections provided the following ranges for the Lift Off and the future Fed Fund rate:

The base case remains a 2015 Life Off where the FMOC will move away from the zero interest rate policy. However, the exogenous factors such as Greece, slow or slowing growth rates in Europe and Asia, the Chinese stock market, and certain unobserved or unknown factors may push the Lift Off date to 2016.
The CME Group5 FedWatch expresses the market’s expectations of potential changes to the Fed Funds target rate. The tool is based on 30-Day Fed Funds futures prices, which have long been used to express the market’s views on the likelihood of changes in U.S. monetary policy. The following table summarizes the probability of a rate hike as of 07-14-2015.

In this case, the market has a 16% probability that Lift Off would happen in September and 50% probability in December. The market is anticipating a slower pace of rate normalization than the Blue Dot ranges reported for the June meeting. This disparity between the market and the FOMC suggests further market volatility to fixed income instruments since the market and the FOMC projections will converge soon or later – either one or both are wrong.
The yield curve has moved since the beginning of the year with the short end of the curve remaining unchanged. The 10-year Treasury has been volatile and has move its range to 2%-2.5% from 1.75%-2.25%. Some of the volatility is due to a global re-pricing of fixed income and risk and some result from flight to safety in the U.S. treasuries. Regardless of when the Lift Off date is, more market volatility is expected in bonds.

The Bank of International Settlement (www.bis.org) issued its 85th annual report6 on June 28, 2015. Its theme is the title of chapter I: “Is the unthinkable becoming routine?” There is a sense of complacency after years of extraordinarily low normal and real interest rates by accepting the broad economic malaise as the new normal. The exceptionally low interest rates are employed to tackle near term challenges of economic growth and price stability while risking longer-term financial booms and busts and creation of bubbles. Globally, the easy monetary policies have and continue to have significant influences in exchange rates and capital flows that contribute to long term financial vulnerabilities. The BIS report suggests that “a triple rebalancing in national and international policy frameworks: away from illusory short-term macroeconomic finetuning towards medium-term strategies; away from overwhelming attention to near-term output and inflation towards a more systematic response to slowermoving financial cycles; and away from a narrow own-house-in-order doctrine to one that recognizes the costly interplay of domestic-focused policies. One essential element of this rebalancing will be to rely less on demand management policies and more on structural ones, so as to abandon the debt-fuelled growth model that has acted as a political and social substitute for productivity-enhancing reforms.” This sounds great on paper but in practice requires the scarce commodities of leadership, conviction, patience, cooperation and act against self-interest.
The report echoed the recent observation by Dr. Nouriel Roubini in his May 31, 2015, article titled “The Liquidity Time Boom”7 . Roubini contrasted the world awash in macro liquidity while market illiquidity is constrained in many sectors (years of low yield environment and the consequence of Dodd-Frank implementation). The European Central Bank instituted a $1.2 trillion Large Scale Asset Purchase program8 (a.k.a. quantitative easing) on March 4, 2015, and is expected to continue through September 2016 at the earliest and remains open ended until the ECB sees a sustained adjustment in the path of inflation which is consistent with its aim of achieving inflation rates below, but close to, 2% over the medium term. The 2015 US Monetary Policy Forum Panel discussion on Central Banking with Large Balance Sheets9 on February 25th shows the significant central bank balance expansion even prior to ECB’s latest action:

These central bank actions depress interest rates along the yield curves while devaluing their home currencies and making their exports more competitive. Moreover, this drives savers and investors to become uncomfortable with low yielding safe assets (falling term premia and lower expected policy rates) and invest in risky assets resulting in financial asset inflation which leads to the wealth effect. According to the report, “[t]he fragility of otherwise buoyant markets was underscored by increasingly frequent bouts of volatility and signs of reduced market liquidity. Such signs were perhaps clearest in fixed income markets, where market-makers have scaled back their activities and market-making has increasingly concentrated in the most liquid bonds.As other types of players, such as asset managers, have taken their place, the risk of “liquidity illusion” has increased: market liquidity appears ample in normal times, but vanishes quickly during market stress.”

Since the ECB’s new drive for quantitative easing, many European government bonds are at negative yields. This is highly unusual and is a symptom of disinflation/deflation, economic malaise, high unemployment, structural challenges, and financial repression through unconventional monetary policies. This graph shows the many European counties with sovereign bonds yielding in negative territory. In fact, many are at negative yield with their 2 to 4 year bonds. In the case of the Swiss bond, the yield is a -0.11% for its 10 year bond. We can try to explain this from a classic supply and demand perspective. For an investor to pay (and not earn) interest in order to own bonds tells a more nuanced story. One explanation is that investors are unwilling to take on credit or market risks or volatility. By locking in a known loss, investors define their loss rather than to take a chance with other investments vehicles. Another rationale is “flight to safety” and the negative interest rate is the cost of entry. Neither one of these perspectives is very complementary about Europe and the state of its economic affairs.
The World Economy
According to Markit’s PMI indexes, developed economies (DM) continue to perform better than their emerging economy (EM) counterparts. This means the growth engine of EM continues to slow.

This is echoed by the International Monetary Fund (IMF). In its July 9th World Economic Outlook Update10 , the IMF revised down its forecast for global growth from the prior projection (April 2015) of 3.5% to now 3.3% while holding projection for 2016 constant at 3.8%. The 3.3% projection is 0.1% lower than 2013 and 2014. The IMF cited the following reasons for the lower update:
- A slowdown in EM economies
- First quarter US economic contraction
- Risks to global growth still tilted to the downside – “Increased financial market volatility and disruptive asset price shifts, while lower potential output growth remains an important medium-term risk in both advanced and emerging market economies. Lower commodity prices also pose risks to the outlook in low-income developing economies after many years of strong growth.”
Going forward, the IMF projects a growth increase in the advanced economies from 2.1% in 2015 to 2.4% in 2016. Echoing Chair Yellen, IMF expects the US first quarter slowdown to be transitory and the underlying drivers for acceleration in group remain intact. The economic recovery in the euro area remains generally on track with a robust recovery in domestic demand and increase in inflation. However, in Japan, with the weaker underlying momentum in real wages and consumption, the growth in 2015 is now projected to be more modest.
For the EM economies, IMF is projecting a broad slowing from the 2014 rate of 4.6% to 4.2% in 2015 and to pick up in 2016 to 4.7%. The 2015 slowdown “reflects the dampening impact of lower commodity prices and tighter external financial conditions—particularly in Latin America and oil exporters, the rebalancing in China, and structural bottlenecks, as well as economic distress related to geopolitical factors—particularly in the Commonwealth of Independent States and some countries in the Middle East and North Africa.”
Along the same line, the Organization for Economic Co-operation and Development (OECD)General Assessment of the Macroeconomic Situation11, as a part of the OECD Economic Outlook released on June 3, revised its November 2014 forecast of 3.6% for 2015 and 3.9% for 2016 down to 3.1% and 3.8% respectively. According to its press release12 and thematically consistent or within range with the IMF, U.S. GDP growth is projected to be 2.0% in 2015 and 2.8% in 2016. Supportive monetary policy and lower oil prices should continue boosting demand. Output in the Euro area is expected to rise by 1.4% this year and 2.1% in 2016, as compared with prior projections of 1.1% for 2015 and 1.7% for 2016. Bolder-than-expected monetary easing by the ECB accompanied by substantial depreciation of the euro are major supportive factors. Japanese growth is projected at 0.7% in 2015 and 1.4% in 2016 as compared to 0.8 and 1.0% previously. Lower oil prices, stronger exports reflecting the weaker yen and real wage gains are among the factors driving the recovery. In China, the 2015 GDP growth forecast has been revised down to 6.8% from 7.1% in the November Outlook and to 6.7% from 6.9% for 2016. The deceleration reflects the restructuring underway in the Chinese economy as services replace manufacturing and real estate investment as the main driver of growth. Growth in India is expected to remain strong and stable in 2015 (at 7.3%) and 2016 (7.4%). Finally, the recessions in Russia and Brazil are projected to give way to low but positive growth in 2016.

Greece – Self Inflicted Injury
Greece misrepresented its financial conditions in order to become a member state of the European Monetary Union in 2001. Since then, it has not been able to meet the conditions of its membership. Even with the disclosure by the Greek government in 2004 that its previous administrations have lied its way into the common currency bloc, no actions were taken by the remaining member states.


The Greek national debt became increasingly unsustainable since its growth has been fueled by deficit spending. Greece was able to thinly mask its bad financial health through the 2004 Olympic Games. The 2007-2008 Financial Crisis laid bare highly levered countries and their economic vulnerabilities. In 2010, at the height of the U.S. driven credit crisis that led to the sovereign-banking crisis in Europe, an aid package negotiated with the ECB, European Commission (EC) and the IMF, worth €110 billion over three years was implemented. Greece13 agreed to cut its budget deficit to 3% of GDP, as required by European Union rules, by 2014. The Greeks promised to slash and then freeze public-sector wages, raise sin taxes, increase value-added taxes, impose a new levy on businesses, cut pension payments and raise retirement ages for some public-sector workers. The steps are expected to save the state €30 billion through 2013. A second bailout was approved by the Euro countries on July 21, 2011, in the form of a €100 billion aid package provided by the newly created European Financial Stability Facility. The repayment period was extended from seven to 15 years and the interest rate was lowered to 3.5%. The final agreement for releasing the second bailout had three conditions: (1) all private holders of governmental bonds would accept a 50% haircut (investors ended up accepting a 53.5% haircut) with yields reduced to 3.5%, this would equate to a €100 billion debt reduction for Greece; (2) they implement another round of austerity program to bring the national budget in line; and (3) a majority of the Greek politicians had to sign an agreement guaranteeing their continued support for the new austerity package.
The multi-year imposed austerity, high unemployment and deflation/depression in Greece brought in the left-leaning Syriza party headed by Alexis Tsipras in January based on the populist platform of rolling back austerity and standing strong against the international lenders. With the deadline for missing payments and defaulting on its debt to the IMF and subsequently to the ECB and with more debt payments to come14 , Tsipras called for a referendum so that the Greek people can decide if they were willing to continue the severe austerity measures that were in place. This was interpreted as a Greek vote to stay in or leave the EMU. In the meantime, capital controls were implemented where banks were only allowing a small withdraw by depositors per week to stop a run on the banks. With emergency funding cut off from the ECB and liquidity drying up, on June 29th Greek banks went on involuntary holidays. The Greek people voted overwhelmingly against austerity (i.e. a No vote) signalizing the beginning of a Greek exit from the EMU. The Greek economy continued to contract and deteriorate. Although market observers, economists and investors have taken the position that a Greek default or exit will have little to no spillover financial effect (unlike the 2010 experience), the markets were nervous. Tsipras fired his finance minister and made a surprising proposal to the lenders with terms that are almost identical to those that were violently rejected just weeks ago. The Euro group rejected the proposal and countered with even tougher austerity measures and conditions15 for Greece. Ultimately, Tsipras was able to convince the Greek parliament to vote for the new deal even though it was at a significant political cost. It remains puzzling the cause Tsipras took to stay in the EMU and how Greece is worst off even after a resounding referendum to take an opposite action.
This multi-year slow train wreck in Greek is continuing and it exposes the vulnerability of the EMU. For Greece, more debt relief and bond holder haircuts are needed in order for Greece to have a realistic chance to recover. The debt burden continues to place a significant weight on its economy and the needed structural reform (agreed to or otherwise) will take time to realize. Although the EMU averted the Grexit this time, the agreed to new terms have significant implementation risk, and the odds are that Greece will not be able to abide by the terms agreed to. The latest round of bailout is not really bailing out Greece, it is a way to funnel money though Greece to perform on the existing obligations to ECB, EC and the IMF. Everyone wins (except the Greek people): EMU stays intact and no default.
For the long term sustainability and credibility of the euro, the world needs to see banking union, fiscal union and ultimately political union. Although the Grexit has been avoided this time around, the EMU member states and the ECB have again kicked the can down the road in hopes that the Greek economy and the European economy will grow fast enough to bail out the heavily indebted nations over time without a transfer of payments or demonstrating the political courage to implement structural reforms.
A Word About China
The move from an investment and export driven economy to a consumer driven economy cannot happen overnight and requires many structural, economic, and policy changes. The old growth model of government driven investments and serving as the global factory floor is over. The misallocation of assets and resources and inefficient transfer of wealth from the central government to the provinces have created bubbles and risks to the economy. The National People’s Congress, approved China’s 12th Five-Year Plan on March 14, 2011, It places low emphasis on headline growth and focuses on steps to secure long-term prosperity for the country. Three of the main priorities are sustainable growth, industrial upgrading and the promotion of domestic consumption. November 9-12, 2013, came the Third Plenary Session of the 18th Central Committee of the Communist Party of China, which laid the foundation for the country’s direction the next 10 years. The central theme is to continue the path of moving China from a planned economy to a market economy which requires economic, political, social, cultural, and ecological reform. The government intends to reduce its intervention into the economy but the hand off will prove to be challenging and bumpy. It is difficult to strike a balance between economic power and political control – watching a dinosaur dance.
The dramatic rise and sudden fall in the Shanghai Composite Index this year is a reminder of seeing how China is learning to manage its market openness and the challenges of moving from a planned economy to an open economy. All-time high in the Shanghai index was achieved on June 12th and to witness a significant and forceful correction that began on the 15th. Due to the stock ownership restriction imposed on Chinese shares, the severe correction was contained to local markets. Before the crash, the Chinese stock market appreciated more than 150% over 12 months and more than doubled since 2014 Thanksgiving. From June 12 to July 8, the country’s two main markets, in Shanghai and Shenzhen, dropped by about 30%, shedding more than $3 trillion in value. Chinese stocks are owned primarily by 90 million individual small retail investors. The accommodative monetary policy of late, the movement away from real estate investment (government policy against excessive bank lending on real estate), and new laws liberalizing market participation (IPOs) are factors that lured individuals into the market. On many levels, this is an old story – leverage through margin.
Chinese government stepped in to stop the market from falling further: suspended new issuance of stocks, forcing pension funds, brokers and fund managers to buy massive amount of shares with the assistance of state-owned margin finance company (based by the central bank), cut interest rate to record low, capped short selling, limiting the supply of existing shares and halted trading in over 50% of the listed shares. With these efforts, China stock market has stabilized for now. Since foreign ownership is very limited, there is no spillover effect. However, watching how China dealt with this event suggests that the central government was fearful of the effect on the economy and overall stability. The heavy handedness of the central government brings in question of trust and credibility in the Chinese market. The final chapter of this current market turmoil has not been written and it is one example of seeing a not so elegant transformation of China into a market economy.
Conclusion
The second quarter saw a sea of red around global investment markets. The uncertainty surrounding the Federal Reserve’s timing of its Lift Off, the Greek default and possible Grexit, and the China stock market crash all contributed to a risk-off sentiment. The following table shows the 1 Month (June), 2 Months (May and June) and the second quarter performance of various major investment index benchmarks. For the month of June, almost every asset and market had a negative return and with most of the same indexes showing a negative return for the entire quarter. There was nowhere to hide. The U.S. core fixed income traditionally served as the portfolio stabilizer in times of financial market instability has contributed to the poor portfolio performance. A combination of investors anticipating the Federal Reserve’s moving from its zero interest rate policy (ZIRP) and the reversion of the first quarter excessive asset flow into high quality core fixed income (risk off) exaggerated the poor performance of core bonds.

The fundamentals of the U.S. economy continue to improve with solid employment growth and healthy consumer and corporate balance sheets. According to HUD, housing seems to be finally improving with housing permits. In its June16 reported a seasonally adjusted rate of 7.4% above the prior month and 30% above the June 2014 rate. Housing starts are also up 9.8% above the prior month and 26.6% above a year ago, but there remain signs of uncertainty and an economy not firing on all cylinders.
- Velocity (lack) of Money
 The velocity of money is the frequency at which one unit of currency is used to purchase domestically-produced goods and services within a given time period. In other words, it is the number of times one dollar is spent to buy goods and services per unit of time. If the velocity of money is increasing, then more transactions are occurring between individuals in an economy. Since the Great Recession, the velocity of money continues to dwindle.
 - Industrial Production and Capacity UtilizationThe Industrial Production Index is an economic indicator that measures real output for all facilities located in the U.S. manufacturing, mining, and electric, and gas utilities. Industrial production increased 0.3% in June but fell at an annual rate of 1.4% for the second quarter. Capacity Utilization is the percentage of resources used by corporations and factories to produce goods in manufacturing, mining, and electric and gas utilities for all facilities located in the U.S. Capacity utilization for the industrial sector increased 0.2% in June to 78.4%, a rate that is 1.7% below its long-run (1972–2014) average.
- Productivity Growth
 Productivity growth is the primary driver of per capita income and improving living standards over time. The growth of US labor productivity has significantly slowed during the past decade, averaging only modestly above zero for the past five years. This placed significant drag on near-term US potential growth. According to BLS17, nonfarm business sector labor productivity decreased at a 3.1%b annual rate during the first quarter of 2015, as output declined 1.6% and hours worked increased 1.6%.
The probability of a Federal Reserve Lift Off action is now lowered for September and we expect the move will be pushed to December or 2016. We expect the U.S. GDP to be 2.3% for 2015, which is very much a New Normal economy. Chair Yellen has repeatedly emphasized trailing data and offered explanations as to why the U.S. economy is not where it should have been. This backward looking frame seems to suggest that she is not confident about the state of the economy and the “transitory” nature of the rise in U.S. dollar and the depressed oil price. We should not be preoccupied by the exact date of the FOMC action, but when the Lift Off comes, the action would signal the beginning of the next phase of the monetary policy regime (tightening) in the U.S. which would change the market psychology globally.
The U.S. economy remains in the state of New Normal for the foreseeable future. If the New Normal is the Normal, then we are no longer in the recovery stage of the current extended economic cycle. For the economy to be considered recovering, we are expecting the economy to achieve last cycle’s growth benchmark. If the benchmark (e.g. 3.5% to 4% sustained real GDP growth rate) is not reachable, then perhaps the U.S. economy has already recovered and we are now in the expansion phase. This also could mean that we are much closer to the end of the current economic cycle and recession is within our cyclical horizon (2 to 3 years).
The unconventional monetary policy globally has and continues to inflate financial assets. Stocks and bonds have brought forward years of future appreciation to satisfy the insatiable investor desire for yield and return. Baring a serious market correction, the expectation for future returns on stocks and bonds should be muted (mid to low single digits). Investors will likely be less rewarded (less premia) for taking risk (both equity and duration) relatively while volatility will continue to normalize. It is likely that bond and stock movement will be more correlated during the rising interest rate environment as our markets respond to the next phase of normalization. This may have significant implications to traditional asset allocation strategy and portfolio stability.
- http://www.federalreserve.gov/newsevents/speech/yellen20150710a.htm
- CIPI is a measure of the value of the change in the physical volume of the inventories—additions less withdrawals—that businesses maintain to support their production and distribution activities. A positive CIPI indicates that total production (GDP) exceeded the sum of the final sales components of GDP in the current period and that the excess production was added to inventories. A negative CIPI indicates that final sales exceeded production in the current period and that the excess sales were filled by drawing down inventories. https://www.bea.gov/national/pdf/NIPAhandbookch7.pdf
- https://www.clevelandfed.org/en/Our%20Research/Indicators%20and%20Data/Estimates%20of%20Inflation%20Expectations.aspx
- http://www.bls.gov/news.release/pdf/cpi.pdf
- http://www.cmegroup.com/trading/interest-rates/fed-funds.html?utm_source=direct&utm_medium=print&utm_campaign=CTA-Intelligence-advert
- http://www.bis.org/publ/arpdf/ar2015_ec.pdf
- http://www.project-syndicate.org/commentary/liquidity-market-volatility-flash-crash-by-nouriel-roubini-2015-05
- http://www.ecb.europa.eu/ecb/legal/pdf/en_dec_ecb_2015_10_f_.sign.pdf
- https://www.ecb.europa.eu/press/key/date/2015/html/sp150227.en.pdf?67d22bd0967ef0cfc97778b23fd2635e
- http://www.imf.org/external/pubs/ft/weo/2015/update/02/pdf/0715.pdf
- http://www.oecd.org/eco/outlook/Economic-Outlook-97-General-assessment.pdf
- http://www.oecd.org/newsroom/strengthening-investment-key-to-improving-world-economy.htm
- Source: IMF, Greece agreed to meet budget and debt goals by taking the following actions:
- Cut budget deficit by 11% of GDP by 2013, through spending cuts valued at 7% of GDP and revenue increases valued at 4% of GDP.
- Reduce budget deficit to ‘well below’ 3% of GDP by 2014.
- Reduce debt-to-GDP ratio from 2013, with primary budget surpluses of at least 5% of GDP up to 2020.
- Cut public-sector pay and pensions.
- Raise average retirement age.
- Increase value-added taxes and excise duties.
- Deregulate the labor market and industries.
- Privatize some state industries.
- Cut public investment.
- Crack down on tax evasion.
- http://graphics.wsj.com/greece-debt-timeline/
- http://online.wsj.com/public/resources/documents/eurosummit.pdf
http://www.telegraph.co.uk/finance/economics/11735674/Greece-deal-explained-Whats-in-the-new-deal-and-how-it-compares-to-the-old-one.html
In order to unlock a fresh €82bn to €86bn bail-out, Greece passed laws that:- implement VAT hikes
- cut pensions
- take steps to ensure the independence of Greece’s statistics office is maintained
- put measures in place to automatically slash spending if Greece fails to meet its targets on primary surpluses (revenue minus expenditure excluding debt servicing costs)
- It has until July 22 (an extra week compared with a draft statement) to:
- overhaul its civil justice system
- implement the Bank Recovery and Resolution Directive to bring bank resolution laws in line with other states
- Greek MPs will also have to sell off €50bn of Greek assets.
- https://www.census.gov/construction/nrc/pdf/newresconst.pdf
- http://www.bls.gov/news.release/prod2.nr0.htm