The U.S. economic recovery story remains slow but steady. There are enough indicators for the optimists and pessimists to build their case about the future. As the old saying about opinion goes, everyone has one. But not every opinion has the weight or influence of the Federal Reserve’s. According to the Federal Open Market Committee’s (FOMC) latest press release1 , the U.S. economy continues its recovery as evidenced by the improvement in the labor market even though there remains significant underutilization of labor resources. However, the FOMC believes that there is sufficient underlying strength in the broader economy to support the ongoing improvement. On the price stability front, the FOMC suggests that that there has been a slight pickup in inflation which is moving closer to the long term objective of 2%. The Committee sees the risks to the outlook for economic activity and the labor market as nearly balanced. This confirms the view that, even as the broad employment picture (the U3 rate) continues to improve, albeit at a pace faster than most have anticipated, the Federal Reserve is pivoting its focus on labor utilization (the U6 rate). By doing so, the FOMC has given itself more time before normalizing interest rates. Further, even if inflation reaches 2%, the FOMC has stated previously that it serves as the floor and not a trigger for raising rates. Long live “financial repression”.
The FOMC supports the progress toward maximum employment and price stability by keeping interest rates unchanged and continues its reduction in its Large Scale Asset Purchase Programs. Beginning in August, the Committee will add to its holdings of agency mortgage-backed securities at a pace of $10 billion per month rather than $15 billion per month and will add to its holdings of longer-term Treasury securities at a pace of $15 billion per month rather than $20 billion per month. Also, the FOMC shall maintain the existing policy of reinvesting principal payments from its holdings of agency debt and agency mortgage-backed securities in agency mortgage-backed securities and of rolling over maturing Treasury securities at auction. In the aggregate, these actions should continue their downward pressure on longer-term interest rates, support mortgage markets, and help to make broader financial conditions more accommodative.
From a forward guidance standpoint, the FOMC continues to anticipate that it likely will be appropriate to maintain the current target range for the federal funds rate for a considerable time after the asset purchase program ends (at the current pace, the program is expected to end by the end of October), especially if projected inflation continues to run below the Committee’s 2% longer-run goal and provided that longer-term inflation expectations remain well anchored. Further, even after employment and inflation are near mandate-consistent levels, economic conditions may, for some time, warrant keeping the target federal funds rate below levels the Committee views as normal in the longer run.
To better understand the basic factors that influence or give leeway to FOMC policymakers, the following publically available data set provides some insights.
A. Gross Domestic Product (GDP) – Lukewarm
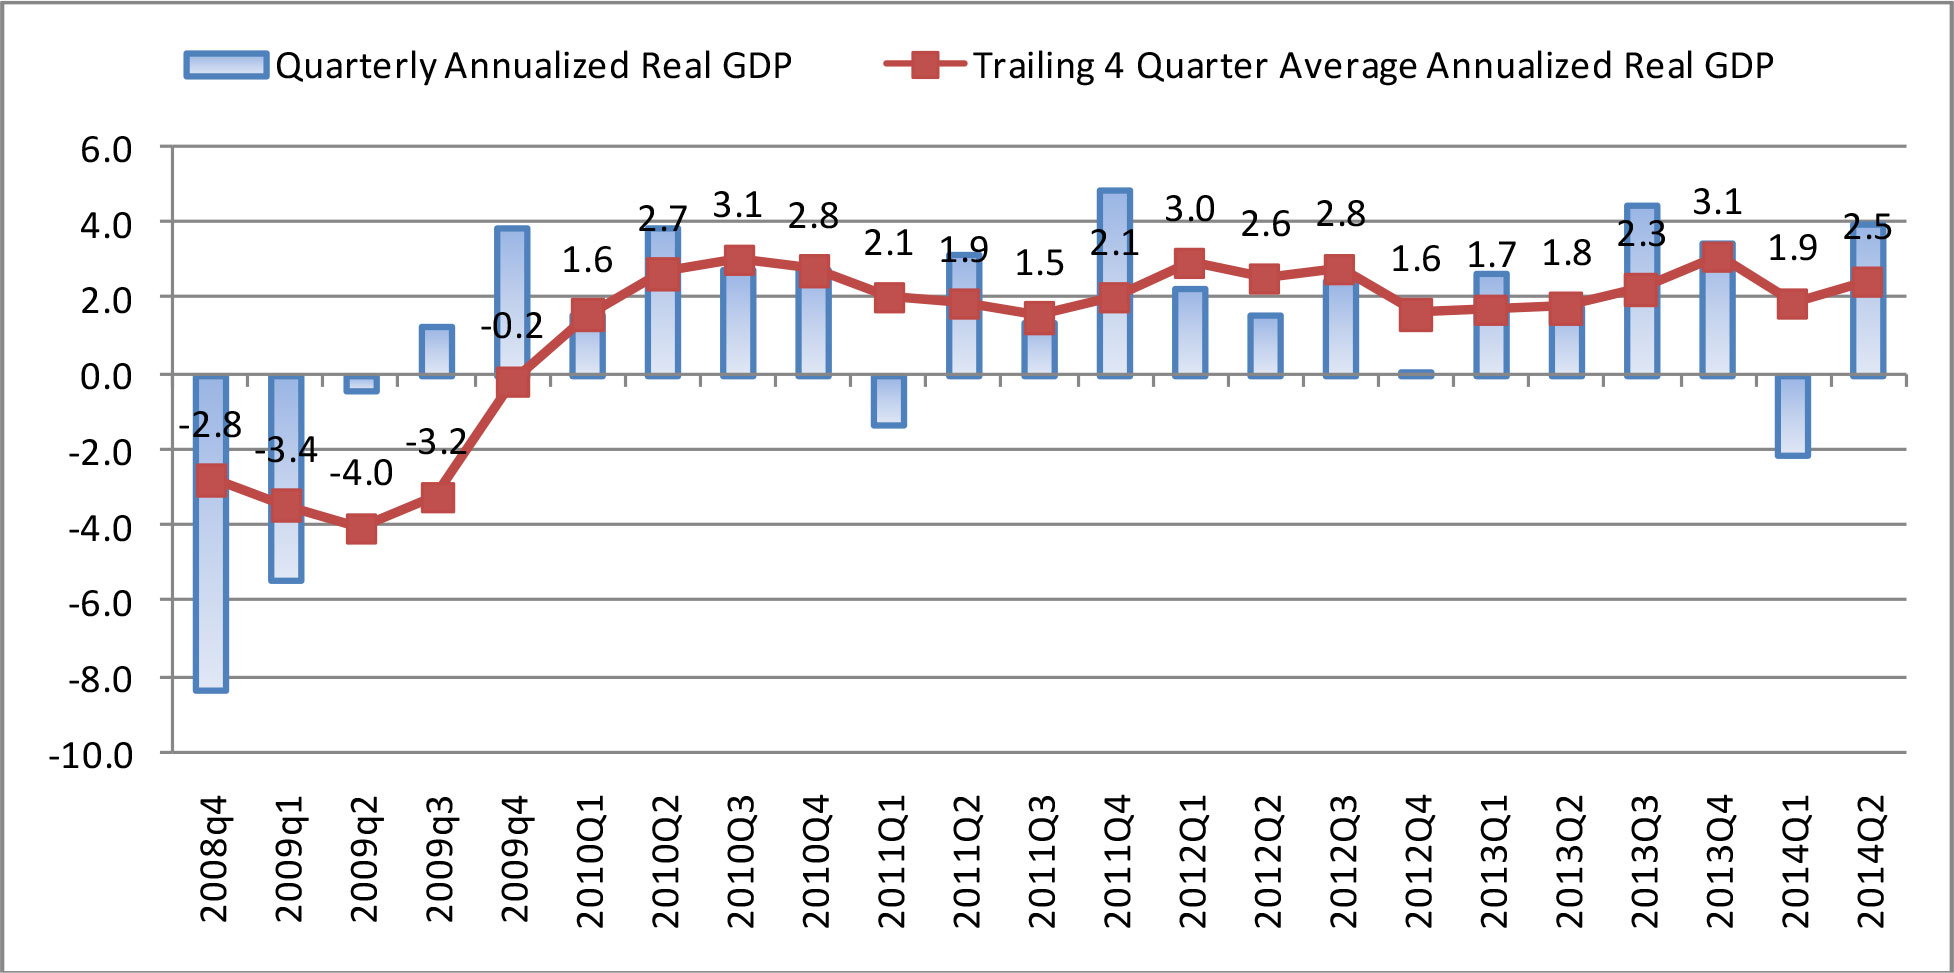
The 2014Q1 real GDP was revised from its initial +0.1% to -1%, -1.9%, -2.9% and finally to -2.1%2 . This is the worst performance of the U.S. economy since the 2009 recession. The “advance” estimate released by the Bureau of Economic Analysis for the second quarter came in at 4%. Although this number will likely be revised, the overall increase reflects the reversal from the first quarter contraction. Positive contributions came from personal consumption expenditures (PCE), private inventory investment, exports, nonresidential fixed investment, state and local government spending, and residential fixed investment. However, the average of the first two quarters is only 0.95% assuming the 4% second quarter number remains unchanged. In fact, even if the third and fourth quarter GDPs maintain the 4% real growth annualized rate, the real GDP for the year would be at 2.95%.
A less volatile way to measure the GDP is to look at the annualized real rate on a trailing 4 quarter basis. When viewed in this way, the U.S. economy has been range bound between the low of 1.5% to the high of 3.1% since the first quarter of 2010. Assuming no serious exogenous shocks, we expect the U.S. economy to grow at the annualized rate of no more than 3% in the second half of this year. This means, for 2014, we expect the economy to grow at around 2%. The U.S. remains in the protracted low growth economic environment, not too weak to expect a recession but certainly not demonstrative of an escape velocity to return to a 3.5% to 4% “normal” GDP world.
B. Employment – Steady Improvement
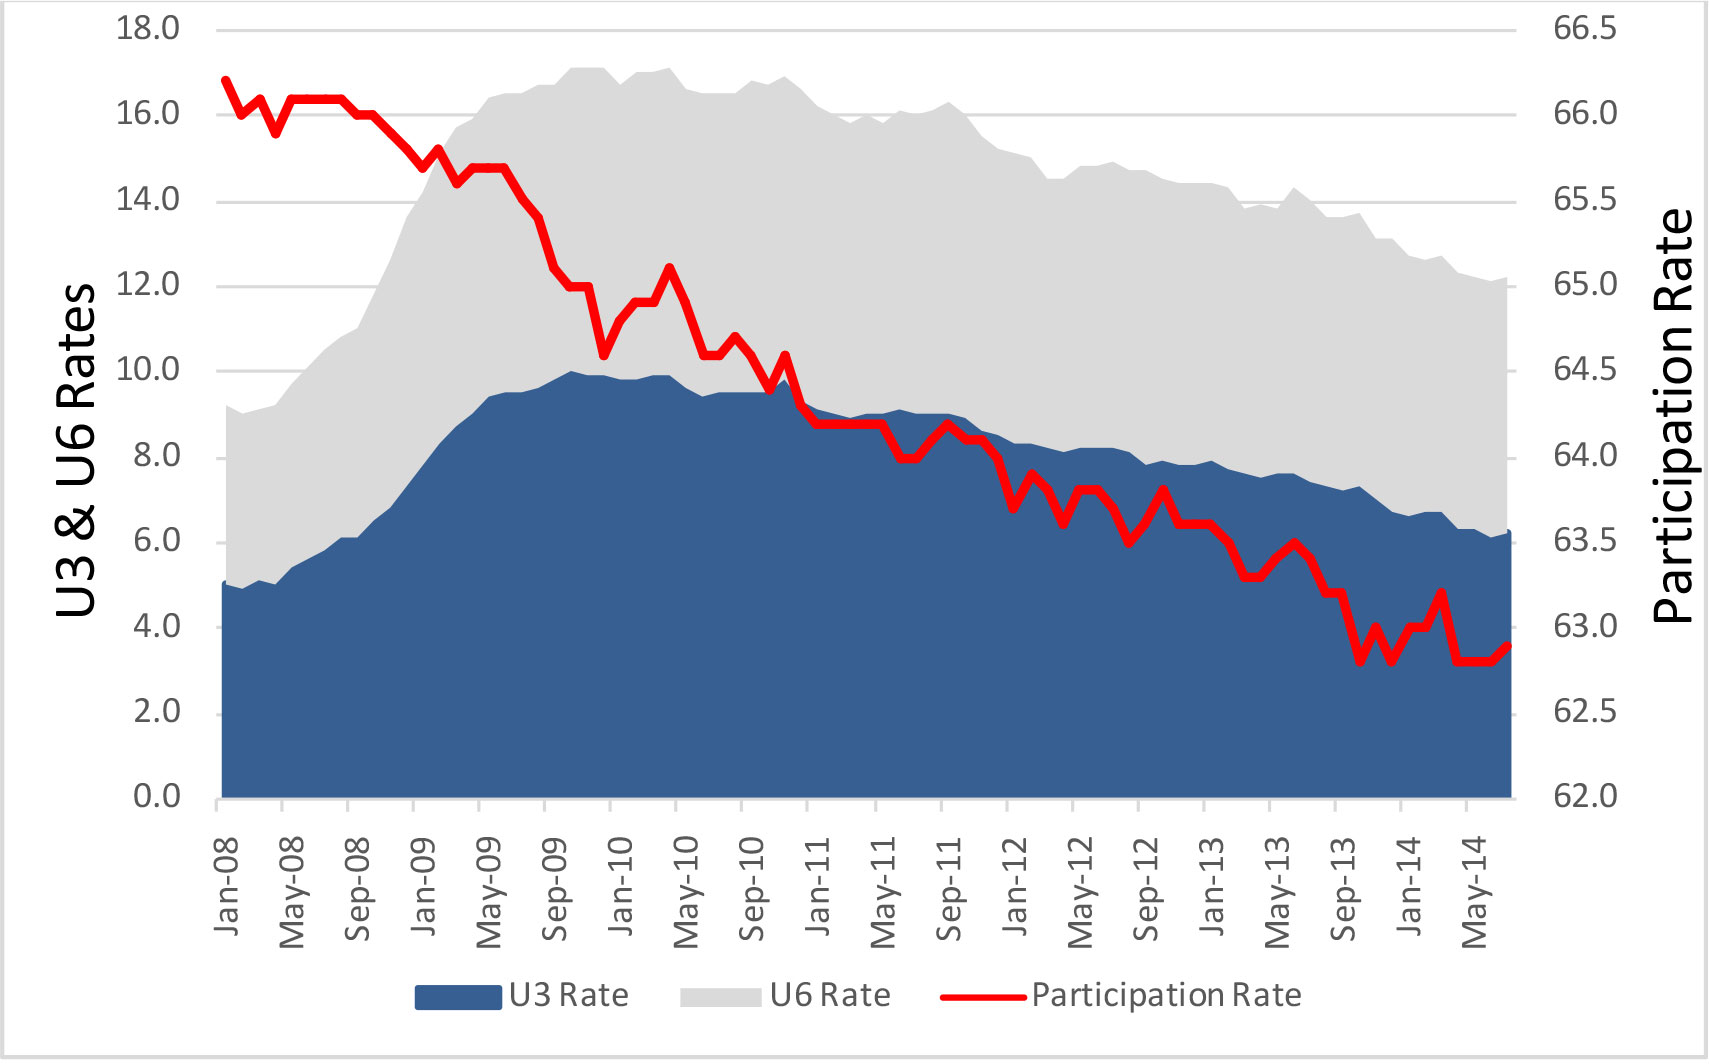
The July 2014 U3 rate was 6.2%, a slight uptick from June at 6.1%. This official unemployment rate3 defines unemployed as jobless individuals available and actively looking for work. The U3 rate has dropped by half a percentage point since December last year. The improvement is significant since it was at 7.4% in July 2013. However, the U3 rate excludes people who did any work at all for pay or profit during each survey reference week and does not necessarily represent the complete employment picture, especially during a drawn out recovering economy. In fact, the FOMC acknowledges the speed of the U.S. rate drop yet remains concerned about the underutilization of labor resources.
On the other hand, the U6 rate offers a measure regarding labor force utilization. The U6 rate includes the U3 rate and all marginally attached workers plus total employed part time for economic reasons, as a percent of all civilian labor force. Many workers are working in non-full time positions and in positions for which they may be overqualified. Although not counted as unemployed, these workers are underutilized.
Some observers point to the faster than anticipated rate of decrease in the U3 rate as suggesting that labor induced wage inflation is around the corner as more workers find jobs as the economy continues to normalize. There is no evidence of this however. In the meantime, the civilian labor force participation rate of individuals, age 16 years and over, remains at around 63%4 without any improvement. According to the Bureau of Labor Statistics (BLS), the labor force is made up of the employed and the unemployed. The remainder—those who have no job and are not looking for one—are counted as not in the labor force.
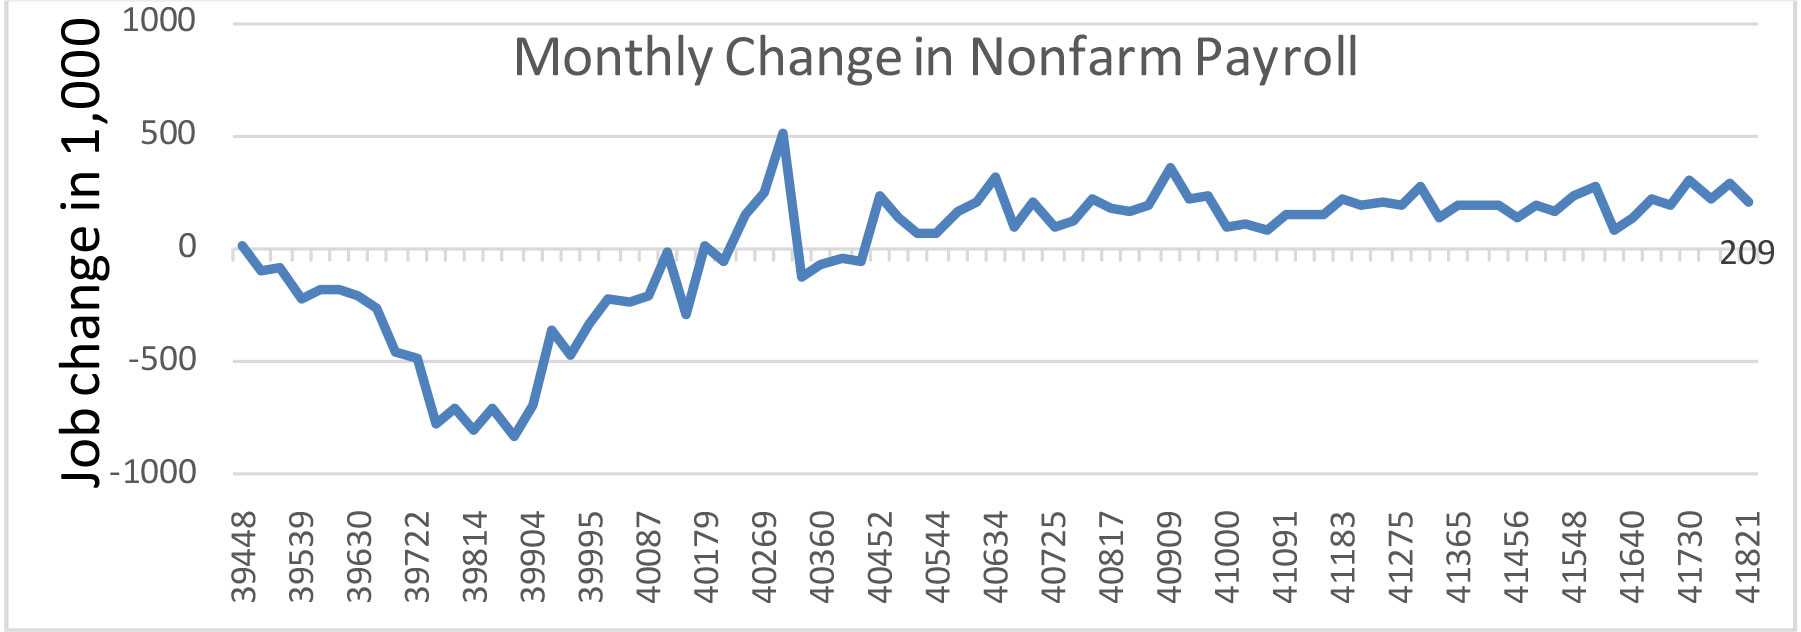
According to the January 2012 issue of the Monthly Labor Review article – Employment Outlook: 2010-2020 by Mitra Toossi5 , the U.S. labor force is expected to grow annually by 0.7% to a total of 10.5 million in the current decade. This works out to be approximately 1 million per year or an average of 84,000 new jobs per month. The following chart shows the monthly change in nonfarm payroll. With the average job creation of over 230,000 since January, it supports the gradual decline in U3 and U6 rates.
Based on BLS data, Dent Research6 examines all the private sector jobs added during each month across 84 different employment categories by wage. These are then grouped into 12 larger buckets. By measuring those additions against the existing spread of wages in the economy, the Dent Index provides a perspective regarding the quality of U.S. monthly job growth. According to Dent Research:
“in the month of May, the job market reached a bit of a landmark. We have regained all of the jobs lost since the downturn began in 2008. This is also the fourth month in a row of adding over 200K nonfarm payrolls, a streak not seen since the 1990s. The quantity is indeed good. The quality, however, is a different story. Despite this month’s gains, more than half of the jobs created were below the median wage of $22.95. Stunningly, nearly 30% of the jobs added in May went to the lowest wage bucket. In short; the low wage jobs recovery continues to march right along.”
A similar conclusion was reached by Dent Research for the June’s BLS data. This analysis supports the suspicion that more Americans are back to work but many are underemployed. On the one hand, this group is feeling better and lifts the economy by increasing their participation as consumers, but on the other hand, confidence and the volume of consumption are limited. There is no escape velocity and true animal sprit here.
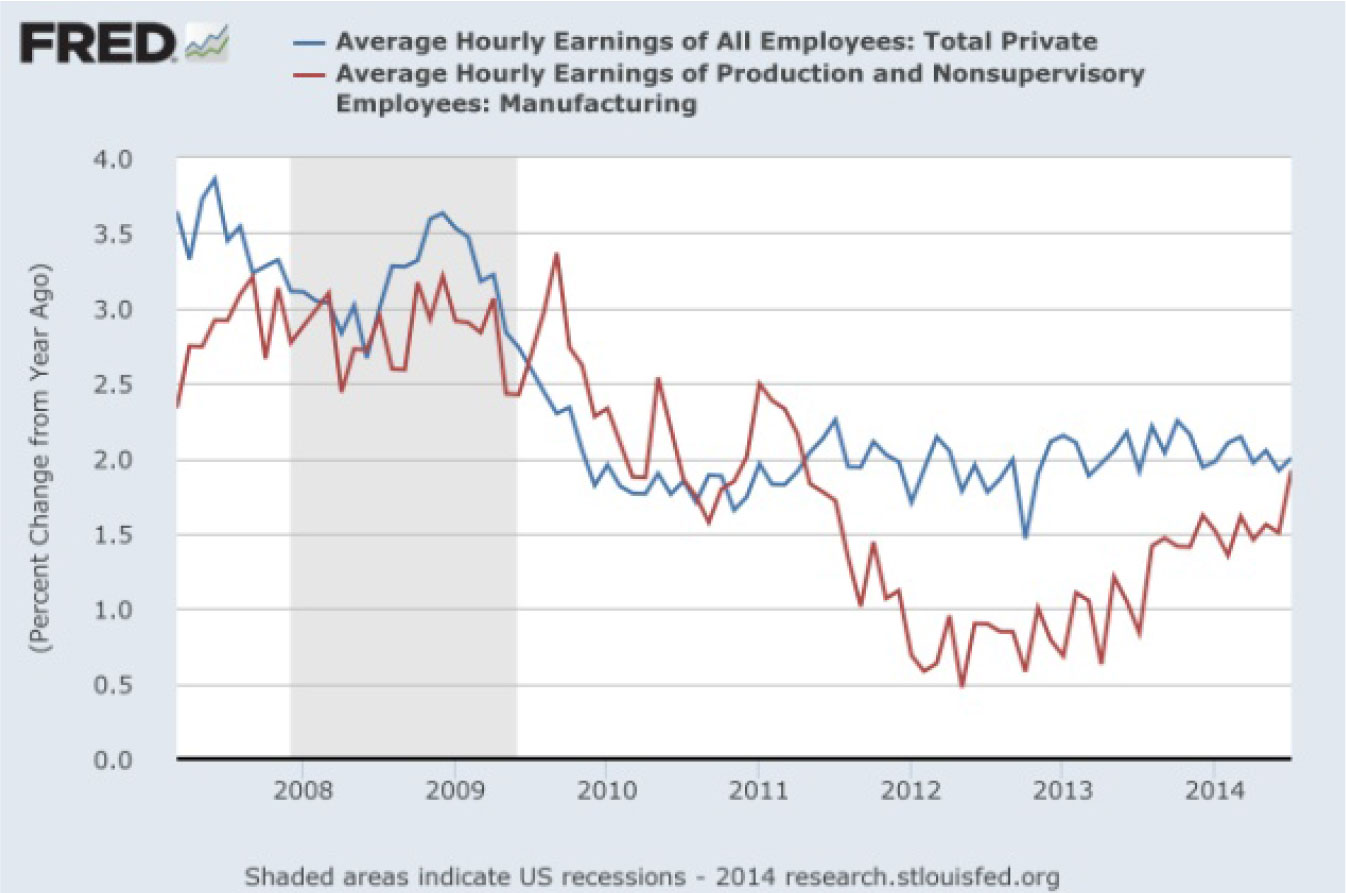
The graph above shows the percentage change in hourly earnings from the prior year (YOY). For an average employee there is not much wage growth. Although the earnings for production and non-supervisory employees in manufacturing have been rising, the rate of increase YOY remains anemic. This points to a recovering manufacturing sector but no real wage growth pressure. This also leads to low consumption recovery with no inflation pressure.
C. Debt & Wealth
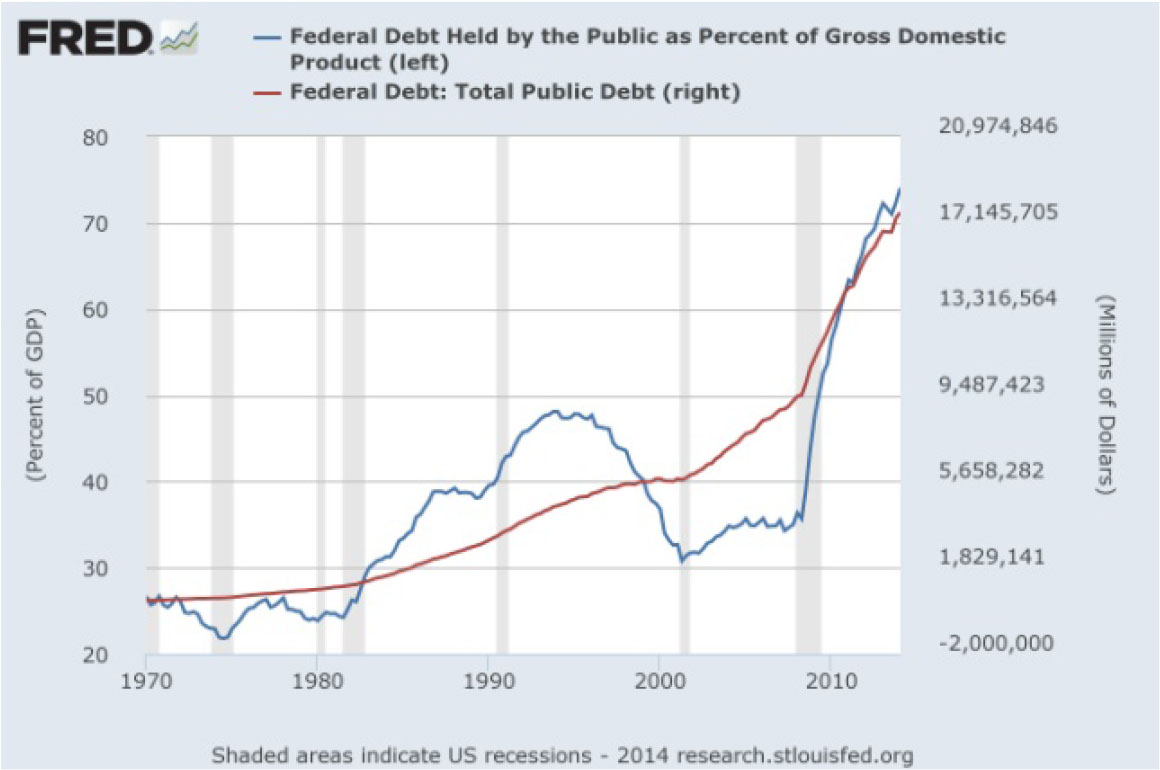
The federal, corporate and household balance sheets below offer some perspective about the economic environment.Although the annual fiscal deficit has significantly reduced since the financial crisis, the total public debt continues its march upward and as more Baby Boomers reach retirement age. According to the latest Trustees’ Report , Medicare’s hospital trust is projected to be exhausted in 2026 and Social Security will be in 2033. These will continue to place long-term pressure on the federal budget. More specifically, the ever increasing federal debt level has a dampening effect on the U.S. long term economic growth.
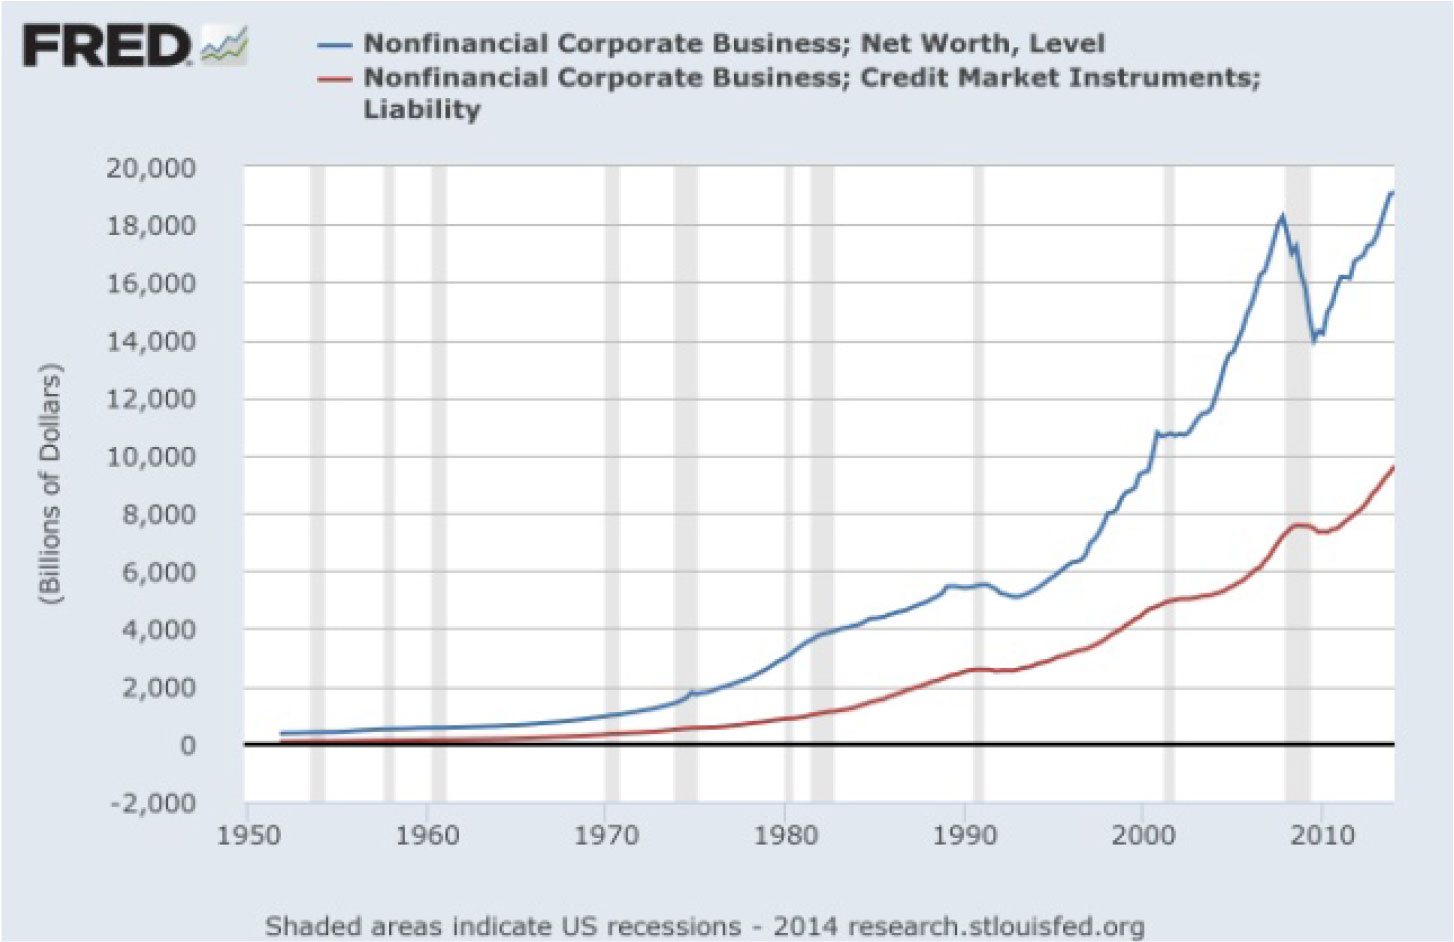
The case for corporate America is quite different. Company net worth has not only recovered to pre-crisis levels but exceeded them. With low borrowing costs, corporations have refinanced their debt at better to much better terms which lowered their interest expenses immediately and added the savings to their bottom line. However, the graph shows that corporate debt has continued to rise and is fueling the current merger and acquisition activities. It is cheaper to borrow than to raise money in the capital market.
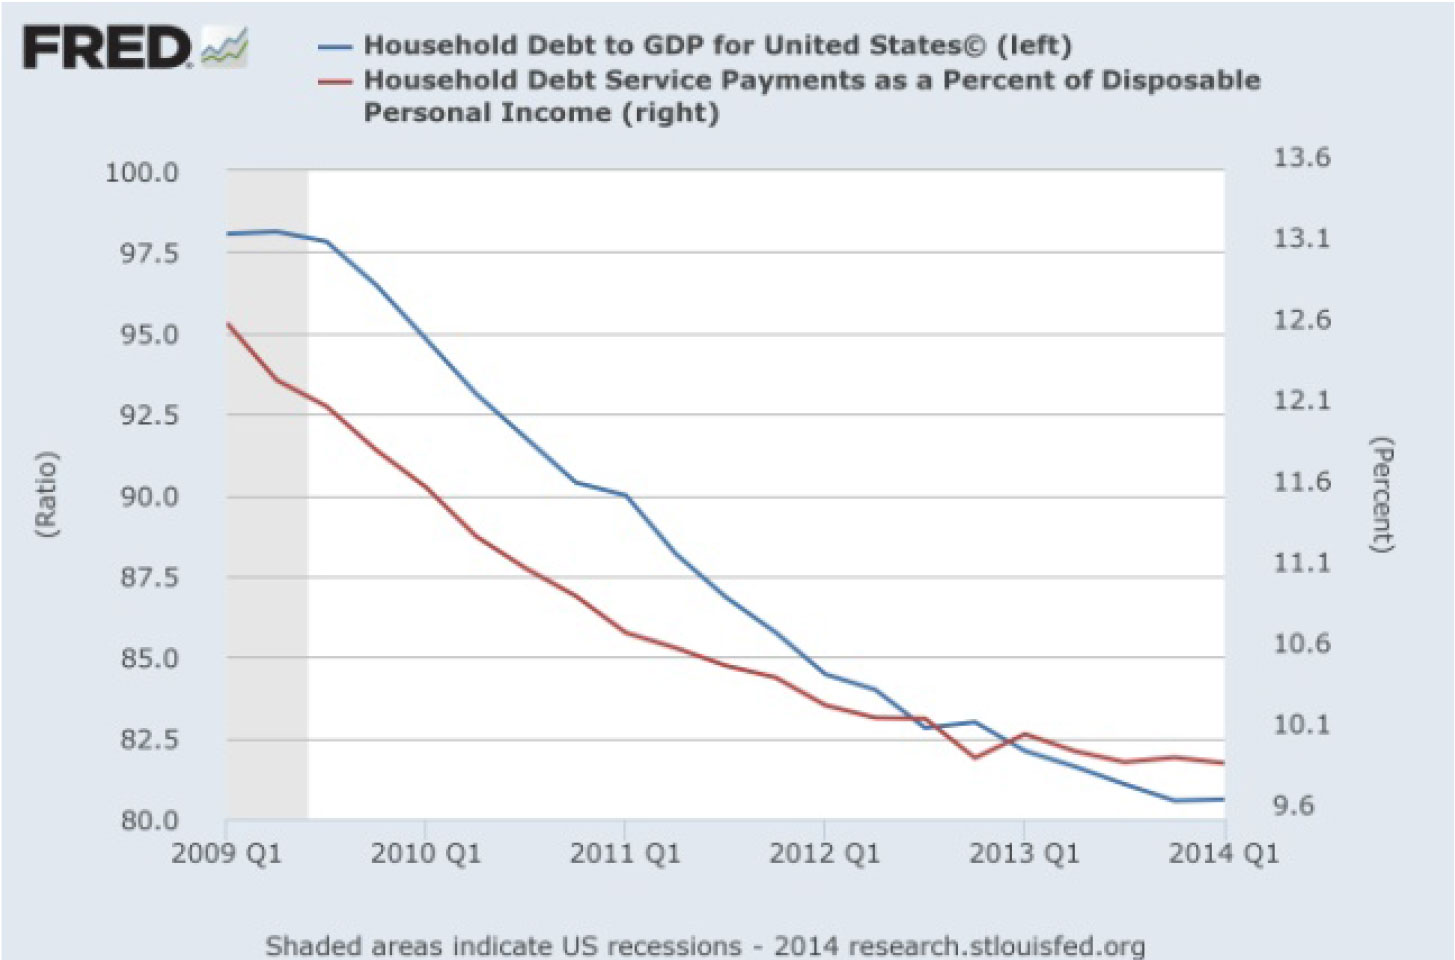
In the case of the consumer balance sheet, the picture is better as well with household debt (on an absolute and as a percentage to GDP) falling every year since the financial crisis. This helps to explain the lowering percentage of debt service as a percentage of household disposable income. However, with a stubbornly high U6 rate (or labor utilization inefficiency) coupled with low wage growth, the decreasing debt service ratio may not be enough to spur stronger consumer spending going forward. This potential lack of full confidence to borrow and spend will limit GDP growth and keep inflation in check as well.
D. Housing
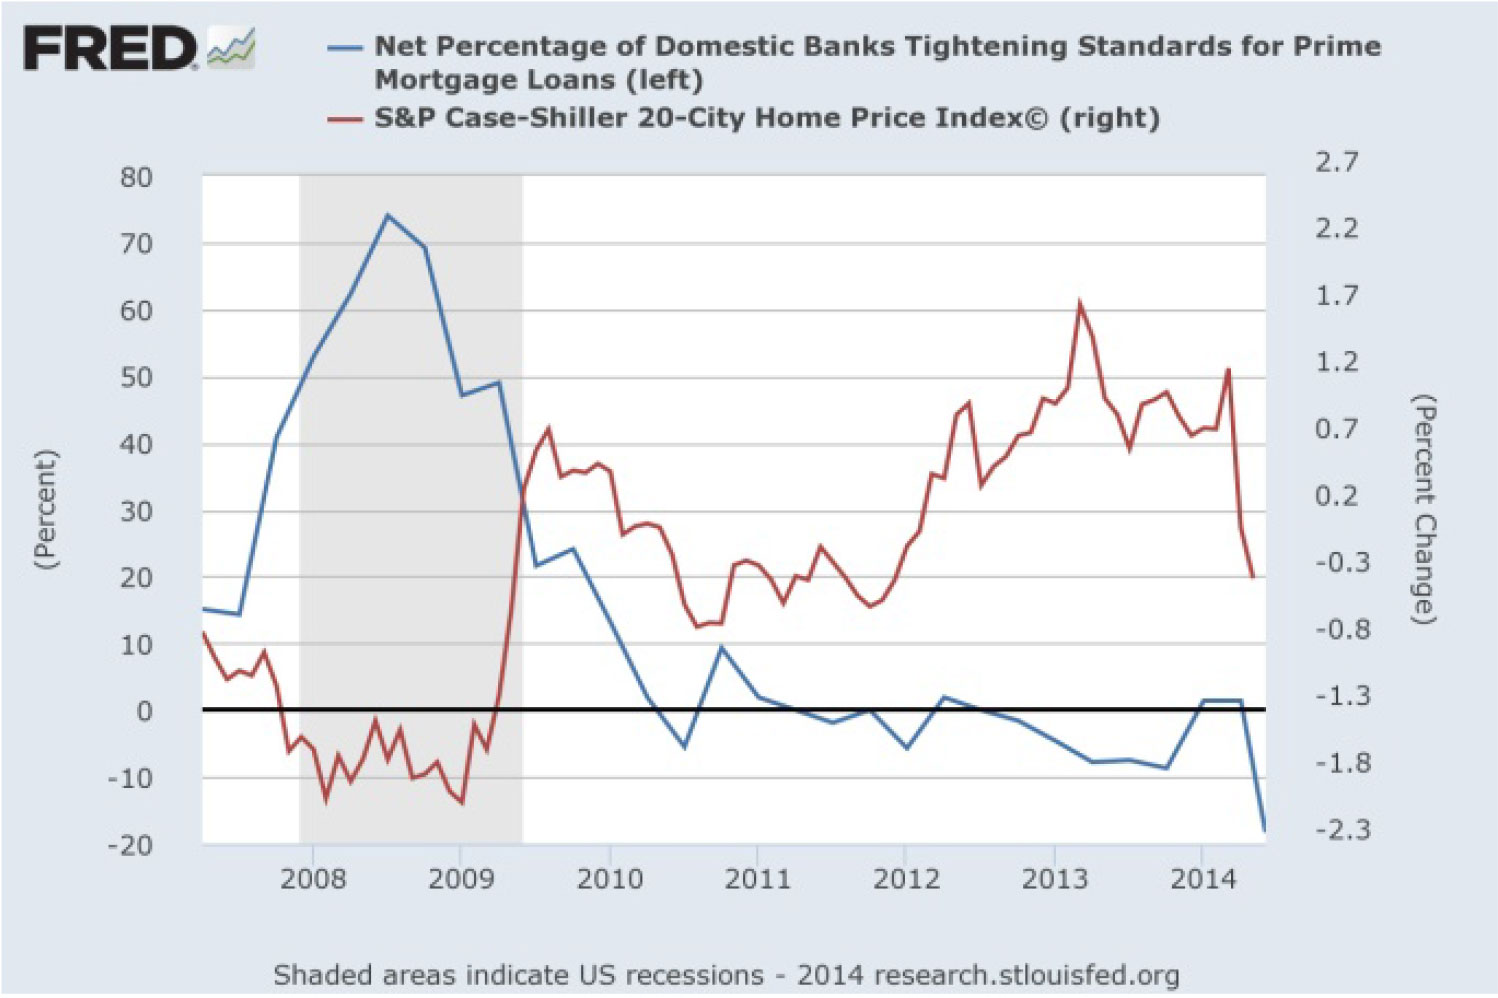
It was a housing led financial crisis in 2008, and it is a housing recovery that will lead to normalizing the U.S. economy. Signs were encouraging in the last couple years as housing prices began to stabilize and recover, but the picture is less certain today. According to the S&P/Case-Shiller Home Price Indices, data through May 20148 , the Composite Indices increased at a slower pace. The 20-City Composite gained 9.3% YOY, down significantly from the +10.8% returns reported in the prior month. All cities, with the exception of Charlotte and Tampa, saw their annual rates decelerate even as mortgage lending standards became more accommodative.
The YOY new home and existing home sales are not encouraging. Although there is a sign of improving existing home sales, new home sales appears to be slowing. During the first quarter this year, much of the slowing activities were thought to be weather related, but more recent data does not appear to show a significant pickup since then as weather returned to normal.
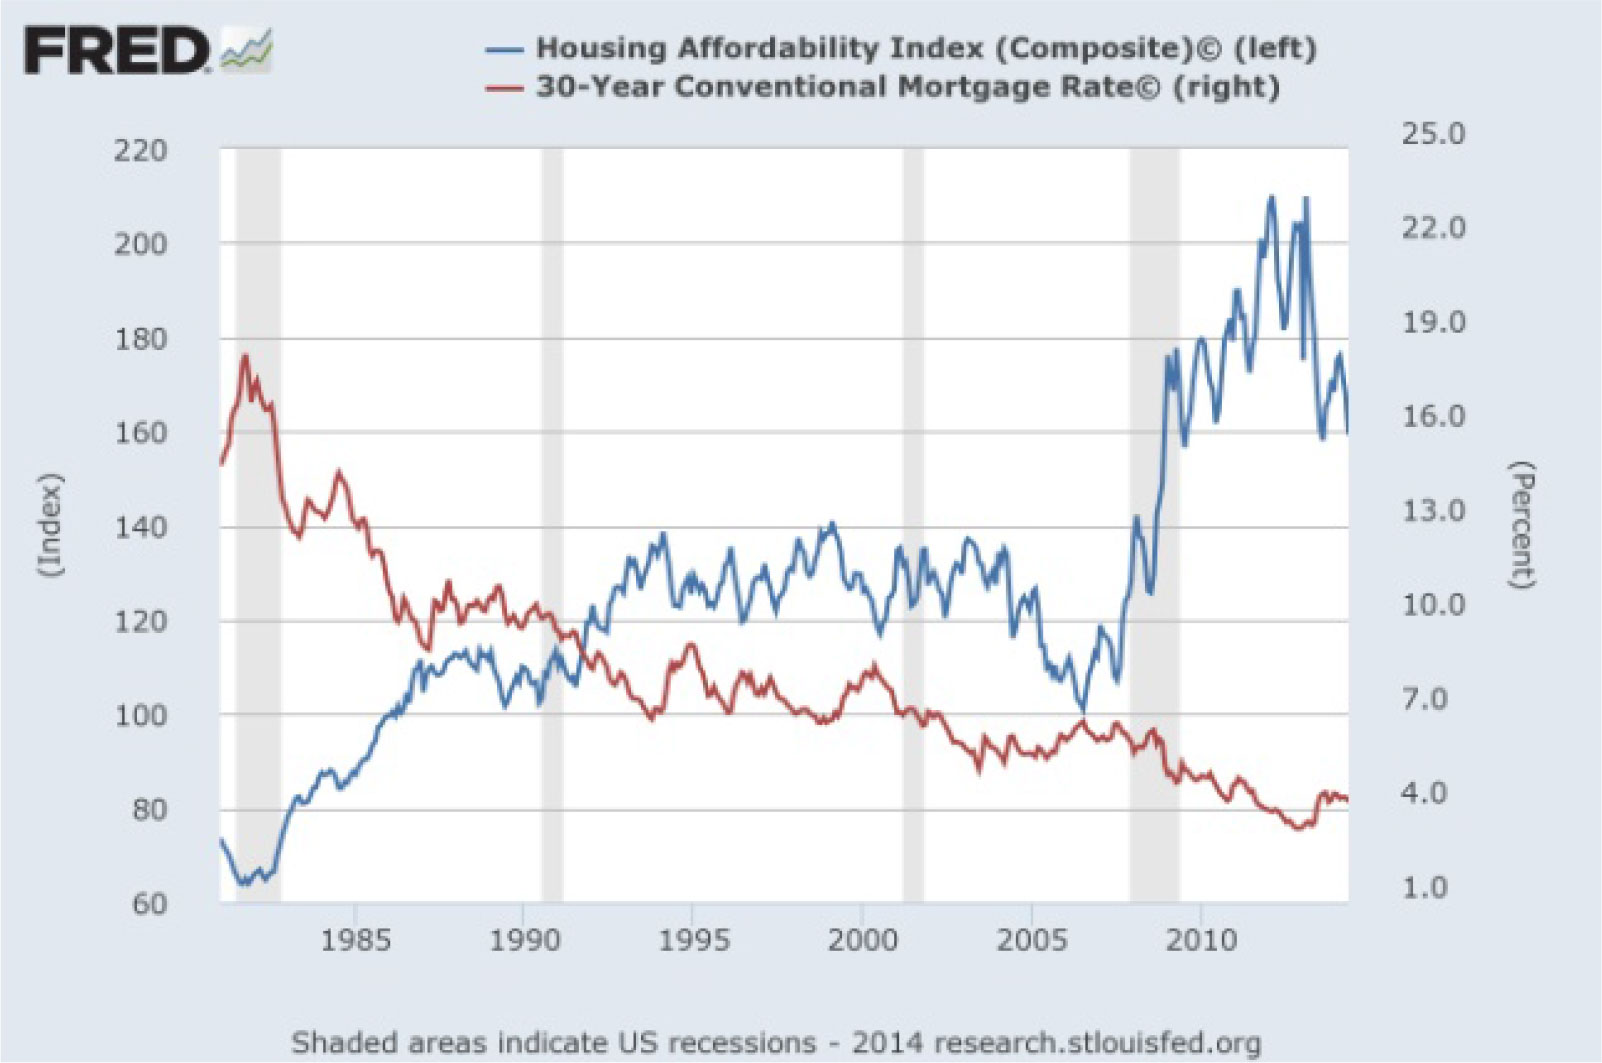
The rise in mortgage rates during the past year may not be sufficient to explain the housing picture as affordability remains high.
E. Inflation
The Federal Government produces two major inflation measures for consumption of goods and services. The Consumer Price Index (CP1), published by the BLS, is the most widely used aggregate price index, as well as the major source of information on price trends for individual consumption goods and services.
An alternative, aggregate consumption inflation measure, the Implicit Price Deflator for Personal Consumption Expenditures (PCE Deflator), published by the Bureau of Economic Analysis (BEA), is a by-product of the construction of the National Income and Product Accounts9 . It is the PCE index that is favored by the FOMC.
On July 22, the BLS10 reported that:
- The headline Consumer Price Index for All Urban Consumers (CPI-U) increased 0.3% in June on a seasonally adjusted basis and increased 2.1% over the last 12 months, unchanged as in May.
- Over the last 12 months, the all items index increased 2.1% (before seasonal adjustment) was primarily driven by the gasoline index. It rose 3.3% and accounted for two-thirds of the all items increase.
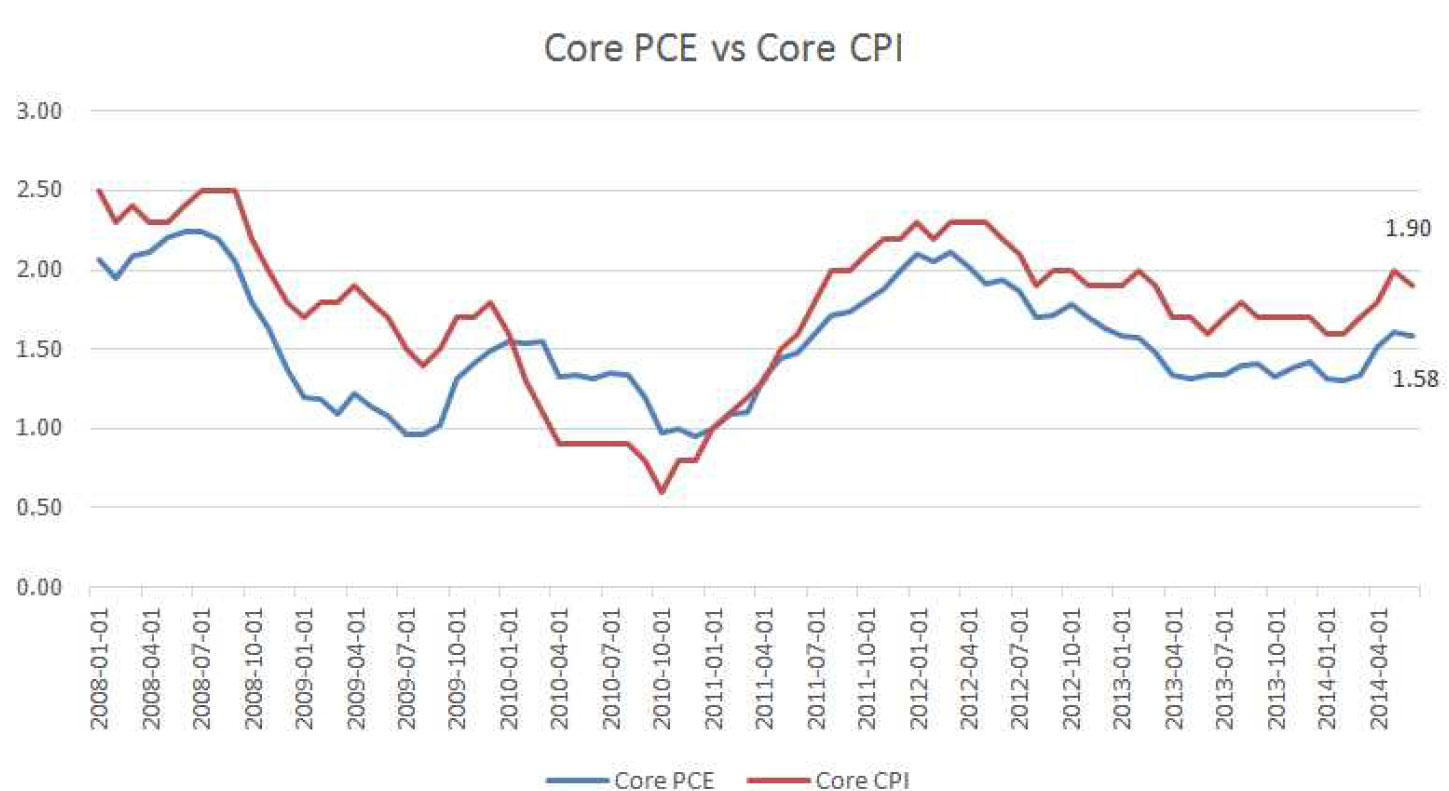
- The core index for all items (less food and energy) also decelerated in June, increasing 0.1% after a 0.3% increase in May. The core index rose 1.9% over the last 12 months, a slight decline from the 2.0% last month.
On August 1, the BEA11 reported that the price index for PCE increased 0.2% in June, compared with an increase of 0.3% in May. The PCE price index, excluding food and energy, increased 0.1%, compared with an increase of 0.2%.
Since the Federal Reserve and other policymakers tend to favor the PCE price index while the general public is more in tune with CPI, it is worth reviewing the difference between CPI and the PCE and to better anticipate FOMC actions. According to the BEA12 , there are four primary sources of difference between the two indexes. First, the CPI and the PCE price index are constructed using different index-number formulas. This difference is referred to as the “formula effect”. Second, the relative weights assigned to each of the detailed item prices in the CPI and in the PCE price index are based on different data sources. The relative weights used in the CPI are based primarily on household surveys, while the relative weights used in the PCE price index are based primarily on business surveys. These differences are referred to as the “weight effect.” Third, the CPI measures the out-of-pocket expenditures of all urban households while the PCE price index measures the goods and services purchased by households and nonprofit institutions serving households within the framework of the U.S. National Income and Product Accounts. This conceptual difference implies that some items in the CPI are out-of-scope of the PCE price index; that is, some items in the CPI are not included in the PCE price index. Even more importantly, some items in the PCE price index are out-of-scope of the CPI. These differences are referred to as the “scope effect”. Finally, there are a variety of other differences, consisting of seasonal adjustment differences, price differences, and residual differences. Collectively, these are referred to as “other effects”.
In general terms, the Federal Reserve is focusing on the index that informs on the goods and services consumers are actually purchasing rather than the monthly index that shows the changes in prices paid by urban consumers for a representative basket of goods and services. The bottom line is that the latest core CPE number is still well below the 2% base target. It is important to note that, according to the FOMC, the 2% target is the inflation rate floor and not necessarily a “trigger” for FOMC to take rate action. Moreover, the FOMC is interested in a higher inflation rate to root out disinflation and deflation expectations and to spur general economic growth and activities.
The Globe
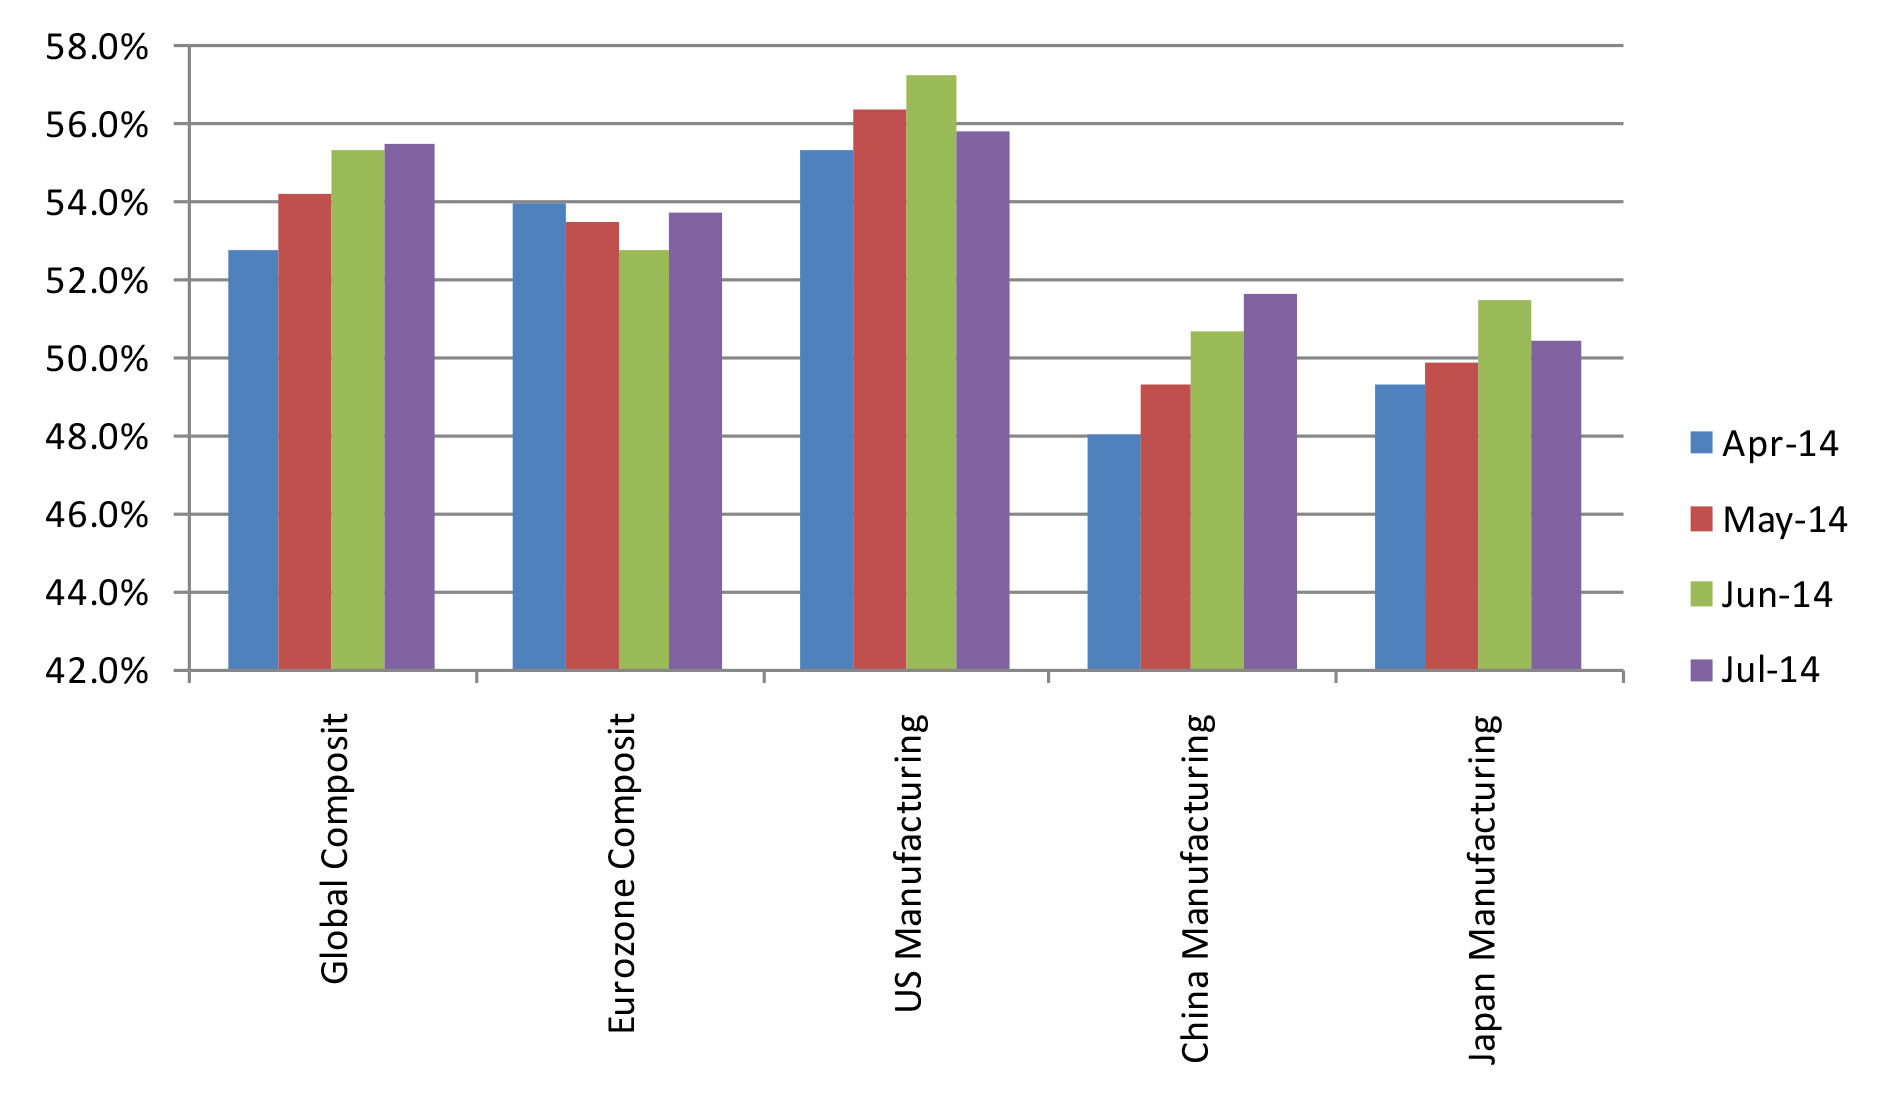
As reported by Markit, the PMI manufacturing indicators remain in positive territories for the major economies and economic zones of the world. Globally the economic indicators suggest steady expansion with the U.S. leading the way (although slowing a bit) and with China showing continuing signs of recovery and expansion. Japan is a bit worrisome and perhaps suggests that the 3-arrow approach may need to be reengineered.
The mid-year IMF World Economic Outlook Update13 released July 24th shows an 8% reduction from its April projection of world output at 3.7% to 3.4%, a drop of 0.3%. The following table is reproduced to show some of the major economies that contributed to the revision with the U.S. leading the way.
| Projections | Change from Apr 2014 | |||||
| Y2012 | Y2013 | Y2014 | Y2015 | Y2014 | Y2015 | |
| World Output | 3.50% | 3.20% | 3.40% | 4.00% | -0.30% | 0.00% |
| Advanced Economies | 1.40% | 1.30% | 1.80% | 2.40% | -0.40% | 0.10% |
| U.S. | 2.80% | 1.90% | 1.70% | 3.00% | -1.10% | 0.10% |
| Euro Area | -0.70% | -0.40% | 1.10% | 1.50% | 0.00% | 0.10% |
| Japan | 1.40% | 1.50% | 1.60% | 1.10% | 0.30% | 0.10% |
| Emerging & Developing | 5.10% | 4.70% | 4.60% | 5.20% | -0.20% | -0.10% |
| China | 7.70% | 7.70% | 7.40% | 7.10% | -0.20% | -0.20% |
| India | 4.70% | 5.00% | 5.40% | 6.40% | 0.00% | 0.00% |
| Brazil | 1.00% | 2.50% | 1.30% | 2.00% | -0.60% | -0.60% |
| Russia | 3.40% | 1.30% | 0.20% | 1.00% | -1.10% | -1.30% |
The ongoing aggression by Russia at the Ukrainian boarder, if not contained, will continue to pose real and psychological threats to the European economy and, to a lesser extent, the world. The economic and targeted sanctions by the U.S. and the EU have produced downward pressure on the Russian economy. However, if serious countersanctions are initiated by Russia or more systematic sanctions are imposed on Russia, the consequences may not be contained in Europe. These events will likely cause more downward revisions for 2014 and 2015 by the IMF. The financial markets thus far have not reacted to the geopolitical events in Iraq, Afghanistan, the Gaza Strip, Syria, and Libya. There is also the China and Japan dispute over a group of islands and the twin trouble makers of North Korea and Iran. In fact, the stock and bond markets have and continue to experience some of the calmest periods in recent memory. The U.S. stock market has not had a market correction (a 10% or more decline) since the low was reached on October 3, 2011. A market correction has historically occurred every 12 to 18 months. The obvious factor is the unprecedented global central bank policy of unlimited monetary support. Investors are led to believe that central bankers will be there to prevent every disaster and truncate the downside tail risks all together. This is dangerous as investor psychology can change quickly.
In the eurozone, although the collective economy has been out of recession, the structural reform that is needed to save the common currency and the need for more coordination among economies remain outstanding. The unemployment rate remains uneasily high, and economic growth is muted due to a variety of reasons to include demographic challenges. The biggest concern by the European Central Bank (ECB) is the gradual lowering of inflation expectation or the increased probability of long term deflation in the eurozone. The monetary policy decision of June 5th ushered in a negative yield. The ECB’s mandate is to ensure price stability by aiming for an inflation rate of below but close to 2% over the medium term. Like most central banks, the ECB influences inflation by setting interest rates. Since euro area inflation is expected to remain considerably below 2% for a prolonged period, the ECB’s Governing Council has judged that it needs to lower interest rates. The ECB has three main interest rates on which it can act: the marginal lending facility for overnight lending to banks, the main refinancing operations and the deposit facility. The main refinancing rate is the rate at which banks can regularly borrow from the ECB while the deposit rate is the rate banks receive for funds parked at the central bank. All three rates have been lowered. To maintain a functioning money market in which commercial banks lend to each other, these rates cannot be too close to each other. Since the deposit rate was already at 0% and the refinancing rate at 0.25%, a cut in the refinancing rate to 0.15% meant the deposit rate was lowered to −0.10 % to maintain this corridor. The cut was part of a combination of measures designed to ensure price stability over the medium term by the ECB and to sustain growth in the euro area. This was the first time a major central bank has moved rates into negative territory, but this is likely to be insufficient to drive down the euro and meaningfully advance economic activities and investments. Although Mario Draghi, the head of ECB, has repeated on numerous occasions that he will initiate broad-based asset purchases, no details or specificities of such a program have been communicated. Speculation suggests that this is easier said than done. In any event, the volume would be limited in comparison to Japan and the U.S.
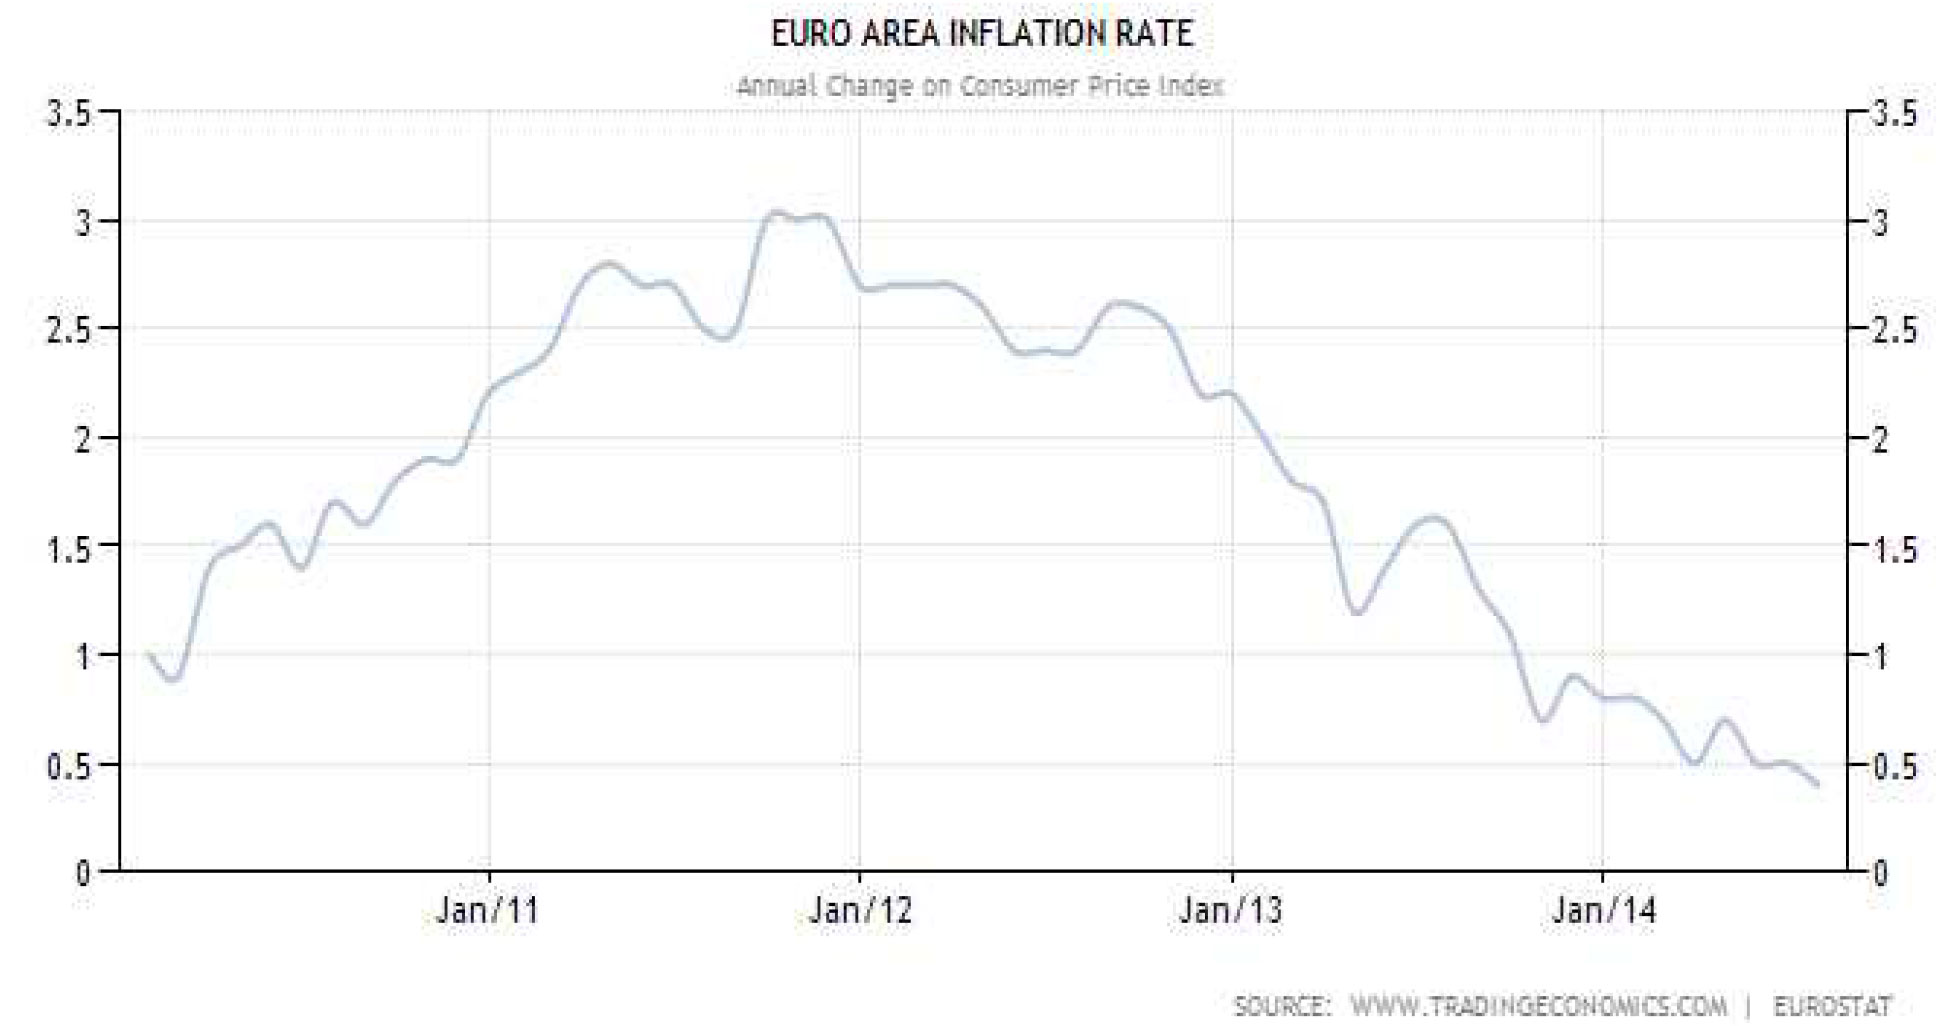
The eurozone inflation is currently at 0.4%, and the ECB has repeatedly stated that it will take extraordinary measures, to include the introduction of quantitative easing like policy to spur inflation and manage price stability.The current disinflation trend can be tipped over to deflation if geopolitical uncertainty between Russia and its neighbors influences the energy trade between Russia and Europe.
Conclusion
For the past five years, investors have been waiting for the end of financial repression where the savers are subsidizing the borrowers. With a real (after inflation) yield at a negative level for years, no one should be surprised investors have thrown caution to the wind and took on increasing risks in seeking return. Since last May’s taper tantrum, the bond investors have realized that they have overreacted globally, and we witnessed a decline in interest rates during the first half of this year. The combination of a weak U.S. GDP, a lack of inflation pressure, a general slack in U.S. labor and the global economic slowdown from China to South Africa leads us to believe that the foreseeable future looks more like the present. Investors often cannot differentiate their preference (wish) from the truth.
The Federal Reserve’s duel statutory mandates of seeking to foster maximum employment and price stability provides FOMC different ways to pivot as it navigates the monetary policy forward. As stated earlier, if and when the U3 employment gets too close to the 5% to 5.5% “normalized” level and the US economy remains in the New Normal range or anemic growth, the Federal Reserve will pivot towards the lack of inflation in the system and/or the lack of full utilization of the work force (i.e. U6 rate) to justify its continuing dovish stance. As the inflation rate reaches a sustainable 2% while the U.S. economy continues to expand slowly and is not expected to “normalize” (3.5% to 4% GDP) in the near future, the Federal Reserve will speak of the 2% inflation rate and inflation expectation as having always been a floor and not a trigger to raise rates, continuing to delay rate action.
The U.S. economy has shown many signs of recovery since the last recession, but this time is different than most other recessions which were not caused by a financial and banking crisis on a global scale. We have over-borrowed, overspent, overbuilt, over-hired and over-“expected” during the years that led to the crisis which led to a borrowing forward from future economic prosperity. In order to revert to the mean, we must experience multiple years of sub-normalized growth. There is no “free lunch”. Like many parents who love their children and try to minimize the consequences of their children’s poor choices and bad behaviors, the Federal Reserve is using every dollar they don’t have to minimize the economic and financial fallout from the last crisis. The hope is that the FOMC’s actions will last just until the right time where the general economy shows escape velocity in the U.S., and to a lesser extent globally, and then we will be back to a normalized economy without feeling the true consequences. Further, policymakers hope that this will not: 1) create unintended human behavioral consequences of market and asset bubbles, 2) trigger the downside to excessive risk taking and 3) result in high inflation.
The Federal Reserve is no different than the average person on the street. They have no idea what the facts on the ground will be in the future. They are navigating in uncharted waters. The FOMC is as much in the wait-and-see mode as we all are. Its forward guidance is nothing more than a wish list in an attempt to control the mass behavior from one meeting to the next. For investors, it is more important to examine economic data and draw reasonable conclusions about what prudent policymakers will likely do than to try to hang on to every word uttered during each the FOMC meeting to find consistencies and inconsistencies regarding their possible future posture.
Mohamed El-Erian once told his audience that policymakers are preoccupied by the journey and investors are only concerned about the destination. We witnessed this during the 2014 taper tantrum which led to a worldwide overreaction. Investors are always seeking where the “puck” is going, and often they are wrong. As the end of the taper nears, we will be awash in noise about the timing and the velocity of the Federal Reserve rate hikes. Uncertainty, thus market volatility, should increase (or normalize) since investors always overreact in anticipation of where the puck is going. If the US economy continues its sub-normal growth, the U6 rate continues to suggest a slack in labor utilization and inflation remains at or below 2%, the FOMC has no rush to end its near zero percent interest rate policy. This recovery is still fragile and continuing. The Federal Reserve does not wish to take action early and stalls or reverses the economic growth trajectory. In essence, they would rather be late in taking the punchbowl away. We maintain that the timing for raising rates will continue to be extended instead of sooner, and when rates rise it will be gradual and protracted as the Federal Reserve has always insisted.
- http://www.federalreserve.gov/newsevents/press/monetary/20130731a.htm
- http://www.bea.gov/newsreleases/national/gdp/gdpnewsrelease.htm
- http://www.bls.gov/cps/cps_htgm.htm
People are classified as unemployed if they do not have a job, have actively looked for work in the prior 4 weeks, and are currently available for work. Actively looking for work may consist of any of the following activities:- Contacting:
- An employer directly or having a job interview
- A public or private employment agency
- Friends or relatives
- A school or university employment center
- Submitting resumes or filling out applications
- Placing or answering job advertisements
- Checking union or professional registers
- Some other means of active job search
- Contacting:
- http://data.bls.gov/timeseries/LNS11300000
- http://www.bls.gov/opub/mlr/2012/01/art3full.pdf
- http://www.dentresearch.com/archives/press-release-dent-employment-index-reveals-poor-quality-jobs-created-may/
- http://www.ssa.gov/oact/trsum/
- https://www.spice-indices.com/idpfiles/spice-assets/resources/public/documents/103542_cshomeprice-release-0729.pdf?force_download=true
- http://www.bls.gov/opub/mlr/1981/09/art1full.pdf
- http://www.bls.gov/news.release/cpi.nr0.htm
- http://www.bea.gov/newsreleases/national/pi/pinewsrelease.htm
- http://www.bea.gov/scb/pdf/2007/11%20november/1107_cpipce.pdf
- http://www.imf.org/external/pubs/ft/weo/2014/update/02/
