As the end of the second quarter approached, the world has decidedly turned less positive. There are increasing signs that the world economy is slowing, and even though the U.S. economy is the “least dirty shirt” in the laundry, we are not immune from the 3-years and counting European financial-banking-sovereign debt crisis. The Great Recession officially began in December 2007 and ended in June 2009. During that period, 8.7 million jobs were lost and the U-3 unemployment rate was at 9.5% at the end of the recession. In the next 3 months, we will hear the Obama Administration and the Romney campaign tearing the statistics apart to support their own points of view. The reality is that this recovery/expansion has been tepid and the unemployment picture remains troublesome. As the world economy slows, depending on exogenous factors beyond our control, the probability of the U.S. entering into a new recession is increasing. At a below normal 1.9% real GDP growth, not too many factors have to go wrong for us to experience a back-to-back quarterly economic contraction.
US Unemployment
- U-1 = Persons unemployed 15 weeks or longer
- U-2 = Job losers and persons who completed temporary jobs
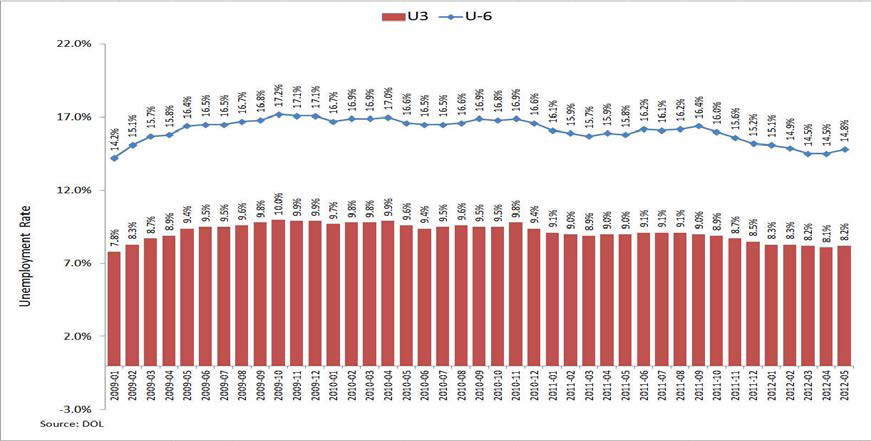
- U-3 = Total unemployed
- U-4 = Total unemployed + discouraged workers
- U-5 = Total unemployed + discouraged workers + all other marginally attached workers
- U-6 = U5 + total employed part-time for economic reasons
Here is a list of the latest unemployment statistics from the Department of Labor, as of June 2012. Over all, the employment market remains challenging with no change on the horizon:
- The number of long-term unemployed (those jobless for 27 weeks and over) was unchanged at 5.4 million. These individuals accounted for 41.9% of the unemployed and are often referred to as the “structural unemployed”.
- Both the civilian labor force participation rate (i.e. the % of working-age persons between 16 and 64 in an economy who are employed or unemployed but looking for a job) and the employment-population ratio (i.e. the proportion of the country’s working-age population that is employed) were unchanged in June at 63.8% and 58.6%, respectively. These rates reflect the weakness in the labor markets as well as the changing demographics (i.e. aging Baby Boomers retiring).
Historical labor force participation rate: Historical employment-population ratio: 

Source: DOL Bureau of Labor Statistics - The number of persons employed part-time for economic reasons (sometimes referred to as involuntary part-time workers) was essentially unchanged at 8.2 million. These individuals were working part-time because their hours had been cut back or because they were unable to find a full-time job.
- In June, 2.5 million persons were marginally attached to the labor force, down from 2.7 million a year earlier. These individuals were not in the labor force, wanted and were available for work, and had looked for a job sometime in the prior 12 months. They were not counted as unemployed because they had not searched for work in the 4 weeks preceding the survey.
- Among the marginally attached, there were 821,000 discouraged workers in June, a decline of 161,000 from a year earlier. Discouraged workers are persons not currently looking for work because they believe no jobs are available for them. The remaining 1.7 million persons marginally attached to the labor force in June had not searched for work in the 4 weeks preceding the survey for reasons such as school attendance or family responsibilities.

The graph above compares the rate of employment recovery 47 months since the beginning of each previous recession. It is clear that the damage from the Great Recession is still being felt. From a U-3 unemployment measure (the most often cited unemployment measure which does not paint a complete picture of the unemployed and under-employed) of 8.2%, we are back to the unemployment rate reported around February 3 years ago, in the depth of the Great Recession. From a U-6 unemployment measure (this is the most comprehensive measure) of 14.8%, our unemployment picture becomes more real and sobering. Without a meaningfully lowered U-6 rate as well as an improved civilian labor force participation rate, it is difficult to see how our real GDP will be back to “normal” (defined at 4% to 5%). If only 58.6% of us are working in this country, which includes the 6.6% that is made up of discouraged workers and all other marginally attached workers, aggregate demand is not likely to meaningfully and sustainably increase. This is the component that makes up 2/3 of the GDP.
The U.S. Economy – The Cleanest Dirty Shirt, The Smartest Kid in Summer School…

Since the end of the Great Recession, a pattern is emerging. The Federal Reserve instituted quantitative easing (QE1) to 1) ensure that there is plenty of liquidity among the banks and 2) put downward pressure on U.S. treasury yields so that all other fixed income instruments would also fall to stimulate borrowing and risk taking in the economy. QE1 was also put in place since Congress and lawmakers were reluctant to further loosen fiscal policy and increase public debt. The additional rationale was to ease the economic handoff from government (TARP) to the private sector. This worked for about 4 quarters;then the economy began to show weakness. QE2 was instituted. This, combined with the long-term refinancing operations (LTROs) from the European Central Bank (ECB), reignited the economy and pushed the 4th quarter real GDP to 3%. Since then, the U.S. GDP is back down to 1.9% and the consensus view is the same or worse for GDP rates for the remaining quarters this year. Many are expecting a slower 2013 with a few forecasting a recession. The Federal Reserve in its statement after a twoday meeting announced the extension of its Operation Twist until the end of 2012. The original Operation Twist scheduled to expire on June 30th is now increased by $267 billion and extended to the end of 2012 to bring down borrowing costs.
The DOL again confirmed that the real GDP for the first quarter grew at an annual rate of 1.9% in the first quarter. Although the headline was not changed, contributions of several components were modified. Consumer spending was revised down (+2.5% vs. +2.7% previous estimate).Equipment and software were revised down (+3.5% vs. +3.9% previous estimate).Exports were revised down significantly (+4.2% vs. +7.2% prior estimate).Inventories and imports (+2.7% vs. +6.1% prior estimate) were also revised down significantly. Residential investment expenditures (+20% vs. +19.4% prior estimate) and structures (+1.9% vs. -3.3% prior estimate) were raised. In addition to the upward revisions, a smaller trade gap also helped to offset the downward revisions and leave the headline unchanged. This suggests that we are more affected economically by the mess in the euro zone (EZ) and that consumers are not eager to spend. The bright spot seems to be construction and housing. As stated in our last commentary, we expect the housing sector to bottom and stabilize this year. It appears that:
- As evidenced by the GDP quarterly numbers, the private sector is not ready for a complete handoff from the government (fiscal or monetary).
- The stimulative impact from monetary action on the general economy is successively reduced.
- A new round of quantitative easing (i.e. QE3) may be viewed by the Federal Reserve or market participants as necessary or encouraged as the effect of the QE2 has waned and the TWIST extension may not be impactful at all.
The U.S.’s relative cleanliness may be subject to debate by investors. However, the debt ceiling and fiscal cliff issues will come into focus soon and the dirt will become more evident.
Synchronized Slowdown – No Decoupling
Even though we are the cleanest shirt in the laundry, the dirtiness of the laundry still matters. There was a lot of speculation at the beginning of the Great Recession that there may be an economic decoupling among the world economies where emerging markets would continue to thrive even as advance economies suffered under the heavy burden

of debt and deleveraging. So far, this has not been the case. The world is linked by trade and markets and what happens in advanced markets does impact the rest of the world. This should not be a surprise. According to the International Monetary Fund (IMF), the total world GDP in 2011 was almost $70 trillion, of which European Union, U.S. and Japan represented 55%. Moreover, according to Eurostat’s March 2012 China EU Bilateral Trade and Trade with the World Report, in 2010, China’s total imports were€ 966,863,000,000. EU(27), US and Japan represented € 337,877,900,000 or 35% of the total imports to China. For the same period, China’s total exports to the world were valued at € 1,172,452,000,000. EU (27), US and Japan represented
€ 541,581,500,000 or 46% of the total exports from China. This is a sizable portion of the total China export, and with the economic contraction in EU, the sluggishness persisting in Japan, and thegrowing sign
 |
 |
of a slowdown in the U.S., China’s economy is slowing as well. This has been much anticipated. The question for over a year now has been will it be a hard or soft landing in China. Of course the issue is more complicated than just China’s export dependence. Chinese real estate bubble, real estate loans and bad debts carried in the banking system, change in leadership, high savings rate (i.e. relatively low domestic/consumer demand) and the general reliance on public sector funding are all factors, but China will not be able to sustain its lowered target of 7.5% (from 8%) economic growth if the advanced economies continue to slow.

The Wall Street Journal tracks a number of economic statics regarding the countries that make up the EZ. According to their data sources, the southern European or fringe countries are expected to remain in recessions or economic contractions for 2012 with almost all countries moving back into the positive growth territory in 2013. The recovery is likely to be weak, and at a projected 1% growth, most people will not likely notice the difference between expansion and contraction. Thus it would not take much to tilt the EZ back into contraction in 2013.

The two indicators that offer a general sense of how the EZ is doing are unemployment and debt to GDP ratio. It is clear that austerity (cutting public spending and breaking social contracts) measures alone are not or have not demonstrated to be sufficient to bring highly indebted countries back to health. Focusing on bringingthe fiscal excesses of the past in line with today’s reality will not be enough to solve the ongoing sovereign debt crisis. Growth and increasedrevenue must also be part of the solution. Unemployment is a real challenge for the EZ. According to the Eurostat data and projection, the unemployment rate for every European country is projected to worsen with the exception of Austria, Germany, Finland, and Estonia. With a deteriorating employment picture, it is hard to imagine a sustainable revival of the EZ economy. In the case of Spain, Greece, and Portugal, the lack of jobs or growing unemployment will add to civil unrest and political instability, which further exacerbates downside risks and uncertainty on all levels. A sign of concern is the youth unemployment rates.

Young people continue to bear the brunt of the jobs crisis, with nearly 11 million 15 to 24-year-olds out of work in OECD countries in early 2012. Youth unemployment in the OECD area in March 2012 was 17.1%, close to its November 2009 peak of 18.3%.The unemployment rate for every OECD country has increased since December 2007. As of March 2012, the youth unemployment in Spain and Greece is over 50%. According to the DOL, the June 2012 youth unemployment rates remain significant. Almost 36% of young people between the age 20 and 24 (not suffering a disability)are unemployed.
|
June 2012 — U.S. Youth Unemployment Rate (%) |
||
|
Age 16 to 19 |
Disability |
No Disability |
|
88.8% |
67.5 |
|
|
Age 20 to 24 |
Disability |
No Disability |
|
68.8% |
35.9% |
|
The following chart summarizes the sovereign debt amounts and as a percentage of GDP for each EZ country.

With the exception of Estonia, Luxembourg, and Germany, all other countries have experienced an increase in debt-to-GDP-ratio. This could mean that a country was operating in the red and needed to borrow; its economy shrank thus making the debt burden increase; or a combination of both factors. Only 5 countries remain below the EU standard of 60% coverage ratio, and Germany is not even one of them.

Debt coverage ratio for each country provides a general sense of how well austerity and growth are balanced. There are many ways to bring existing sovereign debt (and for that matter, personal debt) in line: 1) shrink the total debt by renegotiating the terms with the lenders or through default or bankruptcy, as in the case of Greece; 2) find a third party who has deep pockets to buyout the existing debt and provide better repayment terms, such as the ECB, IMF, and EC; 3) grow the economy so that the debt service and level become more reasonable. Along the way, it is critical that no new debts are added to make up for annual budget deficits. The consequence of fiscal austerity is the shrinking of a country’s total production and a reduction in domestic aggregate demand. In the case of Greece, the economy is now forecasted to contract by as much as 6.9% this year, against earlier projections of 4.5-4.7%. Revenues are lagging budget targets by about €1bn in Greece.It is not certain that there will be enough cash to pay August pensions and salaries.A negative feedback loop can easily be envisioned where severe austerity without growth will lead to economic depression, default and political instability. Recognizing this, the European leaders have agreed to a fiscal pact (a precursor to fiscal union) which contains two rules: 1) each country is only allowed a maximum structural deficit of 0.5% of GDP per year and 2) the debt-to-GDP ratio must be reduced by one twentieth of the difference between the current debt ratio and the target of 60%.These conditions are not likely to be met by heavily indebted countries exerting austerity.
Although the entire EZ is not technically in a recession and some economists do not expect the EZ to be officially in a recession until 2013, the signs of economic slowdownareundeniable. The June data shows worsening manufacturing activities globally.

Global Purchasing Managers’ Index (PMI) and GDP are both trending down. PMI is at a 3-year low in June with manufacturing contracted for the first time since last November and growth slowed to nearstagnation in services. Even for the U.S., the manufacturing sector showed a below 50 reading in June, which mean contraction. The downturn is global and a sign of how economically linked we all are.

According to the National Bureau of Statistics,China’s GDP product expanded 7.6% in the second quarter from a year earlier. The pace, a three-year low, compares with an 8.1% gain in the previous period and the 7.7% median forecast of economists. Industrial production increased at a slower pace in June while retail sales growth also decelerated. This is a show of caution by the Chinese consumers. The slowing Chinese economy has already shown its impact on the global commodity markets.
How Low Can We Go?
The policy response by central banks in light of their respective economic slowdown is to lower rates and expand their balance sheets.

The ECB cut its main refinancing rate by 0.25% to a record 0.75% on July 5 and cut the deposit rate to 0% for the first time. On the same day, the People’s Bank of China (PBoC) cut its benchmark one-yearlending rate by 0.31% and one-year deposit rates by 0.25%. This was the second cut in a month and also announced that banks could setlending rates 30% below the benchmark level, up from 20% previously. Also on the same day, the Bank of England’s (BOE’s) Monetary PolicyCommittee (MPC) expanded its gilt purchase scheme by £50 billion, to be spread over four months.The stimulus now totals at £375 billion. MPC cited the decline in output over the last two quarters, the stress on UK exports from theeurozone (EZ) crisis and continued uncertainty about the EZ as contributing factors to an overall pessimismover the UK economy.
Since the (seemingly) coordinated central bank actions and, as of last week, the 2-year rate for German bondswas at minus 0.013% (the record was -0.018%on July 6) and the 10-year bond is at a record low of 1.31% (down from the last sale in June 13 at 1.52%). The continuing movement to German bonds suggests that investors are moving further away from bonds of marginally sound European countries and seeking safety at all costs. At the same time, the British pound rose to the strongest since November 2008 while the 10-year gilt yield fell 0.03%to 1.56% after declining to 1.55%, the lowest since June 1. On July 11, the Banco Central do Brasil reduced its benchmark Selic lending rate by 0.50% to 8%. This represents the 8th straight time in cutting rates as Brazil struggles to kick-start economic growth. Its retail sector showed sales had suffered their biggest monthly decline in May since 2008.On July 12, South Korea’s central bank cut the base interest rate for the first time since 2009 in response to its slowing economic growth of 2.8% in the first quarter, the weakest level in two and a half years, but being an export dependent country, this interest rate action may have little effect. However, the Korean’s household debt-to-income ratio is more than 150%, and this action may help to slow delinquencies and personal bankruptcy rate.
Return Of and Not On Capital

Financial Repression (please refer to our last quarterly comments for a more in depth discussion) is in full force globally and has been so since the beginning of the Great Recession. Today, investing in 10-year or less U.S. treasuries delivers a negative real rate of return. We are worse off if we invest in the German bond where their nominal yield is negative (i.e. before adjusting with inflation). No matter how uncomfortable, investors and savers are exchanging investment return for safety. The fact that investors (most likely Europeans) are willing to pay the German government to keep their money on deposit is an alarming statement about the current state of the EZ. So for the foreseeable future and for as long as there is a great deal of uncertainty and during the periods of risk-off, investors will continue to keep or drive down longer term bond yields of those countries that are deem to be “safe”. Consumers are reducing debts and reigning in spending; corporations are holding off investing, M&A and hiring. Investors are concerned with all the policy risks and economic malaise. There is no wonder that the general mood is solemn and appetite for risk is low. Governments, through their central bank actions, are taking full advantage of this and keeping the front end of the yield curve at or near zero in the name of “stimulating the economy” while making their debt repayments less burdensome.
Is this a European Banking or Sovereign Crisis?
According to the Bank of International Settlement 82nd Annual Report, dated June 24, 2012 (“BIS 2012 Report”), three groups of economic actors must take specific actions that may negatively impact each other. The financial sector must realize the losses and recapitalize (e.g. the Spanish banks that have waited to recognize their real estate loan losses). The private sectors must deleverage (e.g. the process of default, bankruptcy and reduction of consumer and residential real estate debt in the U.S. as well as the speed in which corporate America has repaired its balance sheet over the past three years), and the public sector must place its fiscal trajectories on a realistic and sustainable path forward. With significant and growing public burden, policymakers have little fiscal policy room to maneuver. Central banks are forced to step in to take progressively less effective monetary action. The following flow chart found in the BIS 2012 Report shows the vicious cycle in which the central bank plays a central part.

When the EZ trouble first surfaced, many observers called it a sovereign debt crisis, where the governments of PIIGS have borrowed beyond their means the impact of the Great Recession exposed their inability to service or repay their debt. Further, the Great Recession initiated shrinkage of cross-border lending and an overall contraction of credit, and made financing scarce and expensive (liquidity crisis). Other observers called it a liquidity crisis. This means that either there is a mismatch of income and expenses or assets and liabilities that caused a freezing up of the sovereign bond market or creating temporary market illiquidity. The way to solve this problem was to make credit available. Still others called it a banking crisis. In reality this is a sovereign-banking crisis. The first sentence in the Euro Area Summit statement issued after the latest meeting of the EU leaders on June 29, 2012, states that “[w]e affirm that it is imperative to break the vicious circle between banks and sovereigns.” European banks have always played a central role in each sovereign state. Unlike the U.S., the corporate bond market is much less developed in the EZ and companies have always relied on banks as the way to raise funds. A case in point, JP Morgan, the largest bank in the U.S., has liabilities equal to 13% of U.S. GDP. By contrast, 20 European banks have liabilities of more than 50% of their home country’s GDP.Even though the European banks are large and global in nature, they remain the responsibility of their respective home countries when they get in trouble and can become a financial threat.

Source: Barclays Capital
More importantly however, sovereigns have also looked to banks as a convenient outlet and holder for public debt.When banks invest and hold government debt, regulators generally have a low or lower capital reserve requirement against such debt since they are considered risk-free by rating agencies or national regulators. (Such assets are deemed to be convertible to cash at low transaction costs and at face value.) In fact, domestic sovereign debt may receive a higher preferential treatment and be assigned by regulators an even lower risk for regulatory capital reserve purposes. This allows banks to operate with very thin capital-to-asset ratios. This perverse arrangement allows governments to always have a source to lay off their debt and to keep borrowing costs low due to the consistent demand by banks for such public debts. The preferential treatment offered may be politically convenient and nationalistically driven, but it is inconsistent with prudential regulation, especially when the risk free status is in question. Although most banks weight sovereign debt risk similarly for reserve purposes, the market does not, as evidenced by the credit default swap (CDS) market. Today, it is unthinkable to treat Greek debt on par with German debt.
Since the Great Recession, many governments rescued large domestic banks that are deemed to be systemically important institutions (too large to fail) and proppedup their domestic economy by issuing large amounts of government debt. For weaker economies, new government commitments were piling on to already heavy debt burdens. Government bailout of banks in effect nationalized private debt and transferred more debt and shifted credit risk to the sovereign.
This increasing linkage between the domestic sovereign and the domestic banks creates a negative feedback loop that is unsustainable and contributes to cross-border financial contagion ending in systemic collapse. The high and increasing sovereign debt in peripheral Europe is naturally causing capital flight to the core countries, and quite expectedly, a massive retreat of cross border investment and lending. Thus, without alternative funding sources, sovereigns have continued to absorb the bad debts from domestic banks and rely on domestic banks to be the buyers of sovereign debts.

Case in point,the two LTRO programs totaling $1.3 trillion earlier this year helped to calm fear about the EZ banking illiquidity. The Spanish and Italian banks have borrowed massively and in turn used the money to purchase Spanish and Italian government debt. This “back door” action helped to temporarily lower the borrowing costs and calm markets. Since then, much of the LTRO effect has worn off, and without changing the fundamentals to the debt crisis, borrowing costs are back up significantly. This sovereign banking dependency begins to breakdown when banks hold significant public debt. First, whensovereign credit rating is downgraded or questioned it leads to a reduction in the value of the sovereign debt banks hold for funding purposes. Then banks’ ratings are sympathetically lowered resulting from the sovereign downgrade,Areduction in the implicit or explicit government guarantees to the banks follows. Finally deposit flight from banks and liquidity begins to dry up while rates increase to access capital for the bank and the sovereign. This leads to the next round of downgrades. To add more pressure is when the domestic economy shrinks as result of severe austerity and exaggerates the debt to GDP coverage ratio which leads to ever increasing rates to compensate investor risks. The sovereign again turns to domestic banks as the path of least resistance to be the buyers of more domestic sovereign debt.
The leaders at the last Euro Area Summit held June 29, 2012, affirmed that “it is imperative to break the vicious circle between banks and sovereigns.” As such the following actions have been proposed:
- ECB will serve as a joint EZ bank supervisor as a precursor to a banking union for a January 1, 2013 implementation date.
- Once the ECB becomes the joint EZ bank supervisor, the European Financial Stability Facility (EFSF) /European Stability Mechanism (ESM) can recapitalize banks directly so that the sovereign-bank negative feedback loop can be severed. The bailout fund for Spanish banks will first come from the EFSF and be routed through the sovereign, but, once the joint bank supervisor is in place, Spain’s public debt will be adjusted and the credit risk will go from the Spanish sovereign to the EFSF/ESM. This,in essence, transfers the risk from a single sovereign to all ESM contributors.
- Ireland will be treated similarly to Spain.
- The ESM will not be senior to other debt in the Spanish bank bailout. This is an exception and the ESM will continue its preferred-creditor status in other operations.
Although the stock markets reacted very favorable to these announcements, since then the realization that this is nothing more than kicking the can down the road a bit more set in and much needed banking union and fiscal union remain elusive.
Crystal Balling
The world is slowing, and the evidence is everywhere. The fear of recession and deflation in the near term are gaining favor even though very few deny that, in the longer term, the real enemy is inflation. The Federal Reserve has been trying to engineer a sustainable inflationary environment by spurring growth and risk taking, but the world is bigger than the Federal Reserve.
In the U.S., the economic recovery has been tepid. With the 1) uncertainty of the presidential as well as congressional elections in November, 2) the political divisiveness in Washington, 3) the uncertainty and implementation risks to carry out Affordable Care Act and Dodd-Frank, and 4) the confrontation with the debt ceiling and Fiscal Cliff by the end of this year, anything can happen. The magnitude of the effect will be determined as much by elections and policy actions as other macro events and timing of such events outside the U.S. Although the world seems to be hostage to bi-modal outcomes, the factors are not binary in nature.For example, the evidence appears strong and convincing that Greece will be the first to exit the EMU and set the stage for the next country (most likely Portugal or Ireland) to exit. In the meantime, the Troika (ECB, EC and IMF) will not have enough financial fire power to prop up Spain and Italy. This will lead to a breakup of the EU and a massive quake. However, if the core countries, especially Germany, are willing to initially “buy more time” by making small concessions along the way and the ECB is willing to inject more LTROs in the near term, ultimately take on the type of debt mutualization (eurobonds and banking union) andtake meaningful steps for fiscal union, the EMU and EZ willstabilize. Under this environment, volatility is typically elevated and the upside typically does not justify the downside risk since the probability of everything going right appears to be less likely than most things going wrong. The repeating delayed actions by the EZ leaders and the conflict between their domestic audience and the pan-European constituents, although understandable, is demonstrating a total lack of leadership and unified resolve. The problem is that there is a spectrum of paths and decisions in arriving at either conclusion and no one knows what will happen and how to take advantage of it.
It is human nature that, in times of great uncertainty, we retreat and take little risk. Investors are affected by market noises and many make decisions based on day-to-day market movements. In this environment, controlling risk and exercising prudence is more important than trying to reach for higher returns. We are living in a near zero return fixed income and a sub-par single digit equity return world. As the return is compressed, the movement or volatility becomes more impactful and damaging because we have less cushion to sustain losses.
It is foolish to time or to predict the short-term movements of the stock market. There is no question that the overall sentiment is bearish globally. Short sales on the New York Stock Exchange have climbed above last September’s peak, and according to Bloomberg, almost $1 trillion has been erased from U.S. equities since shares peaked this year on April 2.Each time over the past two years when investors pushed up short sales in speculating a major market downturn, the Federal Reserve stepped in and the market rallied. However, market trends and indicators may help to inform us.

The Citigroup Economic Surprise Indices measures how much economic data from the past three months is beating or missing the median estimates in Bloomberg surveys. The indices are calculated daily in a rolling three-month window. A positive reading suggests that economic releases have on balance beaten the consensus. A negative readingsuggests that the actual economy has not met the analysts’ expectations. The latest reading confirms the trend to be negative and continuing. This means the reality is worse than the consensus estimates. In the past, this trend has led to more quantitative easing by the Federal Reserve or a recession. We are now in the middle of another quarterly earnings announcement season and, if this index is a guide, we should expect US corporate earnings to generally disappoint (either earning less than estimated or projecting the future earnings to be less than anticipated or expected).
Historically, the DOL Weekly Initial Unemployment Claims have been highly correlated with the stock market (S&P 500 Index). This should not be surprising since jobs or the lack of jobs is a reflection of the health of an economy. After reaching a high of over 650,000 unemployment claims in early March 2009, the stock market reached its low the following week. Since then, the recovery of the unemployment claims data has been moving in locked step with the S&P500Index. The following graph shows the positive correlation between the two sets of data since July 2007. If we agree that the jobless claims will continue to improve from here in a meaningful way, the stock market will likely improve from here as well, but if we combine this set of data with the Citigroup Economic Surprise Indices, the near term looks not so promising for the economy, thus the jobless claims.

It has been 5 years since the beginning of the US real estate driven global financial crisis. Now, we find the world economy unbalanced and facing significant uncertainty and macro risks. For the third year in a row, we witnessed signs of economic strength during the beginning of the year which gave way to the reality that developed economies are too laded with debt to take flight. The private sector is too weak to stand on its own without significant fiscal support and monetary stimulus from the government. Finding the balance between meeting short term needs and long term consequences has been elusive as politicians have the (regrettably) obvious desire to satisfy the governed.
To make the investment community feel better, to show that they are taking action in meeting their dual mandates, to keep financial repression alive, and to drive up inflation so that we can monetize our national debt are a few good reasons for the Federal Reserve to initiate QE3. Mr. Bernanke will tell us that the economy is too weak and the global economic slowdown will threaten our economic health further to justify printing more and much more money. ECB will likely initiate the next round of LTRO as a Band-Aid solution to the sovereign-banking crisis. Even though none of these actions have solved our debt problems or global imbalances, policymakers seem to be out of bullets.
- EFSF was created by the euro area Member States following the decisions taken on 9 May 2010 within the framework of the Ecofin Council. The EFSF’s mandate is to safeguard financial stability in Europe by providing financial assistance to euro area Member States. EFSF is authorised to use the following instruments linked to appropriate conditionality: (1) Provide loans to countries in financial difficulties; (2) Intervene in the debt primary and secondary markets. Intervention in the secondary market will be only on the basis of an ECB analysis recognising the existence of exceptional financial market circumstances and risks to financial stability; (3) Act on the basis of a precautionary programme; and (4) Finance recapitalisations of financial institutions through loans to governments.
To fulfill its mission, EFSF issues bonds or other debt instruments on the capital markets. EFSF is backed by guarantee commitments from the euro area Member States for a total of €780 billion and has a lending capacity of €440 billion. EFSF has been assigned the best possible credit rating by Moody’s (Aaa) and Fitch Ratings (AAA). EFSF has been assigned a AA+ rating by Standard &Poor’s.(http://www.efsf.europa.eu/about/index.htm) - The European Council (EC) agreed on December 17, 2010 on the need for euro area Member States to establish a permanent stability mechanism. This European Stability Mechanism (“ESM”) will assume the tasks currently fulfilled by the EFSF and the European Financial Stabilisation Mechanism (“EFSM”) in providing, where needed, financial assistance to euro area Member States.The purpose of the ESM shall be to mobilise funding and provide stability support under strict conditionality, appropriate to the financial assistance instrument chosen, to the benefit of ESM Members which are experiencing, or are threatened by, severe financing problems, if indispensable to safeguard the financial stability of the euro area as a whole and of its Member States. For this purpose, the ESM shall be entitled to raise funds by issuing financial instruments or by entering into financial or other agreements or arrangements with ESM Members, financial institutions or other third parties. (http://www.efsf.europa.eu/attachments/esm_treaty_en.pdf)