Executive Summary
- First quarter witnessed the continuing volatility that has unsettled markets globally since China’s currency devaluation, with many stock exchanges in correction (10% from peak) or bear market (20% from peak) territory.
- The consensus view is that the world’s aggregate demand continues to slow and that monetary policies can only foster economic conditions for growth, but it would require fiscal, structural and tax policies to punctuate global growth.
- The improving U.S. labor market and the low energy prices are helping consumers in the U.S. and should continue to provide support. If wage growth and productivity improve meaningfully (which we expect), consumers should continue to propel the U.S. economy forward. However, we continue to expect a sub 2.1% real GDP for 2016 in the U.S.
- Investors are recognizing the limits of monetary policy, but there seems to be no capacity for fiscal, structural and tax reform to augment the monetary policy efforts. We hope that this will not result in further unconventional policy tools such as negative interest rate or even monetary financing (i.e. helicopter money).
- The FOMC will not likely vote for a rate hike until earliest in their June meeting. We affirm our expectation of two rate hikes this year, and the Fed Fund rate ends the year at or around 75bp.
- Brexit, Grexit, terrorism, China soft/hard landing, oil price stability and the U.S. presidential election can all have an impact on the financial markets regardless of the outcomes. We continue to expect more market volatility for the remainder of this year.
- Oil prices have set a bottom and now should trade in a $35 to $55 range. The supply destruction has been quick and meaningful and contributes to price stability. After all, this has been a story of supply/demand mismatch.
A Tough First Quarter
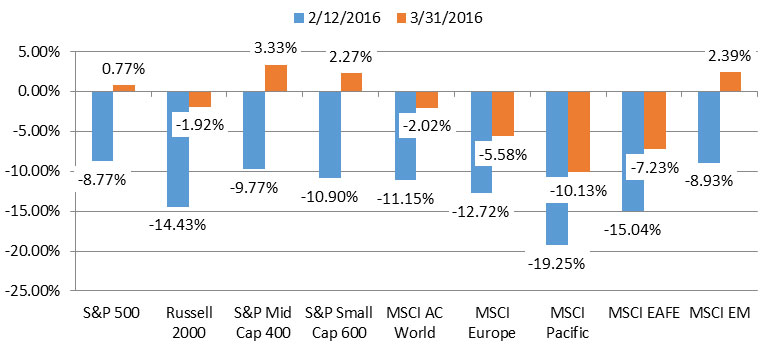
The first six weeks this year saw market volatility spiked with U.S. stock markets in correction territory while other markets toyed with bear market levels. There was no single new event that stood out which could fully explain the downside volatility. The usual suspects of China slowdown, the November 2015 terrorist attacks in Paris, the increasing drumbeat of a Brexit, the effectiveness of a negative interest rate policy (NIRP), the effect of Federal Reserve raising rates by 0.25bp in December last year, continuing uncertainty with commodity/oil price, and lower corporate earnings are known factors to the market. Perhaps it was the sudden fear of a slowing world. Since February 12th, the global market has bounced back, and for the U.S. market the major indexes are in positive territory. The following table illustrates the price change for a group of broad stock indexes as of 02-12-16 and as of the end of the first quarter.
The following two charts show the changing relationship between the traded-weighted dollar index, oil and the S&P 500. The retreat of the USD beginning on January 20th is also the beginning of the oil price (WTI) recovery, now reaching over $43 per barrel. Coincidentally, the S&P 500 also turned up shortly thereafter.

The market volatility during the first 45 days continues to illustrate the schizophrenic state of the investor. We remain in a risk-on-risk-off (RORO) environment due to the persistent distortion resulting from the sustained unconventional global monetary policy which decoupled the real economy from the financial economy.
The Global Economy Is Slowing
Even though the world economy really never sped up too much (condition of the New Normal) since the Financial Crisis, it appears that the modest growth is getting more modest. Three international organizations have identified the same slowing growth trends when they met during the first quarter.
- Group of Twenty (G20) Revised Down Global GrowthG20, comprised of 19 countries plus the European Union1, concluded its 2016 forum on February 27th. This annual forum brings together finance ministers and central bankers to discuss ways to strengthen the global economy, reform international financial institutions, improve financial regulation, and discuss the key economic reforms that are needed in each of the member countries. There was low expectation as to what would be actionable and could be achieved since there appears no imminent threat of an economic crisis. The G20 Communique2 issued the following “consensus”:Downside risks and vulnerabilities have risen: volatile capital flows, a large drop of commodity prices, escalated geopolitical tensions, the shock of a potential UK exit from the European Union, a large and increasing number of refugees in some regions and growing concerns about the risk of further downward revision in global economic prospects.Monetary, fiscal and structural tools needed: monetary policies will continue to support economic activity and ensure price stability, but monetary policy alone cannot lead to balanced growth. Fiscal policies are needed to strengthen growth, job creation and confidence, while ensuring debt as a share of GDP is on a sustainable path. Tax policy and public spending reform to be growth-friendly. Faster progress on structural reforms should bolster potential growth in the medium term and make economies more innovative, flexible and resilient.Currency exchange stability recognized: excess volatility and disorderly movements in exchange rates can have adverse implications for economic and financial stability. G20 members will consult closely on exchange markets and refrain from competitive devaluations and not to target exchange rates for competitive purposes. Further G20 members will resist all forms of protectionism.
Clear policy guidance: G20 members agree to carefully calibrate and clearly communicate macroeconomic and structural policy actions to reduce policy uncertainty, minimize negative spillovers and promote transparency.
Strong, sustainable and balanced growth commitment: achieving the objective of 2 percent additional output by 2018. Committed to further enhancing the structural reform agenda, and recognizes the importance of trade and investment for growth and their recent weakness. G20 members will continue to take steps to promote greater inclusiveness and reduce excessive global imbalances.
Infrastructure investments: reaffirms commitments to advancing the investment agenda with focus on infrastructure both in terms of quantity and quality aspects. G20 members will launch a global infrastructure connectivity alliance initiative to enhance the cooperation and synergy of infrastructure programs.
Capital flow and international financial architecture: a stable and resilient international financial architecture is a key element to foster strong, sustainable and balanced growth as well as financial stability. Capital flows are a central feature of the international monetary system.
The Communique clearly recognizes global economic risks and the desired and necessary responses. However, the proposed remedies, such as the mutual consultancy for currency devaluation, sound great but are not likely to be enforced or even practical. One of the effects of monetary policy action is expressed through the country’s currency exchange. Regardless the motivation, it is unlikely that each central bank would limit its actions until all remaining G20 monetary authorities agree to an action. Infact, China has continued to shift its currency band lower right after the G20 meeting. Although currency devaluation may not be the primary focus of an expansive and unconventional monetary policy, it is often a byproduct that could lead to competitive devaluation. It is difficult, if not impossible, for G20 members to prove that a member country’s action is to target its exchange rate for competitive purposes. Another example would be clear policy guidance. Japan’s central bank governor Haruhiko Kuroda is well known for its surprise policy moves. For example, in 20143 they shocked the markets with a huge stimulus program and earlier this year4 , even after the central banker said that negative rate was not in the cards, they announced negative rates for financial institutions. The ability to retain the full range of options, to include surprising the markets for added effect, is not likely to change.
- Organization for Economic Co-operation and Development (OECD) revised down global growthOECD5 issued its Interim Economic Outlook on February 18th and echoed much of the G20 consensus where weak global trading, investment and commodity prices all contributed to lackluster growth which leads to low wages, disinflation and a lack of job growth. The following table shows the downward revision of global growth since the November projections:
 The worrisome trend of weakening global trade is more of a symptom. The trade slowdown reflects the end of an investment-led (commodity driven) Chinese growth model, a reversion-to-the-mean of global growth adjustments to the above trend growth prior to the Financial Crisis, and the oil price collapse caused by supply and demand imbalances. These are multi-year secular factors and should not be expected to reverse course quickly by global monetary policy efforts.
- IMF’s World Economic Outlook (WEO) Projection Revised Global Growth Rate Down from January The IMF’s WEO prepared for the April 2016 annual meeting again revised downward IMF’s outlook for world growth. IMF suggests that not only is the central WEO scenario now less favorable and less probable, the even weaker downside outcomes have become more likely.
 In its report, IMF cited the following contributing factors for the negative revisions to global growth:
- Weak final demand and a strong dollar contributed to a U.S. growth rate downward adjustment in 2015 Q4
- Japan’s growth was significantly lower
- After a significant slowdown in 2015 1H, the 2H pickup was modest
- The downward pressure in Brazil was more than forecasted
- Geopolitical tensions have been weighing on global growth as well
- Global industrial production, particularly of capital goods, remained subdued throughout 2015. This weakness is consistent with depressed investment worldwide—particularly in energy and mining—as well as the deceleration of China’s manufacturing activity.
IMF identified a list of downside risks to the less than robust outlook over the near term:
- the threat of a disorderly pullback of capital flows and growing risks to financial stability in emerging market economies,
- the international ramifications of the economic transition in China,
- growing strains in countries that are heavily reliant on oil exports,
- the possible impact of tighter financial conditions and bouts of financial market volatility on confidence and growth if they persist,
- more protracted recessions in emerging market economies that are currently experiencing distress, (6) geopolitical risks, and
- the United Kingdom’s potential exit from the European Union.
Realization of any of these risks could raise the likelihood of other adverse consequences. Furthermore, IMF recognizes the perceptions of limited (fiscal and monetary) policy space to respond to negative shocks and would exacerbate concerns regarding these downside risks. In the euro area, the chronic low inflation and its interaction with the debt overhang is also a growing concern.
Data Dependent … But What Data?
In the December 2015 meeting, the FOMC decided to raise interest rates for the first time since Zero Interest Rate Policy (ZIRP) was put in place in 2008. The “dot plot” disclosed from the meeting (summarizing anonymously each member’s expectation where the Fed Fund Rate would be) suggests that there would be 4 interest rate increases in 2016. Either it was a coincidence or it was the market reacting to the relatively more aggressive policy projection, the stock market sold off globally. After all, market participants were expecting one to, at most, two interest rate hikes in 2016.
The January 27th FOMC meeting offered the following positive and negative observations:
| Positive | Negative |
|---|---|
| Household spending and business fixed investment | net exports |
| housing sector | inventory investment |
| job gains | Inflation below 2% target |
Furthermore, “the Committee is closely monitoring global economic and financial developments and is assessing their implications for the labor market and inflation, and for the balance of risks to the outlook.” The first time the FOMC included global or international developments in its post-meeting press release was the January 2015 meeting.
The March 16th FOMC meeting offered the following positive and negative observations:
| Positive | Negative |
|---|---|
| Household spending | business fixed investment |
| housing sector | net exports |
| job gains | Inflation below 2% target |
| prices of non-energy imports |
In both press releases, the FOMC stated that “the timing and size of future adjustments to the target range for the federal funds rate, the Committee will assess realized and expected economic conditions relative to its objectives of maximum employment and 2 percent inflation. This assessment will take into account a wide range of information, including:
- measures of labor market conditions,
- indicators of inflation pressures and inflation expectations, and
- readings on financial and international developments.”
The following table compares the (central tendency) projections (i.e. expectations) by the FOMC members in December 2015 vis-à-vis the March 2016 meeting.

The FOMC projection revised down the 2016 real GDP by 0.2% and revised up the core PCE inflation gage by 0.1% to a range of 1.5% to 1.7% while leaving constant the projected range for Fed Fund rate ranges from 0.9% to 1.4% by the end of 2016. At the current Fed Fund rate of 0.25% (25bp), this represents an increase range of 65bp to 115bp by the end of this year. Assuming a 25bp rate hike per meeting, this would mean two to five rate increases this year.
The CME Group6 30-Day Fed Fund futures prices, which have been used to express the market’s views on the likelihood of changes in U.S. monetary policy, tells a very different probability of rate hikes during the remaining 2016 FOMC meetings:
| April | June | July | Sept | Nov | Dec | |
|---|---|---|---|---|---|---|
| Probability of a 25bp increase | 2% | 21% | 36% | 47% | 52% | 66% |
The persistent market expectation for a low Fed Fund rate for an extended period of time has been right. The FOMC has gradually lowered its rate target and narrowed the expectation gap. However, this expectation gap is a source of significant market risk and uncertainty.
US GDP

Real GDP for 2015 was 2.4% according to the March 25th revision from the Bureau of Economic Analysis7. The 2015 GDP matches the 2014 real GDP at 2.4%. The fourth quarter GDP was revised up from the second estimate of 1% to 1.4%. The above left graph shows uneven growth from quarter to quarter and an overall down trend since the second quarter in 2014. The red line shows the trailing 4 quarter GDP (this removes some of the quarterly anomalies) and it too shows a slowing trend. It is important to note that advance (first) estimates for quarterly GDP are not always reliable. The above right graph shows the advance real GDP reported and the final revised GDP for each quarter since 20028 . From time to time the revision can be significant.

According to the Atlanta Fed’s GDPNow, a real time estimate of U.S. GDP, it is estimating a 0.3% real growth rate for the first quarter while the average consensus forecast is around 1.4% on April 19, 2016. On April 12, the New York Fed introduced Nowcast9 , its version of Atlanta Fed’s GDPNow. Nowcast uses real time economic data to give its best estimate for current real GDP. As of April 23, 2016, Nowcast estimate the 1st quarter real GDP to be 0.8%. Although there is a difference between the two estimates, they can agree that the first quarter will likely to be another weak quarter. Nowcast is also expecting the second quarter GDP to be at 1.2%. In order for the 2016 GDP to be within the FOMC projection range, the U.S. economy must pick up much more in the last two quarters.
Employment and Wage Growth
Employment is one of the bright spots in the U.S. economic recovery story. The official (U3) unemployment rate is now at 5% while the broad U6 rate is at 9.9% and continuing its slow and steady decline. More impressively is the upturn in participation rate to 63%. The low of 62.4% was reached in September 2015, and since then, the participation rate has slowly increased.

Job creation has been at a sustained level of over 200,000 average per month (on a trailing 12 month basis) since April 2014. Most observers have not expected to witness this above 200,000 level at this stage of an extended economic cycle.
However labor productivity and wages remain stubbornly low. Labor productivity measures the amount of goods and services produced by one hour of labor. More specifically, labor productivity measures the amount of real GDP produced by an hour of labor.

If the labor condition continues to tighten, we expect to see wage pressure and increase productivity in the U.S. Wages thus far have been barely keeping pace with inflation.
Inflation
The Consumer Price Index for All Urban Consumers (CPI-U) increased 0.1 percent in March on a seasonally adjusted basis and is the smallest increase since August. Over the last 12 months, the all items index rose 0.9 percent before seasonal adjustment. The index for all items less food and energy has risen 2.2 percent over the last 12 months.
The lower left chart shows the one-month percent change in CPI for All Urban Consumers (CPI-U), seasonally adjusted, Mar. 2015 – Mar. 2016 Percent change. The lower rights chart shows 12-month percent change in CPI-U, not seasonally adjusted, Mar. 2015 – Mar. 2016 Percent change (source: BLS).

| Sub-Index | March 2016 | Notes |
|---|---|---|
| Energy Index | +0.9% | Consecutive decline in each of the 3 previous months |
| Gasoline Index | +2.2% | fell 13.0 percent in February |
| Fuel Index | +1.7% | First increase since May 2015 |
| Electricity Index | +0.4% | Consecutive decline in each of the 3 previous months |
Over the past year, the fuel oil index declined 34.8 percent, and the gasoline index fell 20.9 percent. The index for natural gas decreased 9.2 percent, and the electricity index declined 1.7 percent. With oil price bounced from its low at $26 to $46 in two months, this could signal a sustainable firming of energy prices and, if the prices stabilize, the impact to inflation would also stabilize.

The more favored inflation indicator for the Fed is the core personal consumption expenditure (PCE) measure which removes the volatile energy and food sectors. As of February, the PCE is at 1.1% while the Core PCE is at 1.8%. These readings and the core CPI reading of 2.2% show that the U.S. inflation is reaching the Fed target of 2%. On different occasions, the Fed has suggested that 2% inflation is the floor and not necessarily a trigger.
Take the case of the unemployment rate. By now at 5%, U.S. has arguably met and exceeded the “full employment” measure but the FOMC has continued to emphasize the additional “slack” in the labor market and the full employment rate is a moving target. With all things being equal, the FOMC will not move rates higher the moment the 2% inflation rate target is met but to take action after a period of sustained 2% or higher inflation.

One indicator for investor expectation of inflation in the future is the 5 year inflation rate. The graph on the left from the St. Louis Fed represents a measure of expected inflation derived from 5-Year Treasury Constant Maturity Securities and 5-Year Treasury Inflation-Indexed Constant Maturity Securities. As of 4-21-2016, Investors are expecting 1.56% inflation rate 5 years from now. This remains below the Fed’s 2% target. The April FOMC meeting is widely expected to hold rates constant as the market expects a June and December rate rise. This is especially true with an expected weak first quarter GDP. We continue to maintain a two rate increases totaling 50bp this year. However, with the Brexit referendum vote scheduled for June 23rd, it is likely that the financial market will experience heightened volatility which could tighten financial conditions globally. This would pause any FOMC actions. As such, a September rate rise is more likely.
Global & International Factors

After 5 consecutive months of negative (below 50%) ISM Manufacturing Index, it turned positive in March. This may be due to the stabilization of the U.S. dollar. Although China remains below 50% for its manufacturing index, its service or non-manufacturing index is decisively positive and climbing. In the case of Japan, the direction appears negative for both indexes and suggests economic contraction. Eurozone is stronger in the service sector than the manufacturing sector suggesting the consumers are spending. The Eurozone composite unemployment rate is 10.4%10 at the end of February which remains high with the usual core countries doing better to much better.
The European Central bank (ECB) actions since last year suggests that the Eurozone remains concerned about a lack of or uneven growth and the threat of deflation. Not unlike the Japan Central Bank and the Federal Reserve, each central bank is looking to engineer price stability. In January 2015, the ECB announced its €1.1 Trillion large scale purchase program (“QE”) to be deployed in March11 at a rate of €60 billion per month through September 2016 (an expansion from then current €13 billion per month program). Each month the program will purchase government bonds (most owned by banks). Unlike the U.S., European companies get most of their funding from banks and not from the commercial debt market (as in the U.S.) and QE intends to have a direct effect. The long term objective is “to enhance the transmission of monetary policy, facilitating credit provision to the euro area economy, easing borrowing conditions of households and firms and contributing to returning inflation rates to levels closer to 2%, consistent with the primary objective of the ECB to maintain price stability.” The following diagram from BBC News12 attempts to summarize the desired outcome of QE.

Sensing a further economic slowdown, the ECB cut the growth and inflation rates for Europe and reduced its main refinancing rate to 0.0 percent and further lowered its deposit rate to minus 0.4 percent in March. Further the ECB expanded its QE program to €80 billion per month beginning in April 2016 and beginning in the second half of this year to considering buying investment grade, non-bank euro-denominated bonds. Finally, ECB initiated a new round of four targeted long-term refinancing operations (TLTRO) to foster new lending by banks. The idea is to “lend” money to banks as a transmission mechanism to further lend to qualified borrowers. The four TLTRO operations will be conducted in June, September and December 2016 and in March 2017 and each operation will have a maturity of four years from their settlement date. The facility will reward those banks that exceed their lending benchmark to the real economy by lowering the rate for repayment. This could mean that the ECB will pay a negative interest rate or pay the borrowing bank to borrow from the ECB. This further incentivizes the borrowers to lend. This targeted approach makes a lot of sense if the private sector wants to borrow at all. Nonetheless, the effectiveness of the TLTRO and NIRP remain unknown, but it is clear that central banks are trying hard to meet its mandate.
UK – The awkward partner
European Union (EU), formalized under the Maastricht Treaty in 1993, traces its origin from a post second world war core idea of European unity in an attempt to end centuries of conflicts among neighbors. In 1973, United Kingdom (UK) became a member. The membership grew from 9 to 28 currently. In 1999, 19 member countries of the EU agreed to be part of the European Economic and Monetary Union (EMU) and replaced their individual currency with a single currency, the euro. UK and Denmark opted out of the euro and retain their individual currencies. UK has always been skeptical of the EU. Even as early as 1975, the Labor government held an EU membership referendum. As the EU pushed for an ever closer union, the UK remained on the sideline. In fact, UK is not a part of the 26 member of the Schengen passport-free travel zone13 .
Membership in the EU intends to offer many benefits:
- Low barrier to trade promotes specialization and boosts productivity in each member country (access to EU supply chain),
- Significant expansion of the domestic market that promotes scale ($16.6 trillion single market), and
- Increase economic growth through efficient circulation of ideas and technology (eliminate tariffs and customs while unifying regulations and completion laws).
Since the end of the Financial Crisis, EU has been experiencing a tepid and uneven recovery among its membership. Migratory workers from the EU peripheral countries and newer Eastern European member countries into the core economies, including the UK, have posed challenges. The influx of immigrant to the UK has placed stress on the country’s social system even though there seems to be no hard evidence that local jobs were lost since unemployment rate is low (low end service jobs have been more competitive). The latest migration from North Africa and war torn Middle East to the EU is adding more fear. Further, during the past 6 years, the EU has been resulted in policy mistakes, high unemployment, unconventional monetary policies and deflationary fears. Now, what the UK wants from the EU is to:
- Affirm economic governance (i.e. minimizing financial union) and political independence (i.e. minimizing political integration), and free of contributions to EU bailouts of other countries.
- Minimize the need to comply with burdensome regulations imposed on the single market
- Curtail benefits to migrant workers that otherwise may be available under the EU single market framework.
The following is a summary highlight of the main arguments from both sides of this debate:
| Stay | Leave | |
|---|---|---|
| Trade – EU | 30% of the GDP in 2014 represented by imports and exports to the EU. 50% of UK export is to EU without tariffs and UK has a say in EU trading rules | Vast majority of small and mid UK firms do not trade with EU and yet subject to EU rules |
| Trade – Outside EU | Participate in trade deals negotiated by EU with non-EU countries | UK can negotiate better trade deals without being held back by the EU |
| Financial center | UK’s status as the main European financial center is helped by being viewed as the gateway to EU | UK to reinvest itself in the manner of Singapore in Asia |
| Security | EU is an important pillar to UK security | The open boarder policy with EU leaves UK vulnerable |
After a protracted negotiation in February with the EU regarding UK grievances, UK Prime Minister David Cameron announced a new referendum scheduled for June 23rdon UK’sEU membership.
The following negotiated package of changes with EU will take effect immediately if the UK remains in the EU:
- UK continues the use of its currency and its business trade with EU without fear of discrimination,
- UK will not be part of an “ever closer union”
- any financial contributions towards EU bailout would be reimbursed,
- changes to migrant welfare payments and child benefits and place some limits to migrant movements due to marriage,
- prevent EU regulations to be imposed on UK financial services industry,
- allowing member states to band together to block unwanted legislation, and
- for EU to take concrete steps towards better and more efficient regulation.
Ultimately, the desire to leave stems from a perceived (if not real) ride down a slippery slope of losing UK identity and sovereignty to the EU and the less than a comfortable union since the Financial Crisis. The consequence and cost for leaving the EU cannot be clearly measured but it is psychologically impactful to the UK, EU and the world. The referendum and the possible aftermath with a leave vote adds increasing uncertainty to the markets regarding economic growth, exchange rates, inflation (lower fx and higher import cost) and consumer and business confidence, just to name a few. Further, it opens the door for other countries to join UK and initiate the breakup of the EU. This could trigger another Scottish independence referendum and possibly the breakup of the UK itself.
A series of polls14 taken since November last year regarding Brexit shows public opinion moves from leave to stay and back again. According to the ICM poll on April 17th, the stay at 43% and leave at 44% is virtually tied with 13% undecided.

On Tuesday, March 22,two suicide bombs exploded at the Zaventem International Airport and atthe Maelbeek metro station leaving more than 31 dead and 340injured. Subsequently, in the Brussels neighborhood of Schaerbeek, an explosive device was found along with chemical products. The latest terrorist bombings have been linked to November 13, 2015, attacks in Paris that killed at least 130 people and 368 wounded. These events have no doubt been on the minds of UK citizens thinking about Brexit even though most of the terrorists are homegrown or French and Belgium citizens. The terror events were not carried out by the current or recent immigrants from North Africa, Syria and other parts of the Middle East. Nonetheless, the pro “Leave” group will seize the latest and likely to be ongoing violence to push against the ever-closer-union of the EC member countries.
One track for the UK is to follow the Swiss and Norway model of both in and out of the EU15. Some observer suggests that leaving the EU is only a negotiation tactic to get UK more concession from the EU.At the end, voter turnout will likely determine the Brexit question. The passion and excitement is in the Leave camp. If the Stay camp cannot generate the momentum to make sure their voters show up to vote, Britain may end up leaving the EU. Since no member has ever left the EU, the exit terms and exact ramifications remain unclear, and the long term fallout will take time to witness. Moreover, the EU needs to balance strong economic ties with the UK while sending a clear message that there is a cost for a member to leave.
Money From Heaven … Helicopter Money
After 8 years of central bankers using unconventional monetary policy of zero bound interest rate policy (ZIRP), large scale asset purchase (in the case of Japan, an outright purchasing equity ETFs), forward guidance, negative interest rate policy (NIRP), “helicopter” Money appears to be the logical and natural next step. Of all the central banks, Japan would most likely be the first to use this controversial approach. Some believe that Helicopter Money is less unconventional than NIRP since NIRP has not be used by central bankers in the past.
After years of unconventional monetary policies, the world economy remains in a low growth environment with low to no inflation. The recovery from the Great Recession has been long and difficult with many citizens left behind and never recovered. The monetary policies intended to provide a safety net while buying time for the economy to rebound back to the old normal. However using financial institutions as the transmission mechanism or intermediaries has not been successful. In fact NIRP has either not been very effective or comes with unintended consequences that are counter-productive to the policy. Further, NIRP has its limit – how negative can the policy go? So, helicopter money (or “monetary financing”) is one way to put cash directly into the hands of the public to stimulate spending and growth.
According to the April 15th Deutsche Bank Research, monetary financing is divided into four categories.
- Quantitative Easing combined with Fiscal Policy Expansion
- Central bank buys interest bearing government bond that are issued by the Treasury and increases fiscal spending or tax cuts. Due to the bond buying, the Treasury has more room for fiscal deficit spending.
- Cash Transfer to Governments
- The central bank credits money directly to the Treasury by buying zero coupon bonds that are perpetual. Another words Central bank “prints” money and gives it to the Treasury to spend.
- Haircuts on Existing Central Bank held Debt
- The central bank restructures or forgives the government debt held and allows the Treasury more room for fiscal deficit and spending
- Cash Transfer to Household
- This is most often thought of as helicopter money where $100 bills and tossed out of a helicopter. The central bank transfer money to individuals directly.
There is nothing new about monetary financing. During the two world wars, central banks funded the military expenses. Assuming individuals receiving the money directly would consume goods and services, this would be the most direct approach to increase economic activities immediately. The consequence would be hyperinflation. The ability for each central bank to elect helicopter money will be based on their institutional constraints and legal interpretations. But ultimately it is a political question. We hope that none of the economies would justify the use of monetary financing as the last resort to maintain price stability and full employment.
It is unlikely that the Fed will use NIRP or helicopter money, but the Fed cannot operate without taking serious consideration of what other central bank policies are. If Japan and Europe (and for that matter China) move further down that path, it will further limit Fed’s ability to take action. Many commentators denounce the Fed for taking foreign or non-US factors into consideration for making monetary policy decisions when the Fed is the central banker to the U.S. We believe that, in a globally linked world where finance, trade and capital flows are almost without borders, it would be irresponsible for the Fed to be home centric when exogenous factors are impactful and material to our economy. When market sell off or when spread widens or when liquidity dries up, these tighten financial conditions with similar impact as the FOMC hiking rates.
Data dependent = Boots on the Ground!
This quarterly commentary represents the current views of Chao & Company and they are subject to change. This Firm has no obligation or responsibility to update our views. The comments and views should not be deemed as Philip Chao, or any member of this Firm, offering personal investment advice. The quarterly commentary is informational only and is insufficient to be relied upon to make any financial or investment decisions.
- Argentina, Australia, Brazil, Canada, China, France, Germany, India, Indonesia, Italy, Japan, Republic of Korea, Mexico, Russia, Saudi Arabia, South Africa, Turkey, United Kingdom, United States, European Union.
- http://www.g20.utoronto.ca/2016/160227-finance-en.html
- http://www.wsj.com/articles/boj-unexpectedly-eases-policy-1414731873?cb=logged0.9783215520437807
- http://www.nytimes.com/2016/01/30/business/international/japan-interest-rate.html
- https://www.oecd.org/eco/outlook/OECD-Interim-Economic-Outlook-February-2016.pdf
- http://www.cmegroup.com/trading/interest-rates/countdown-to-fomc.html
- http://www.bea.gov/newsreleases/national/gdp/gdpnewsrelease.htm
- https://www.bea.gov/national/xls/GDP-GDI%20vintage%20history.xls
- http://libertystreeteconomics.newyorkfed.org/2016/04/just-released-introducing-the-frbny-nowcast.html#.VxvLlfkrIQg
- http://ec.europa.eu/eurostat/statistics-explained/index.php/File:Unemployment_rates,_seasonally_adjusted,_February_2016.png
- http://www.ecb.europa.eu/ecb/legal/pdf/en_dec_ecb_2015_10_f_.sign.pdf
- http://www.bbc.com/news/business-30933515
- http://www.bbc.com/news/world-europe-13194723
- https://ig.ft.com/sites/brexit-polling/
- The EU countries are:Austria, Belgium, Bulgaria, Croatia, Republic of Cyprus, Czech Republic, Denmark, Estonia, Finland, France, Germany, Greece, Hungary, Ireland, Italy, Latvia, Lithuania, Luxembourg, Malta, Netherlands, Poland, Portugal, Romania, Slovakia, Slovenia, Spain, Sweden and the UK.The European Economic Area (EEA)The EEA includes EU countries and also Iceland, Liechtenstein and Norway. It allows them to be part of the EU’s single market.Switzerland is neither an EU nor EEA member but is part of the single market – this means Swiss nationals have the same rights to live and work in the UK as other EEA nationals.