Rate Normalization
The risk free rate generated by the risk free asset sets the foundation by which the forward looking expected return of all other assets are based. To put it another way, the risk premium for each asset is the excess compensation required to take on additional risk. U.S. treasury securities are deemed to be risk free. This means that the expected return on the treasury securities is the actual return without variance and with no risk to the principal. The U.S. treasury interest rates along the treasury yield curve also set the basis for all borrowing or loan rates in a similar way. The higher the credit worthiness (i.e. lower default risk) of a borrower, the closer the rate the borrower pays to the risk free rate along the treasury maturity or yield curve. The Federal Open Market Committee’s (“FOMC”) actions have significant impact, and thus consequences, to savers, investors, borrowers, the U.S. dollar and the economy. As such, since November 2008’s Federal Reserve (“Fed”) action to initiate a large scale asset purchase programs known as Quantitative Easing (“QE”) and December 2008’s Zero Interest Rate Policy (“ZIRP”) decision, the world has increasingly been fixated on the FOMC’s every move and its chairman’s every word. Although ZIRP cannot and should not be permanent, the expected action to “liftoff” from the ZIRP should be viewed as “rate normalization” rather than a “rate increase”.
Responding to a major financial crisis, such as the most recent 2007 event which led to the Great Recession, both fiscal and monetary policies are unleashed to stabilize markets, offer a financial environment that encourages investment and risk taking, and create jobs and employment. The severity of the Great Recession was a direct result of the burst of the overleveraged, real estate bubble-based economy. With little appetite to wield a stimulative fiscal policy, a super accommodative monetary policy from the Fed was the only broad policy option that had a reasonable chance of stabilizing the world’s largest economy. QE and ZIRP ensued. The Fed took extraordinary measures to comply with its dual mandates of full employment and price stability. Even though the third round of QE came to an end last October, the Fed continues to reinvest dividends and matured securities from its blotted balance sheet in more treasuries and other government securities to keep the interest rate artificially low while maintaining a high market liquidity. After the end of QE, moving off ZIRP is the natural next step for the Fed. However, this returning to a “normal” interest rate environment should not be confused as a rising rate environment. Normalization signals the end of the massive monetary support to the economy while rising rate typically signals a policy shift to cool down an overheating economy with a return of inflationary pressures. The current extended economic recovery has not shown signs of the economy overheating and inflation remains firmly below the 2% Fed target. Thus, moving off ZIRP means the US economy has recovered sufficiently to remove monetary crutches. Assuming inflation is in check, the new equilibrium rate should remain low even though it is not at 0%.
The table below summarizes the rate increases since 1983. Previously, the Fed raised rates in response to an improving macroeconomic environment with the labor market showing progressive strength evidenced by a persistent declining unemployment rate and a strong rise in non-farm payrolls. Also, the overall economy was growing at a good pace for a number of quarters and demonstrating strong data of cyclical sector and industrial production gains. These are not the current economic conditions in the U.S., and it clearly differentiates a rising rate environment from a rate normalization environment. So the question becomes what is that “normal” (a.k.a. equilibrium, natural, neutral, and terminal) rate of interest.

The Normal (Equilibrium) Rate
There is no clear consensus as to what the “normal” rate would be even though there are rampant debates as to what this rate should be. The 2015 U.S. Monetary Policy Forum in New York, sponsored by the Initiative on Global Markets[2] at the University of Chicago Booth School of Business on February 27, 2015, featured a research report titled “The Equilibrium Real Funds Rate: Past, Present and Future”[3] presented by James Hamilton, et al. The 80-page research paper attempts to answer the questions of “what is the steady-state value of the real federal funds rate[4]?” and “is there a new neutral, with a low equilibrium value for the foreseeable future?” The paper draws three main conclusions: (1) The uncertainty around the equilibrium rate is large, and its relationship with trend GDP growth much more tenuous than widely believed. The researchers’ narrative and econometric analysis using cross-country data and going back to the 19th century supports a wide range of plausible central estimates for the current level of the equilibrium rate, from a little over 0% to the pre-crisis consensus of 2%. Thus, using a long history to derive an average to predict the equilibrium rate is not appropriate. (2) The researchers are skeptical of the “secular stagnation” view that the equilibrium rate will remain near zero for many years to come. The evidence for secular stagnation before the 2008 crisis is weak, and the disappointing post-2008 recovery is better explained by protracted but ultimately temporary headwinds from the housing supply overhang, household and bank deleveraging, and fiscal retrenchment. (3) Based on the researchers’ simulations using the Fed staff’s FRB/U.S. model, the researchers explicitly recognize the uncertainty around the equilibrium rate, and given that the equilibrium real rate is unknown, there may be benefits to waiting to raise the nominal rate until some evidence of labor market pressure and increases in inflation are observable. Relative to the “shallow glide path” for the funds rate that has featured prominently in recent Fed communications, the researchers’ findings suggest that the funds rate should start to rise later, but – provided the recovery does gather pace and inflation picks up -somewhat more steeply.
It is safe to say that history is not a perfect guide and there is a lot of noise around the equilibrium rate. The paper suggests caution and to take reactive rather than proactive actions when it comes to rate normalization. Although the research paper and discussion is interesting and full of impressive analysis, it does not offer any better guidance as to what the normal rate should be this time around. Nonetheless, “full” employment, price stability (inflation expectation at 2%) and the trend rate growth of the economy (GDP) are key factors influencing the liftoff decision and the “final” normal rate in the medium term. These factors (and all the statistics that help to inform them) then represent the broad “data set” that underpins the FOMC rate decision going forward.
A Bunch of Double Talk
The FOMC continues to offer a sense of transparency about its considerations and decision making process so that the public and the market are fully informed to minimize surprises. Yet, the FOMC also wants the range of freedom to act or not. This is quite a balancing act.
In her February 24, 2015, semi-annual testimony before the Committee on Financial Services of U.S. House of Representatives, Chair Yellen stated that considerable progress has been achieved in the recovery of the labor market, with an average monthly job gain of 280,000 in the second half of 2014 and a 260,000 gain in January 2015. Additionally, long-term unemployment has declined substantially, fewer workers are reporting that they can find only part-time work when they would prefer full-time employment, and the pace of quits – often regarded as a barometer of worker confidence in labor market opportunities – has recovered nearly to its pre-recession level. But she further noted that the labor force participation rate is lower than most estimates of its trend, and wage growth remains sluggish. Separately, the U.S. economy is expected to grow at a 3.75% annual pace during the second half of 2014 with consumer spending being lifted by the improvement of the labor market and by the increase in household purchasing power resulting from a sharp drop in oil price. Inflation is expected to decline further in the near term due to the falling consumer energy prices and the strength of the U.S. dollar showing in imported goods before rising gradually toward 2% over the medium term as the labor market improves further and the transitory effects dissipate.
Yellen stated that a high degree of policy accommodation remains appropriate even with the continuing improvement in the economy and employment. As such, the FOMC can remain “patient” in beginning to normalize policy and that means no rate actions for the next couple of meetings. When the FOMC begins considering an increase in the federal funds rate, it will be on a meeting-by-meeting basis (i.e. not predicated on a set schedule). Before then, the FOMC will telegraph its change in position through forward guidance. However, Yellen emphasized that “a modification of the forward guidance should not be read as indicating that the Committee will necessarily increase the target range in a couple of meetings. Instead the modification should be understood as reflecting the Committee’s judgment that conditions have improved to the point where it will soon be the case that a change in the target range could be warranted at any meeting.” Yet, even after employment and inflation are near FOMC’s expectations, for some time, it may be warranted to maintain a below normal federal funds rate.
No, “Patient” Does Not Equal Inpatient
In the March 18, 2015, Federal Reserve Press Release for its 2-day meeting, the word “patient” was removed, as so anticipated. The statement affirmed that there is no rate increase in this and the next meeting (i.e. consistent with the definition of patient). The forward guidance is now entirely data dependent. The FOMC will assess progress – both realized and expected – towards its objectives of maximum employment and 2% inflation. This assessment will take into account a wide range of information, including measures of labor market conditions, indicators of inflation pressures and inflation expectations, and readings on financial and international developments. And, just in case of any confusion, the statement states that the “change in the forward guidance does not indicate that the Committee has decided on the timing of the initial increase in the target range.”
In Yellen’s press conference immediately after the Press Release, she continued to “clarify” her forward guidance regarding when the liftoff may be and what the normal rate means:
- With continued improvement in economic conditions, however, we do not want to rule out the possibility that an increase in the target range could be warranted at subsequent meetings … (Unknown Liftoff Date)
- … the timing of the initial increase in the target range will depend on the Committee’s assessment of incoming information (Data Dependent)
- … removed the word “patient” from the statement doesn’t mean we are going to be impatient (Unknown Liftoff Date)
- While it is still the case that we consider it unlikely that economic conditions will warrant an increase in the target range at the April meeting, such an increase could be warranted at any later meeting, depending on how the economy evolves … (Unknown Liftoff Date and Data Dependent)
- … forward guidance should not be read as indicating that the Committee has decided on the timing of the initial increase in the target range for the federal funds rate (Unknown Liftoff Date)
- … this change does not mean that an increase will necessarily occur in June, although we can’t rule that out (Unknown Liftoff Date)
- We continue to base that assessment on a wide range of information, including measures of labor market conditions, indicators of inflation pressures and inflation expectations, and readings on financial and international developments … (Data Dependent)
- … even after employment and inflation are near mandate-consistent levels, economic conditions may, for some time, warrant keeping the target federal funds rate below levels the Committee views as normal in the longer run (Uncertain Normal Rate)
- The median projection for the federal funds rate is just below 2 percent in late 2016 and rises a bit above 3% in late 2017. The median projected rate in 2017 remains below the 3¾% or so projected by most participants as the rate’s longer-run value, even though the central tendency of the unemployment rate by that time is slightly below that of its estimated longer-run value, and the central tendency for inflation is close to our 2 percent objective … (Uncertain Normal Rate)
- these forecasts of the appropriate path of the federal funds rate are conditional on participants’ individual projections for economic output, inflation, and other factors. But our actual policy actions over time will be data dependent … (Data Dependent)
The vice chair of the Fed, Stanley Fischer, in his remark during the 443rd Meeting for the Economic Club of New York on March 23, 2015, offered more insights (or less confusion without precision):
- Liftoff
This should occur when the expected return from raising the interest rate outweighs the expected costs of doing so. The FOMC anticipates that it will be appropriate to take action when there has been further improvement in the labor market and with reasonably confident that inflation will move back to our 2% objective over the medium term. (Data Dependent)
Rate Trajectory
(i) A smooth path towards normal long-term federal funds rate will almost certainly not be realized, because inevitably the economy will encounter shocks in a similar manner as the period 2004 to 2007 where the FOMC raised the federal funds rate by 25bps every meeting for 17 meetings. (Not Confided to the Calendar)
(ii) After the liftoff, the data to which the FOMC will be responding to will less and less be driven by the financial crisis and Great Recession, and increasingly by post-liftoff economic developments. Whatever the state of the economy, the federal funds rate will be set at each FOMC meeting on the basis of what the FOMC members believe will best meet the dual mandates over time. (Data Dependent)
Normal Rate
There is in fact considerable uncertainty about the level of future interest rates. (Uncertain Normal Rate)
Rate Expectations
The public will be able to form their expectations of future interest rates on the basis of three elements: (i) the policy record of the FOMC, which might be approximated as a reaction function; (ii) the public’s analysis of the current economic and financial situation and outlook; and (iii) whatever guidance the FOMC will provide as to how it sees monetary policy decisions likely to unfold given the economic situation and outlook. (Data Dependent)
With the combined information gathered from the FOMC Press Release, Chair Yellen’s press conference, and Vice-Chair Fischer’s comments, it is reasonable to suggest that, although the employment and U.S. economic picture continue to improve in the U.S., the FOMC is reluctant to be pinned down by a time table or to be predictable as to: 1) the timing of the liftoff, 2) the rate or progression of the future rate increases or 3) what the terminal rate could be. There is no question that the decision will be data dependent, and it is fairly well known what types of data the FOMC considers (no different than those available to the public). However, what is not knowable is the personal interpretations and weightings of the data going forward in making interest rate policies.
What are the Blue Dots Saying?
In the March release of the Economic Projections of Federal Reserve Board Members and Federal Reserve Bank Presidents, the following chart shows where the 17 members believe the Fed funds rate should be in 2015, 2016, 2017, and beyond. Each shaded circle in the graph below indicates the value (rounded to the nearest ⅛%) of an individual participant’s judgment of the midpoint of the appropriate target range for the federal funds rate or the appropriate target level for the federal funds rate at the end of the specified calendar year or over the longer run. These assessments of the timing of the first increase of the target range for the federal funds rate and for the path of policy are the ones that policymakers view as compatible with their individual economic projections. For 2015, 15 members see a liftoff with 10 members targeting a rate of 0.625% or less by the end of 2015. For 2016, the range of target rate is more disparate from the low of 0.375% to 3.75% with the majority targeting a rate below 2%.

What is the Market’s Expectation?
It is helpful to compare the Blue Dots with the market expectation regarding liftoff and future rate targeting to observe any disparity. The Chicago Mercantile Exchange (the CME Group) offers the FedWatch tool on their website[5] that allows the public to gauge the market’s expectations of potential changes to the Fed Funds target rate. The FedWatch is based on 30-Day Fed Funds futures prices, which have long been used to express the market’s views on the likelihood of changes in U.S. monetary policy. The following table summarizes the liftoff and rate hike as of April 8, 2015, using the following metrics. A more detailed explanation is available on the CME Group website5.
- FOMC meetings are matched with the corresponding 30-Day Fed Funds Futures contract.
- Probabilities of possible Fed Funds Target Rates are calculated based on the post-meeting Fed Fund Futures contract price.
- Probability of Rate Hike is calculated by adding the probabilities of all target rate levels of 0.50 or higher.
| Fed Funds Rate | 0bp | 25bps | 50bps | 75bps | 100bps |
| October 25 2015 FOMC meeting | |||||
| CME March 8 2015 Probability | 48.00% | 52.00% | |||
| CME April 8 2015 Probability | 50.00% | 50.00% | |||
| December 16 2015 FOMC meeting | |||||
| CME March 8 2015 Probability | 45.57% | 51.80% | 2.64% | ||
| CME April 8 2015 Probability | 43.57% | 50.00% | 6.43% | ||
| January 27 2016 FOMC meeting | |||||
| CME March 8 2015 Probability | 31.90% | 49.93% | 17.30% | 0.79% | |
| CME April 8 2015 Probability | 35.43% | 48.80% | 14.57% | 1.20% | |
| March 16 2016 FOMC meeting | |||||
| CME March 8 2015 Probability | 18.70% | 42.47% | 20.85% | 7.66% | 0.33% |
| CME April 8 2015 Probability | 23.28% | 44.21% | 26.31% | 5.79% | 0.41% |
Although many Fed watchers and market commentators believe that the FOMC will liftoff in its September meeting, the market is now expecting a 50% probability that the liftoff happens in the October meeting and the same chances for increasing the rate an additional 25bps during the 2015 December meeting. Assuming a continuing improvement in the economy and the labor market and without significant non-transitory downside effects, the liftoff is expected to be announced during the September meeting (this is consensus since it is also a meeting that is followed by a Yellen press conference) with a total rate increase in 2015 to be between 25bps and 50bps.
What Does The Yield Curve Say?

| 2-10 Spread | 10-30 Spread | |
| 1/4/2010 | 2.76 | 0.80 |
| 1/3/2011 | 2.75 | 1.03 |
| 1/3/2012 | 1.70 | 1.01 |
| 1/2/2013 | 1.59 | 1.18 |
| 1/2/2014 | 2.61 | 0.92 |
| 1/2/2015 | 1.46 | 0.57 |
| 4/9/2015 | 1.41 | 0.64 |
The treasury yield curve clearly shows that it has flattened over time. The flattening can be measured along the two segments of the yield curve pivoting at the 10 year bond yield. The 10 year/30 year yield spread has moved from approximately 100bps to 64bps since 2010 (a 36% flattening), whereas the 2 year/10 year yield spread has moved from 275bps to 141bps (a 49% flattening). The following chart shows the trend line of the front end of the yield curve since 2013.
The largest move of the 1, 2, 3, and 5 year treasuries came in mid 2013 after then Fed Chair Bernanke announced on May 22, 2013, that it could begin tapering back its monthly purchase of bond and mortgage-backed securities program. Although the rates adjusted back since the overreaction, the current interest rates remain above the pre-Taper Tantrum level. The trend is gradually upward with increasing volatility. This means that the market has priced in an FOMC liftoff and the recent volatility is the market anticipation of the amount and the progression of the rate increase.

The Best Economy Around
Although promoting growth in domestic GDP is not a mandate of the FOMC, the economy is the engine that directly impacts labor and price. Using FRED data, the following graph shows the quarter-by-quarter and 4-month trailing real GDP. The quarterly GDP can be volatile due to a number of factors to include severe weather and the 4-month trailing GDP smoothes out the “noise” and offers a better growth trajectory of the US economy. This shows that we are still stuck at the New Normal range of between 2% and 3% annually.


The Federal Reserve Bank of Atlanta’s Center for Quantitative Economic Research maintains a forecasting model for an ongoing estimate of GDP – GDPNow – on its website[6]. On April 2, 2015, the forecast for the first quarter GDP is 0.1%. On a real time basis, the GDPNow incorporates the releases of data that make up the overall GDP. The left graph from this site shows the top and bottom 10 forecasts among the BlueChip economists as compared to the GDPNow forecast. The estimate on February 2, 2015, was at 1.9%, and since then the estimate has consistently been revised downward or sideways, as more updated data is incorporated. The three biggest detractors from the estimated first quarter GDP are non-residential construction (may be weather related), net export (may be dollar strength related), and change in private inventories. This one quarter slowdown should not be sufficient to influence the FOMC in delaying its liftoff decision, but it points to a continuation of the post financial crisis, jagged recovery. Since one data point does not make a trend, we need to observe a much stronger GDP in the second and third quarter to consider the first quarter GDP to be an anomaly. Nonetheless, if the first quarter final real GDP is close to 0%, the economy has to grow at the 4% rate for the remainder of the year to average out a 3% GDP for 2015.

The March retail sale reported on April 14 came in lower than consensus. The Wall Street Journal graphics[7] below highlights the Commerce Department monthly & Annual Retail Trade Survey Report[8]
Thus far, consumers have remained cautious with their spending and the much anticipated wealth effect from lower oil prices have yet to materialize. In the March survey, the largest contributors came from auto and building material and garden equipment and supplies. At the same time, consumers have increased their savings to 5.8% in Feb.

Further, since August high of 58.1, the ISM Manufacturing: PMI Composite Index has steadily came down to 51.5 in February[9]. Although we are still expanding, the pace has definitely slowed. May be part of this can be explained by the strength of the dollar. Nonetheless, the U.S. economy is certainly not back to normal and there are pockets of weaknesses and further contribute to the Fed’s policy caution and possibly push back further the liftoff date.
The Employment Picture
Maximum employment in the U.S. is one of the mandates for the Fed, and this has been a bright spot in the US economy.

| U3 | U6 | Participation Rate | |
| 2014 Apr | 6.3 | 12.3 | 62.8 |
| 2014 May | 6.3 | 12.2 | 62.8 |
| 2014 Jun | 6.1 | 12.1 | 62.8 |
| 2014 Jul | 6.2 | 12.2 | 62.9 |
| 2014 Aug | 6.1 | 12.0 | 62.8 |
| 2014 Sep | 5.9 | 11.7 | 62.7 |
| 2014 Oct | 5.7 | 11.5 | 62.8 |
| 2014 Nov | 5.8 | 11.4 | 62.9 |
| 2014 Dec | 5.6 | 11.2 | 62.7 |
| 2015 Jan | 5.7 | 11.3 | 62.9 |
| 2015 Feb | 5.5 | 11.0 | 62.8 |
| 2015 Mar | 5.5 | 10.9 | 62.7 |
Over the past 12 months, we have witnessed a continuing drop in the U3 rate of over 0.8% from 6.3% to 5.5%. The broader U6 rate[10] has also shown signs of a meaningful reduction of 1.4% from 12.3% to 10.9%. However, the participation rate has remained at a historical low of 62.7%.

Except March, job creation has been strong with the private sector only filling 126,000 net jobs. Goods-producing, mining and logging, construction, manufacturing, non-durable goods and utility sectors are all representing net job losses, but the other industry sectors produced fewer net jobs with the exception of temporary help services sector. One contributing factor is the late winter weather that extended into most of March and the other is the well known fact that oil and energy sectors have cut jobs/lay off due to the significant drop in oil prices. Although this one month data appears troublesome, it too is a single data point and does not form a trend. We look to the second quarter data to see if this is an anomaly as well.
| 2014 Mar | 2015 Jan | 2015 Feb | 2015 Mar | |
| Total nonfarm | 225 | 201 | 264 | 126 |
| Total private | 223 | 202 | 264 | 129 |
| Goods-producing | 42 | 51 | 20 | -13 |
| Mining and logging | 3 | -7 | -11 | -11 |
| Construction | 30 | 41 | 29 | -1 |
| Manufacturing | 9 | 17 | 2 | -1 |
| Durable goods | 14 | 12 | 5 | 0 |
| Motor vehicles and parts | 1.7 | 3.8 | 1 | 0.6 |
| Nondurable goods | -5 | 5 | -3 | -1 |
| Private service-providing | 181 | 151 | 244 | 142 |
| Wholesale trade | 5.2 | 12.3 | 9.6 | 5.8 |
| Retail trade | 26.6 | 35.4 | 32.3 | 25.9 |
| Transportation and warehousing | 15.2 | -13.1 | 9.7 | 9.5 |
| Utilities | 2.2 | 0.1 | 0.1 | -0.1 |
| Information | 3 | 6 | 7 | 2 |
| Financial activities | 2 | 19 | 7 | 8 |
| Professional and business services(1) | 39 | 20 | 42 | 40 |
| Temporary help services | 15 | -7.8 | -7.5 | 11.4 |
| Education and health services(1) | 35 | 42 | 57 | 38 |
| Health care and social assistance | 27.6 | 49.8 | 34 | 30 |
| Leisure and hospitality | 39 | 24 | 70 | 13 |
| Other services | 14 | 5 | 9 | 0 |
What is more worrisome is the Hours and Earnings portion of the Employment Situation Summary (seasonally adjusted) where hours and wages remain stagnant.
| Total Private | Mar-14 | Jan-15 | Feb-15 | Mar-15 |
| Average weekly hours | 34.5 | 34.6 | 34.6 | 34.5 |
| Average hourly earnings | $24.34 | $24.76 | $24.79 | $24.86 |
| Average weekly earnings | $839.73 | $856.70 | $857.73 | $857.67 |
| Index of aggregate weekly hours 2007=100) | 100.2 | 102.8 | 103.1 | 102.9 |
The Beveridge Curve
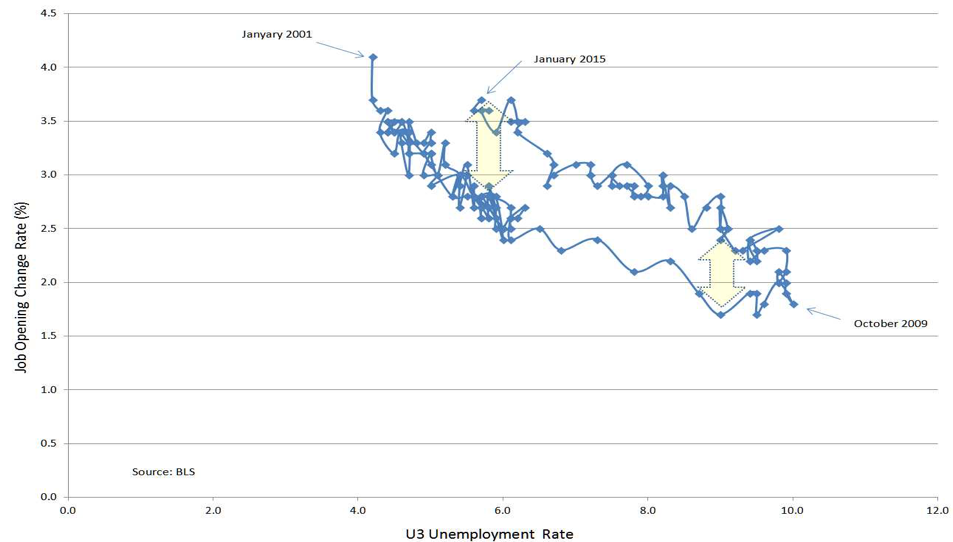
William Beveridge plotted the relationship between job vacancies and unemployment known as the Beveridge curve, as shown in the above graph, which contains information about the functioning of the labor market and the shocks that affect it. Using data from Bureau of Labor Statistics, the current Beveridge curve shows a steady gap (upward shift) in the job opening and unemployment relationship since the 10% U3 unemployment rate was reached in October 2009. This means that the ratio of job openings to a lowering unemployment rate over the past 5 years has remained fairly steady. Regardless if this draws the hypothesis that we have a structural unemployment[11] challenge in this country, we can conclude that there is a mismatch in job openings and those who are unemployed.
NAIRU
The Natural Rate of Unemployment is the rate of unemployment when the labor market is in equilibrium. It is the difference between those who would like a job at the current wage rate and those who are willing and able to take a job and include both frictional unemployment and structural unemployment (i.e. a worker who is not able to get a job because he doesn’t have the right skills).

The Natural Rate of Unemployment is sometimes known as the non accelerating inflation rate of unemployment (NAIRU)[12]. Since the Fed’s liftoff and future rate decisions are partially predicated on the “full employment” status, NAIRU is an important statistics. The short-term natural rate, as depicted in the graph above is used to gauge the amount of current and projected slack in labor markets, which is a key input into CBO’s projections of inflation. At the current U3 unemployment rate of 5.5%, it is very close to the short-term NAIRU of 5.38% for April 2015 and 5.1% in October 2015. However, with the historically low labor participation rate and the protracted double digit U6, the NAURU should be lower than projected. This means that NAIRU could be 4% or 4.5% to compensate. This also helps explain the lack of wage pressure and increase in hours worked data that typically are associated with full employment.
Inflation
Maintaining price stability is the second mandate for the Fed. The Fed is targeting a 2% inflation rate for the foreseeable future. Due to the volatility of food and energy prices, especially the current significant drop in oil and energy price, the FOMC focuses on the core inflation data or changes in consumer prices excluding food and energy. FOMC favors the use of Personal Consumption Expenditure (PCE) as the inflation gauge instead of the more well known Consumer Price Index (CPI). PCE is a measure of goods and services consumed by individuals, (also called the PCE deflator) and indicates the average increase in price for all personal consumption, whereas CPI represents the weighted average of prices of a basket of consumer goods and services. The core PCE is at 1.4%, well below the 2% target rate.

Future inflation is influenced by consumer expectation of future prices. Thus, it is informative to track the public’s perception of inflation going forward. One such indicator is the 5-Year Forward Inflation Expectation Rate. This captures the expected inflation (on average) over the five-year period that begins five years from today. As of April 9, 2015, the inflation rate 5 years from now is 2.09%. Although this is above the 2% target rate, the expectation has been steadily lowering since 2013. Another gauge is the Median expected price change in the next 12 months from the Thomson Reuters/University of Michigan Survey of Consumers. This offers the shorter term consumer inflation expectation. Although the 12 month sentiment remains above 2%, it is down from 3% plus in 2014.


Dollar, Oil & Earnings
Although the U.S. dollar strength and the oil price weakness are considered transitory by the Fed, they have immediate and meaningful impact to the US and global economy. The dollar strength continues the story of the U.S. economy being “the cleanest shirt in the laundry,” with a growth rate better than any other developed economy. Coupled with the economic strength is the end of QE and the beginning of interest rate liftoff by the FOMC. This divergence makes U.S. and U.S. assets more attractive. The collapse of oil prices globally contributes to a massive shift of income from producers to consumers. Even though the U.S. does not import its entire oil consumption, the savings from lower oil prices overall are a welcome addition to a recovering economy.

This is a net positive for the US economically, but there are at least two sides to every story. The strength in the U.S. dollar makes imports more attractive and supports disinflation. At the same time, the costs of U.S. goods are higher overseas. Foreign sales accounted for 33% of aggregate revenue in the 2013 revenue for the S&P 500. We are at the beginning of the quarterly earnings report season. According to FactSet[13], of the 24 companies that have reported their earnings for the first quarter (5% of the total), 70% cited that the strong dollar has a negative impact on earnings or revenue. According to FactSet, as of April 10th, “analysts and corporations have been more negative than normal in their outlook for the upcoming Q1 earnings season. Over the course of the first quarter, analysts in aggregate reduced the expected earnings for the index by 8.2% (on a per-share basis). This was the largest decline in the bottom-up EPS estimate for a quarter since Q1 2009. Companies also lowered the bar for earnings during the first quarter, as 85 companies in the index have issued negative EPS guidance to date, while just 16 companies have issued positive EPS guidance. If 16 is the final number for the quarter, it will mark the lowest number of companies in the S&P 500 issuing positive EPS guidance for a quarter since Q1 2006.”

Pay Me To Keep Your Money
With the combined effects of quantitative easing, geopolitial uncertainty, and deflation fears, Eurpoean sovereign bonds are all paying negative yields with the exception of Italy and Spain. For maturity up to 5 years, and in the case of Switzerland, 10 years, savers and investors are paying the sovereigns to keep their money. EU bonds are also in negative yield territory. In comparison, U.S., Canada, Australia, U.K. and Hong Kong are all in the positive yield camp. Even Japan has not turned negative (yet). The divergence in monetary policy, the rate of economic recovery from the financial crisis and the deleveraging cycle all contribute to this disparity. This has significant currency exchange, trade, and economic growth ramifications. If the European QE fails to serve as a fire starter for a sustainable economic expansion with greater employment with the help of regional structural reforms, then the eurozone will likely be mired in a Japan-like deflation for years to come.

The IMF View of the World
The IMF Spring Meeting in Washington this year will begin on April 17th. The theme is to prevent a “New Mediocre” from becoming a “New Reality.” The new projection for the world is to grow at 3.5% in 2015 and 3.8% in 2016, with advanced economies picking up and emerging and developing markets continuing to slow. Although the 2015 growth projection remains the same as the IMF’s January 2015 update and moved up by 0.1% for the 2016 world output, the 2015 projection of 3.5% is lower than the 3.8% projection stated in the IMF’s 2014 World Economic Outlook (“WEO”). As always, governments and global institutions tend to be too optimistic in their forward looking views.

According to the 2015 WEO[14], two deep forces are shaping the macroeconomic evolutions around the world and are shaping these evolutions over the medium term. Legacies of both the financial and the euro area crises are still visible in many countries. To varying degrees, weak banks and high levels of debt—public, corporate, or household—still weigh on spending and growth. Low growth, in turn, makes deleveraging a slow process. Potential growth in advanced economies was already declining before the crisis. An aging population combined with a total productivity slowdown has been the culprit and continuing. The effects are even more pronounced in emerging markets, where aging, lower capital accumulation, and lower productivity growth are combining to significantly lower potential growth in the future. More subdued prospects lead, in turn, to lower spending and lower growth today. Additionally, the current environment is dominated by two factors that both have major distributional implications: (1) the decline in the price of oil and (2) large exchange rate movements. The sharp decline in the price of oil came as a surprise. The genesis is a steady increase in supply from nonconventional sources (e.g. fracking) combined with a change in strategy by OPEC (keep production unchanged) while the oil consuming nations slow economically. The price declines have effected a large reallocation of real income from oil exporters to oil importers. For oil importers, lower oil prices will reduce inflation pressure and external vulnerabilities, and in economies with oil subsidies, the lower prices may provide some fiscal space to allow public spending to adjust gradually to lower oil revenues. Oil exporters have to absorb a large terms-of-trade shock and face greater fiscal and external vulnerabilities.
Exchange rate movements have been unusually large. Among major currencies, the dollar has seen a major appreciation and the euro and the yen a major depreciation. These movements clearly reflect major differences in monetary policy, with the U.S. expecting to exit the zero lower bound this year, but with no such prospects for the euro area or Japan. To the extent that both the euro area and Japan were at risk of another relapse, the euro and yen depreciations will help. To some extent, the U.S. has the policy room to offset the adverse effects of the dollar appreciation. Thus, this adjustment of exchange rates must be seen, on net, as good news for the world economy. Some countries’ currencies move with the dollar, others move with the euro and the yen. Thus, the currency movements have significant and unintended implications to countries with pegged currencies.

The 2015 WEO Executive Summary states that “the distribution of risks to global growth is now more balanced relative to the October 2014 WEO, but still tilted to the downside. A greater lift to demand from oil prices is a significant upside risk. The most salient downside risks identified in the October 2014 WEO remain relevant, however. Geopolitical tensions could intensify, affecting major economies. Disruptive asset price shifts in financial markets remain a concern. Term and other risk premiums in bond markets are still low in historical terms, and the context underlying this asset price configuration – very accommodative monetary policies in the major advanced economies – is expected to start changing in 2015. Triggers for turmoil include changing expectations about these elements as well as unexpected portfolio shifts more broadly. A further sharp dollar appreciation could trigger financial tensions elsewhere, particularly in emerging markets. Risks of stagnation and low inflation in advanced economies are still present, notwithstanding the recent upgrade to the near-term growth forecasts for some of these economies.”

Where Do We Go From Here?
For the U.S., we expect a 3% real GDP for 2015 with U3 unemployment continuing to get towards NAIRU even though the quality of jobs being created remains uninspiring. The gap between job opening and the U3 rate suggests a mismatch of skills and the unemployed, and this will take time to get back to normal. The post financial crisis NAIRU rate is likely to be lower than the conventional rate, and that means the U.S. still has a way to go before full employment is realized. Disinflation is showing some early signs of dissipating, but inflation is not likely to come back nor the 2% target core PCE rate is not likely to be reached until there is solid evidence of wage inflation. This is supported by a lack of increase in real weekly wages and increasing hours worked per week. Even though the U3 rate has reached 5.5%, there is not enough pressure across most job categories to witness the beginning of labor shortage and meaningful wage increases. However, with more people employed, stabilized housing prices, and an all-time-high equity market, Americans are feeling better. This means that consumers are poised to spend.
The University of Michigan’s Index of Consumer Sentiment[15] has reached a post crisis high recently, and its Current Economic Condition Index has also climbed to near pre-2008 high. Being a consumption-driven economy, these indicators, if sustained, are positive for the U.S. GDP going forward.


The Conference Board Leading Economic Index for February[16] also continues to advance.

The base case for the Fed is that the liftoff will be sometime this year after the June FOMC meeting and the rate increases will be stretched over a longer period of time with the medium term terminal rate to be lower than the equilibrium rate of the past (likely to be sub 4%). We expect the decision to be announced at the September or October meeting this year with an increase of 25bps. The world’s preoccupation regarding Fed action is moving away from the liftoff date and the initial rate move to the progression and speed of future rate increases and the equilibrium (terminal) rate for the medium term. The market will react when the liftoff is announced, but the market would react more depending on the forward guidance that comes with the liftoff announcement. Based on the data to date, it is reasonable to expect the Fed to raise rates gradually and in small increments to minimize any unintended shocks to the economy. The Fed’s move is normalization and not rate increase. The state of the economy and the absence of inflation do not warrant raising rates, but the economic recovery since 2008 is sufficient enough to begin bringing the rates gradually back to “normal.”
With the divergence in economic growth and monetary policies and the oil and currency fluctuations, there are ramifications to investments and the real economy.
- Financial repression remains the dominant theme globally. This means borrowers are rewarded at the expense of savers. Unconventional monetary policies such as QE and ZIRP punish risk adversity and encourage risk taking.
- The real economy has not kept up with the financial economy. With the extraordinary liquidity made available by central banks to promote risk taking in an attempt to jumpstart the global economy, yield and return seekers have driven financial assets to all time highs while the real economy lagged behind.
- Differing Monetary Policies Have Unintended Consequences. The U.S. and possibly the U.K. will lead in normalization while the eurozone and Japan continue down the course of QE to fight the headwind of deflation, slow growth, and high unemployment. Coupled with the relative healthier economy, the U.S. witnessed a significant appreciation in its currency which has both near term domestic and global ramifications. The dollar-bloc emerging market countries will not only have to deal with their own economic slowdown but to adjust to an appreciating dollar-pegged currency.
- Risk Taking Is Rewarded. The end of the U.S. QE did not dry up world liquidity as the monetary baton is passed to the ECB and BOJ. The risk safety net is still intact. With the oil price collapse and the price to remain low in the medium term, oil importing countries are net beneficiaries and Europe and Asia are clear winners. The latest PMI data shows that the eurozone economic activities have improved since European Central Bank implemented QE. Markets by definition are anticipatory and forward looking. It is no wonder that investment capital continues to head towards Europe. With financial repression in full force (negative yields in Europe), investors are forced to take on more risk and invest in equities.
Tony Crescenzi of Pimco recently explained on Bloomberg Radio that Fed policies transmit through five main channels: bond price, bond yield, lending standards, stock price and value of the dollar. As such, we should expect a change, positively or negatively, to each of these channels when the liftoff and normalization begin this year.
[1] https://www.allianzglobalinvestors.de/MDBWS/doc/14-03-151%20Fokus%20Asset%20Return%20EN-01.pdf?326b03ff8cd602cf0e48de5a14e01376b5aca0e0webweb
[2] http://research.chicagobooth.edu/igm/events/conferences/2015-usmonetaryforum.aspx
[3] Equilibrium-Real-Funds-Rate.pdf
[4] The rate consistent with full employment and stable inflation in the medium term
[5] http://www.cmegroup.com/trading/interest-rates/fed-funds.html
[6] https://www.frbatlanta.org/cqer/researchcq/gdpnow.cfm
[7] http://www.wsj.com/articles/u-s-retail-sales-up-0-9-in-march-1429014730
[8] http://www.census.gov/retail/
[9] A PMI reading above 50 percent indicates that the manufacturing economy is generally expanding; below 50 percent that it is generally declining.
[10] Total unemployed, plus all persons marginally attached to the labor force, plus total employed part time for economic reasons, as a percent of the civilian labor force plus all persons marginally attached to the labor force
[11] Shifts in the Beveridge Curve, Federal Reserve Bank of New York Staff Reports by Peter A. Diamond & Ayşegül Şahin. August 2014, http://www.newyorkfed.org/research/staff_reports/sr687.pdf
[12] The NAIRU in Theory and Practice, Journal of Economic Perspectives—Volume 16, Number 4, Fall 2002, by Laurence Ball & N. Gregory Mankiw, http://scholar.harvard.edu/files/mankiw/files/jep.ballmankiw.pdf
[13] https://insight.factset.com/what-factors-will-sp-500-companies-cite-as-negative-impacts-on-q1-earnings-and-sales
[14] http://www.imf.org/external/pubs/ft/weo/2015/01/pdf/text.pdf
[15] The Consumer Sentiment Index is a consumer confidence index published monthly by the University of Michigan. The index is normalized to have a value of 100 in December 1964. Each month, at least 500 telephone interviews are conducted of a continental United States sample.
[16] https://www.conference-board.org/pdf_free/press/PressPDF_5412_1426755611.pdf