As we enter the second quarter of 2012, many global macroeconomic risks that we faced since the sub-prime initiated financial crisis remain and in some cases are more exaggerated. One thing is true during this Age of Great Consequences is that can-kicking has a nasty boomerang effect. There are consequences for both actions and inactions. The hope of can-kickers is that everyone and every country will get out of their present predicament through economic growth if they simply buy enough time. While politicians taking the minimum of actions at the last possible second may have saved the day, it is becoming more and more challenging as time elapses, not to mention the erosion of viable alternatives. The highly indebted developed economies of the G-3 have transferred the unsustainable private debts and placed them onto already growing and now unsustainable public balance sheets. Decades of leverage fueled by abundance of cheap credit: 1) created the residential real estate bubble that 2) expanded into a shadow banking collapse, 3) a liquidity driven banking crisis, 4) a massive injection of public debts, 5) the disappearance of independent investment banks and further aggregation of assets to the systemically important institution so that they are even bigger than too-big-to-fail, 6) anemic economic recovery coupled with sustained high level of unemployment, and 7) more massive injection of public debt in an attempt to stimulate growth, risk appetite and prevent deflation. Following the Japanese, America and Europe are now transferring assets from savers to borrowers through a process referred to as financial repression (monetization of debt through debasing currencies, igniting inflation and holding interest rates low). The negative real rates of return paid to savers are used to offset the payments on mountains of public debt. In the meantime, the debt level gets larger while central bankers are ever-ready to issue more IOUs which punish the unemployed while dampening economic activities and aggregate demand.
Look At the View from the Cliff
During Fed Chairman Bernanke’s testimony before the House Financial Services Committee on February 29, 2012[1], he referenced that, under current law, there is going to be a massive fiscal cliff of large spending cuts and tax increases on January 1, 2013. This cliff is a direct result of previous can kicking. According to the March 29, 2012, study “Between a Mountain of Debt and a Fiscal Cliff – Finding a Smart Path Forward” by the Committee for a Responsible Federal Budget[2], the following are the building blocks to this cliff by December 31, 2012:
|
The Fiscal Impact of Policies That Expire or Activate in or after 2012 |
Cost of Renewal | |
| 2013-2014 | 2013-2022 | |
| 2001/2003/2010 Tax Cuts | $340 billion | $2.8 trillion |
| Expiration of American Opportunity Tax Credit (i.e., college tax credit) | $15 billion | $125 billion |
| Reduction of Child Tax Credit from $1,000 to $500 per child | $40 billion | $350 billion |
| Expiration of Child Tax Credit enhanced refundability | $10 billion | $90 billion |
| Expiration of EITC expansion | $10 billion | $95 billion |
| Elimination of 10% Bracket | $80 billion | $450 billion |
| Increase in rates from 25|28|33|35 to 28|31|36|39.6 | $95 billion | $730 billion |
| Restoration of phased outs for itemized deductions and personal exemptions | $20 billion | $165 billion |
| Expiration of reductions in marriage penalties | $10 billion | $55 billion |
| Increase in capital gains taxes from 15% to 20% and dividends taxes from 15% to being taxed as ordinary income | $25 billion | $315 billion |
| Expiration of various education and other tax benefits | $5 billion | $20 billion |
| Increase in estate tax from 35% over $5 million to 55% over $1 million | $35 billion | $430 billion |
| AMT Patches | $225 billion | $1.7 trillion |
| Cost relative to current law | $130 billion | $805 billion |
| Interaction with extension of 2001/2003/2010 tax cuts | $100 billion | $920 billion |
| Jobs Measures | $150 billion | $150 billion |
| Expiration of 2% payroll tax holiday* | ~$120 billion | ~$120 billion |
| Expiration of expanded unemployment benefits* | ~$30 billion | ~$30 billion |
| Doc Fixes | $30 billion | $270 billion |
| The Budget Control Act – Sequester[3] | $160 billion | $980 billion |
| 2% reduction to Medicare providers | $10 billion | $90 billion |
| Other mandatory reductions | $10 billion | $45 billion |
| 10% reduction in defense spending (down to 8.5% by 2021) | $80 billion | $510 billion |
| 8% reduction in non-defense discretionary spending (5.5% by 2021) | $55 billion | $335 billion |
| “Tax Extenders”^ | $60 billion | $455 billion |
| Subpart F for active financing income | $10 billion | $80 billion |
| R&E tax credit | $10 billion | $65 billion |
| Alcohol fuel tax credit | $10 billion | $60 billion |
| Other extenders | $30 billion | $250 billion |
| Net Interest | n/a | $1.1 trillion |
| TOTAL (without Jobs Measures) | ~$800 billion | $7.3 trillion |
| TOTAL (with Jobs Measures) | ~$1 trillion | $7.5 trillion |
Note: Cost estimates of policies calculating off of a current law baseline. Numbers are rounded.
* Assumes one-year extension only. Measures exclude expiration of bonus depreciation and expensing rules.
According to the Congressional Budget Office in its report “The Budget and Economic Outlook: Fiscal Years 2012 to 2022[4]”, the full impact of the fiscal cliff is a 3.5% hit to the GDP. According to Morgan Stanley’s David Greenlaw April 13, 2012, article “How Big Is the Fiscal Cliff in 2013?”, the full impact is closer to 5% for two reasons. First, the “CBO report was published in January and thus did not include the full impact of the payroll tax extension and other measures contained in the ‘Middle Class Tax Relief and Job Creation Act of 2012’ that was signed into law in February. Adjusting for this legislation (which adds $88 billion to the budget deficit in FY2012 and $26 billion in FY2013), the estimated fiscal tightening in FY2013 amounts to 4.0% of potential GDP rather than 3.6%. Secondly, and most importantly, almost all of the looming fiscal tightening takes effect on January 1, 2013… So, a fiscal year comparison understates the true magnitude of the change in tax policy that is faced on January 1.” If the U.S. GDP is growing at a 2% to 2.5% rate, this will drive us into a recession for sure.
Almost no one in Washington believes that lawmakers and the Administration will let this country fall over the cliff and hit bottom, so the base case is that the U.S. will fall over the cliff but the depth of the fall will be truncated. Both parties agree that something needs to be done about our tax code and the budget deficit. Some agreement will be reached, and this means austerity for the U.S. will likely begin in 2013. Being an election year and the fact that no one wants to be responsible for inserting fiscal pain on America, the policy outcome and economic impact are quite unpredictable. This adds uncertainty to the investors and businesses in 2012. Investors will likely take profit prior to 2013 due to this uncertainty and betting that taxes will be higher on capital gains and a possible US recession in 2013. We think of the fiscal cliff as more like a very steep ladder, and like a drunken sailor, we will fall one painful step or two at a time feeling the bruises and broken bones along the way. Depending on how this is resolved, the bond rating agencies are gearing up to possibly downgrade our debt once again, and talk of the U.S. losing its reserve currency status will be top news once again. However, barring any unforeseen actions, the U.S. will remain as the least dirty of the dirty shirts. The U.S. dollar may once again gain strength if Europe shows further signs of possible disintegration regardless of the irresponsible actions of our policymakers in the near term.
Are We There Yet?
Depending on what you read and who you give credence to, the real economy is either getting ready to grow faster and reach escape velocity from here or the economy is getting ready to roll over and return to a sub-par environment shortly. With the S&P 500 Index up 12.59% and the NASDAQ up 18.96% for the first quarter, the stock market is supporting the first scenario.
Since the end of the Great Recession, the U.S. has been on an anemic economic expansion. The fragility of the recovery has been supported by the massive, now fading, fiscal response and the ongoing monetary expansion in the form of quantitative easing and Twist. Yes, we are better than the dark days of the recession. Our economy is not in contraction. The unemployment rate is receding. Consumers are beginning to spend, and even our residential real estate prices appear to have leveled off. In fact, our corporations are more profitable quarter after quarter and have over a $1 trillion on their collective balance sheets. So, are we there yet? Will the economic expansion be sustained by the private sector alone?
Real gross domestic product (GDP) – the output of goods and services produced by labor and property located in the United States after adjusting for inflation – increased at an annual rate of 2.2% in the first quarter of 2012 (that is, from the fourth quarter to the first quarter), according to the “advance” estimate released by the Bureau of Economic Analysis. In the fourth quarter of 2011, real GDP increased 3.0%. The first quarter represents a drop of 0.8%. The following table shows that private consumption single-handedly supported the economy during the first quarter and government spending (or the retraction) was a negative contributor.
|
1Q2012 |
Total GDP
= |
Private Consumption + | Gross Private Investment
+ |
Government Spending
+ |
Exports
– Imports |
| Annual $ (trillions) | $15.30 | $14.19 | $5.36 | -$4.17 | -$0.07 |
| % of GDP | 100.00% | 92.73% | 35.00% | -27.27% | -0.45% |
| Contribution to GDP Growth % | 2.20% | 2.04% | 0.77% | -0.60% | -0.01% |
With the high probability that a portion of the fiscal cliff would become reality, the U.S. will be entering its period of austerity on January 1, 2013. Regardless of the outcomes in the fall election, a combination of government spending cuts and increase in taxes is the base case. Depending on the degree of austerity, the impact on private consumption and private investment components of the GDP beginning 2013 forward could be significant.
Since the US came out of the Great Recession in the third quarter of 2009, we have witnessed choppiness in the recovery. The lack of consistency and the slowing demonstrated by the Q1 data suggest we are in a New Normal economic environment where growth is tepid and the private economy has not successfully demonstrated that it can stand on its two feet and without massive government support, the U.S. will go back into recession.

Getting Back to Work
The U3 (the official unemployment measure) tells us that the economy is doing better with almost a monthly reduction in ranks of the unemployed, but the U3 number alone can be misleading.

The broader measure of unemployment, U-6, tells a more complete story. Although the unemployment rate is going in the right direction, the rate of change is significantly slower than U3 would suggest and shows that we still have significant problems with employment. So why is the U3 dropping at a faster rate? U3 is the total unemployed as a percentage of the civilian labor force. In order to calculate the percentage of unemployment, the Labor Department needs to estimate the actual number of people who are employed. This “labor participation rate” or the number of working-age people who are working has been steadily declining. A large part of this is attributable to discouraged workers decided to leave the workforce altogether and Baby Boomers retiring. With a shrinking workforce, the unemployment picture appears to improve even though the number of unemployment actively looking for jobs may not have reduced meaningfully. Without a serious reduction in the U6 unemployment rate, the aggregate demand in this country, as so reflected in the GDP, will continue to suffer.
According to the Department of labor, only employment in the health and education sectors have recovered since the beginning of the Great Recession. There is no question that the single sector that lost the most jobs is construction. It is interesting to note that state and local governments have both decreased in size while federal government employment has grown. If we are serious about austerity, cutting government contracts will lead the way to shedding jobs in the quarters and years to come.
| Economic Sector | End of 2007
(in 1,000) |
% change to
2-1-2010 |
% change
To 3-1-2012 |
| Total Private | 115,606 | -7.6% | -4.1% |
| Construction | 7,490 | -26.2% | -25.9% |
| Building Construction | 1,730 | -28.6% | -29.0% |
| Manufacturing | 13,743 | -16.6% | -13.2% |
| Wholesale Trade | 6,038 | -9.9% | -7.4% |
| Financial | 8,224 | -6.9% | -6.1% |
| Retail Trade | 15,571 | -7.6% | -5.6% |
| Transport, Warehousing | 4,548 | -8.9% | -4.2% |
| Arts & Entertainment | 1,993 | -5.1% | -3.3% |
| Other Private | 39,509 | -4.9% | -0.2% |
| Health | 13,103 | 4.5% | 9.0% |
| Education | 2,976 | 4.5% | 11.0% |
| Government – Federal | 2,756 | 4.2% | 2.5% |
| Government – State | 5,139 | 0.1% | -1.4% |
| Government – Local | 14,481 | -0.2% | -2.6% |
Moreover, payroll has been choppy at best.

The bottom line is that private job growth is returning but not at a pace that will get us to “full employment” (however that is defined) anytime soon. The April job number could be an anomaly, but even if we take an average of the last 3 months, the job market remains sub-optimal.

The more troubling part of the employment report is real wages. The chart above from the Economic Cycle Research Institute shows that the U.S. real personal income has been declining over the past months, and this is a troubling sign. Personal consumption has been up this year while credit spending is down along with savings. This means that consumer spending came right from their paychecks. If this real wage growth trend continues, personal consumption, which represents 70% of the U.S. GDP, will have to be curtailed.
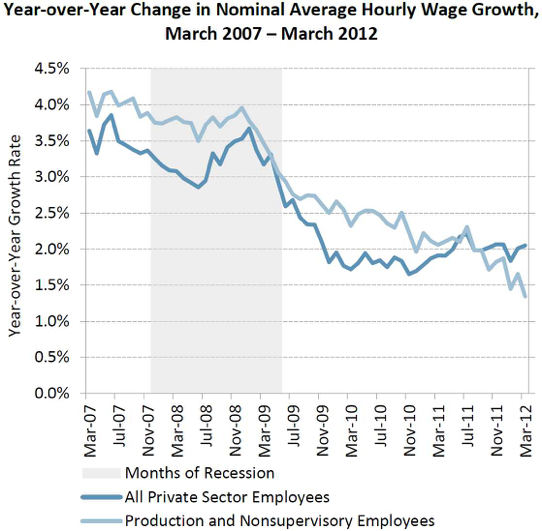
And according to the National Employment Law Project, “employment growth has been – and is expected to continue to be – skewed towards lower-income jobs, and wages for people trying to enter the workforce or become reemployed after job loss are declining. Moreover, increasing shares of employed workers are experiencing no wage growth, and those working in minimum wage jobs are stuck with historically low spending power.” In fact, the data shows that the nominal average hourly wage growth has been steadily declining since the beginning of the Great Recession. On a real (inflation-adjusted) basis, the story is even worse. These types of statistics contribute to the political discourse of “Two America”.
Have we hit bottom yet?
According to the Case-Shiller Home Price Index, the annual returns of the 10-City and the 20-City Composite Home Price Indices in February 2012 both fell by 0.8% over the month, resulting in annual returns of -3.6% and -3.5%, respectively. According to S&P, as of February 2012, average home prices across the United States are back to the levels where they were in late 2002 for the 20-City Composite and to early 2003 levels for the 10-City Composite. Measured from their June/July 2006 peaks through February 2012, the decline for both Composite is approximately 35%. February’s levels are new lows for both Composites in the current housing cycle.

Amid the sea of red, Miami, Phoenix and San Diego are showing positive price changes. On an annual price change basis, Denver, Detroit, Miami, Minneapolis and Phoenix have shown positive price movements. This could mean that these markets are beginning to recover.

In previous recoveries, housing and residential real estate construction was the engine of growth and employment. Since the last recession was a direct result of a severe real estate bubble, this important ingredient is now absent. In fact, real estate has been a detractor to wealth and aggregate demand. We believe that residential real estate prices will hit bottom this year and begin their slow and long climb back.
Just as you think you’re safe…they are back.
The European Central Bank (ECB), through their two long term refinance operation (LTRO) programs, injected over $1.3 trillion into the European banks. The first LTRO completed in December 2011 was €489 billion with 523 banks participating, and the second LTRO completed in February was €504 billion with 800 banks participating. The purpose of LTRO is to prevent a freezing of the interbank market, to slow the deleveraging process through lending cutbacks in European banks, and to ultimately prevent a credit crunch for the real economy by promoting lending to the private sector. We witnessed easing of interbank spreads, and core European banks were able to issue debt on an unsecured basis again. However, Spanish and Italian banks were the largest borrowers and significantly increased eurozone (EZ) sovereign exposures by buying sovereign debt from their own countries (i.e. a sovereign carry trade). This is a back door method for quantitative easing (QE) by the ECB, intended or not. As a result, we witnessed the sovereign interest rate spread (between peripheral countries and Germany) narrowed as a consequence. Holdings of Spanish government debt by domestic lenders jumped 26% in two months, to €220 billion at the end of January. Holdings of Italian sovereign bonds were up by 31% to €267 billion in the three month period ending in February.
 In late February, the European Union fiscal treaty (also known as the fiscal compact) was agreed to by 25 of the 27 European Union states with objection from Britain and the Czech Republic. The fiscal compact intends to eliminate the reoccurrence of the Greek debt crisis and to protect against the collapse of the euro currency. Member states must agree to keep their budget deficit below 3% of GDP and ensure their public debt does not exceed or is sufficiently declining towards 60% of GDP. Each government must adopt a permanent golden rule to limit public debt and budget deficits, and there is an obligation to introduce an automatic corrective mechanism to reverse any deviation from an EU-approved recovery plan if a government’s debt or deficit breaches the limits. The treaty must be ratified by January 2013. This is the EZ’s attempt to take some steps towards fiscal union.
In early March, the private-sector creditors to Greece’s sovereign debt agreed to take part in a “restructuring” scheme where bondholders will take a haircut of 85.5% on their €172 billion worth of Greek bonds; the remaining €34 billion would be defaulted. Another 69% of investors who own Greek bonds not issued under Greek law agreed to restructure roughly €20 billion. Due to the high number of “volunteer” creditors agreeing to participate, this allowed Greece to activate the collective action clauses, which gives Greece the power to make the terms binding for all holders of Greek bonds issued under domestic law. Resulting from these clauses, the total participation rate has reached beyond 90%, the hurdle Greece needs to jump over to meet all the conditions of its second €130 billion bailout from the European Union and International Monetary Fund.
Since the two LTROs, there has been a palpable calmness in the markets, and as yields came down, the euro went up along with global stock markets. In the meantime, the Greek jobless rate hit 21.7% in February and rose to 54% in the 15-24 age group. On average, more than 900 Greeks have lost their jobs every day over the year ending in February, for a total of 1.1 million, a 42% increase over 12 months. The budget shortfall is expected to widen to 8.4% of GDP in 2013 from a projected 7.3% this year, compared with a target deficit of 4.6%. According to the European Commission, Greece’s debt to GDP ratio is projected to rise to 168% next year from 161% with its economy to contract 4.7% in 2012. So far, austerity measured alone has not successfully made meaningful progress in calming the sovereign-banking-liquidity crisis, and last weekend’s election in Greece is a clear demonstration of a lack of confidence in the Greek government and a push away from austerity. Since the election yield spread has widened.

Unlike Greece, Spain’s problem stems from a real estate bust which lead to significant bad debt carried on the books of Spanish banks. Unlike the U.S., Spain and the rest of Europe rely on their banks as the main source of capital (the US has a very developed commercial bond market) and financing for the private and public sectors. Banks, in many ways, are instruments of each government. Taking a chapter out of the U.S. experience with its toxic assets, Spain is talking about setting up a “bad bank” to hold toxic real estate loan assets and bailing out or taking over banks.
In the meantime, Europe’s economy is in contraction. A recession is almost a certainty.

The challenge of Europe is structural. Although the fiscal compact, as the first step towards possible fiscal union, demonstrates the European’s recognition of the flaw in the EZ grade design, it requires time and will. Although austerity is a necessary ingredient to rein in spending and past financial sins, it alone will not be sufficient or practical. The dark side of austerity is civil unrest, deflationary spiral and political instability. European leaders recognized this and has been speaking out about a growth compact. This sounds right but the devil is in the details. To have growth in the peripheral countries means changing lifetime habits and cultures. The product and thrift of the north needs share with the south by shifting manufacturing and production while turning their saving mentality to a consumer mentality. The reverse must also be true. Greece, Portugal, Spain and Italy would need to take on the production and productive roles while make themselves net savers and belt tighteners at the same time. This type of generational change cannot be implemented overnight, if at all. The future of the EZ is more sovereign debts, more financial repression, more civil unrest, and more pain and suffering. Sequential quantitative easing or LTROs are the paths of least resistance. This will keep interest rates low for a very long time.
The following “Consequences of a Greek Default[6]” chain event map (made available by the Financial Times) illustrates and summarizes the possible course of event that will take place if Greece defaults on its sovereign debt.

So Where Are We?
We have been receiving inconsistent and uneven data for the U.S. economy. Depending on how each data is viewed, a case can be made that we are gaining strength or the economy is showing signs that it is weakening and recession will be the only conclusion. Either way, without a meaningful and sustainable job recovery, a stabilization of the residential real estate market, and consumers with confidence to borrow and spend, the U.S. GDP will remain treading water. The headwind of uncertainty about Dodd-Frank implementation, healthcare reform law, and the fiscal cliff is sufficient to dampen any animal spirit. Corporate America has done a great job in deleveraging, cleaning up its balance sheets and becoming very productive. Consumers have done some deleveraging primarily through work-outs and bankruptcy and still have ways to go. The federal government has not yet begun its deleveraging process. With the fiscal cliff, or the fiscal ladder as we see it, Mr. Obama or Mr. Romney will have to work with the Congress to take some action. The type of action will of course be political, but the end result is the same: raise taxes (or let tax cut expire) and cut spending (partial implementation of the sequester) and kicking the can down the road for as much and long as possible (including the debt ceiling issue). These are real and serious headwinds for 2013.
Before we get to 2013, we need to live through 2012. The French election, the Greece election (more to come) and the collapse of the Dutch government shows their citizens’ discontent with austerity, lack of growth and the direction or membership in the EU. Everyone now recognizes that peripheral Europe cannot “austere” itself out of the crisis; it also needs economic growth through exports and consumption. The strategic bond between France and Germany has been instrumental in keeping the policy-will of the northern European core on the rest of the EZ. With the change of presidency in France, it is not clear if the agenda of Merkel-Sarkozy can be maintained by Merkel-Hollande. President Hollande will likely take a different path than Sarkozy and a less EZ-centric approach in dealing with sovereign crisis. Last weekend was a serious and critical moment in the three year European sovereign debt crisis saga. It may be the pivotal point of change in political winds in Europe of a German-Franco alliance view of fiscal prudence and discipline. A Greece exit of the euro is now more plausible. It is as much subject to internal politics as it is testing the core-European alliance. If the exit is disorderly, the European banking system would be impacted seriously and would require a massive injection of liquidity and bailout by the ECB and, to a much lesser degree, the IMF. The market seems to have discounted this possibility of Greece existing the euro and disorderly default. Since the massive fiscal response from the U.S. and the more recent twin LTRO efforts, the world, in a perverse way, is a bit more assured. Like a Pavlovian dog, we have confidence that when the financial system is on the edge of the abyss, politicians will take necessary action to prevent it. This false sense of comfort may minimize or discount reactions by the market leading to a financial event.
Today JP Morgan announced that the bank suffered trading losses of $2 billion since the start of April. The loss stems from the firm’s risk management department in its failed effort to hedge the bank’s own risks. The bank entered into credit default swaps and other insurance like vehicles to mitigate risk to the bank. Well, obviously that did not work well. Although this is not likely to cripple the bank, it is extremely embarrassing and makes people worry about other JP Morgan investments and the investments of other money-centered banks and systemically important institutions. We all should be seriously concerned about the counterparties to derivative contracts globally and the ramifications to our banking and financial system if Greece decides to default on all its debts and exit the euro. Europe will continue to experience a shortage of liquidity in their banking system which will add more stress to the global financial infrastructure. The graphs below illustrate the connectedness of the global financial system.

China’s economy is slowing, and the base case is that they will engineer a soft landing (i.e. not a crash that will result in a negative rippling effect to the rest of the world). But the economy is producing imbalances that could be problematic to the political class. Not unlike the rest of the world, many countries are steps away from civil unrest and flare ups. The consequences of a financial bubble are often inequalities in wealth, jobs, security and income. This is being felt globally. Further, Middle East tension is always simmering. From the repression that gave rise to the Arab Spring to the perpetual conflict between Iran and Israel, these geopolitical risks can play a significant part under normal market conditions. A part of the New Normal is abnormal. For a confluence of factors, the chance of every scenario occurring has been enhanced, and the ability to predict outcomes is that much more elusive.
The U.S. will remain the cleanest among all the dirty shirts. We will remain the world’s reserve currency for now, and if the European crisis takes another leg down from here, the US dollar will rally and our already low Treasury bond yields will get even lower. Although there are signs of inflation, there are also reasons to fear deflation. The Federal Reserve will not raise rates, and if financial repression (keeping real interest rates low so that the borrowers can repay their debt with inflated future dollars) is the unspoken policy, rates will stay low far beyond 2014. Look for Quantitative Easing III (QEIII) and/or Federal Reserve Twist II, lowering of ECB rate and much more LTRO. Global stock market will be choppy with possible wide swings in response to or anticipation of macro events. If history is a guide, stock markets will fall as uncertainty and illiquidity increase and recover when central banks turn on their money printing apparatuses. We have seen this movie before. Gentlemen, put on your seatbelts and start your engines!
[1] http://www.reuters.com/article/2012/02/29/us-usa-fed-bernanke-idUSTRE81S1DO20120229
[2] Between-a-Mountain-of-Debt-and-a-Fiscal-Cliff
[3] Summary-Budget-Control-Act
[4] http://www.cbo.gov/sites/default/files/cbofiles/attachments/01-31-2012_Outlook.pdf
[6] http://www.ft.com/intl/cms/s/0/0a35504a-0615-11e1-a079-00144feabdc0.html#axzz1uaX0UNmx