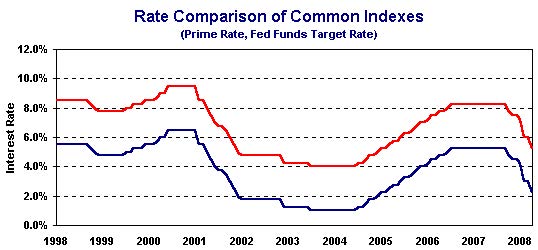
The March 18, 2008 press release from the Federal Reserve states that “[r]ecent information indicates that the outlook for economic activity has weakened further. Growth in consumer spending has slowed and labor markets have softened. Financial markets remain under considerable stress, and the tightening of credit conditions and the deepening of the housing contraction are likely to weigh on economic growth over the next few quarters. Inflation has been elevated, and some indicators of inflation expectation have risen… [i]t will be necessary to continue to monitor inflation developments carefully”.
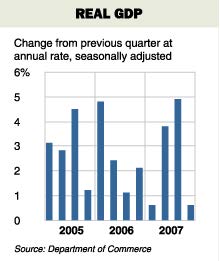
The first quarter has been difficult to put it mildly. In the fourth quarter last year many economists remained unsure if the US would be in a recession (defined as two quarters of back-to-back negative GDP growth) or a significant slowdown. Today almost everyone is talking about the duration of the recession and when the economy will be out of recession. Federal Reserve Chairman Ben Bernanke even mentioned for the first time that “recession is possible” during his April appearance in a Joint Economic Committee hearing. The final figures released by the U.S. bankruptcy courts show that 28,322 businesses sought bankruptcy protection in 2007, a 43% increase compared to a total of 19,695 in 2006. This is further evidence that US economy is likely contracting.
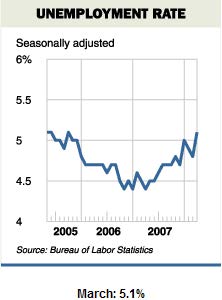
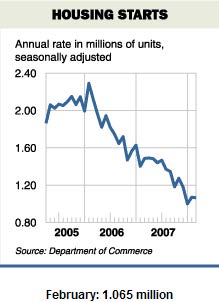
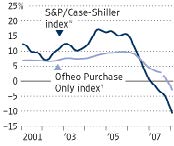
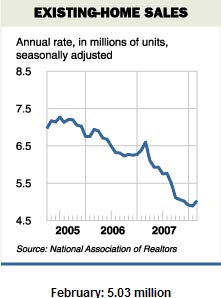
Housing construction is an important indicator of the US economic health and a significant contributor to US economic activities. Some economists do not expect any recovery in this sector until 2009, at the earliest.
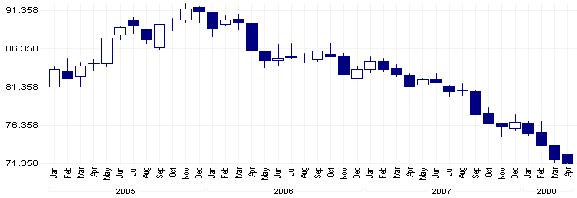
On Tuesday, the US dollar dropped to its all time low against the 15-country currency, the euro, at an exchange rate of $1.6018 per euro. This continues the multi-year retreat of the dollar. There are many factors that contributed to the shrinking dollar and the effects are beginning to affect the global economy. The main contributing factors are declining interest rates and economic slowdown in the US. The US dollar is not only declining against the euro but against almost all major currencies. As the following graph shows, since mid-2005 the US dollar has declined against a basket of foreign currencies of euro, Japanese yen British pound sterling, Canadian dollar, Swedish krona and Swiss franc (CHF) through yesterday. This decline is significant and is contributing to inflation here and abroad. The Malaysian ringgit hit an 11-year high and the Australian dollar a 24-year peak. The Singapore dollar reached a record high. While economic growth in Asia is expected to slow in 2008 partially as a consequence to the U.S. economy slowdown which dampens the region’s exports, rising consumer prices have made it difficult for central banks to ease monetary policy. This likely will keep their interest rates high and continue the pressure on the US dollar.
With currencies pegged to the dollar, oil exporting countries in the Middle East are importing inflation. The global commodity surge injected these countries with significant current account surpluses. This massive liquidity has stimulated domestic demand resulting in economic activities doubling and high inflation. Consumer price inflation in theses countries has jumped from 3.9% in 2001 to over 9% in 2007. A significant factor is the peg to the US dollar which has helped to import inflation. We do not believe this is sustainable in the long run and changes must be implemented.
According to Reuters, inflation in Singapore reached a 26-year peak and a 13-month high in Malaysia as Asian governments grapple with the problem of containing surging food and energy costs without choking off economic growth. Australian inflation accelerated to its fastest pace in 17 years. Indonesia and Vietnam raised their inflation forecasts, and the Philippine central bank said it would look at raising rates if commodity price rises began feeding into wages and other costs.
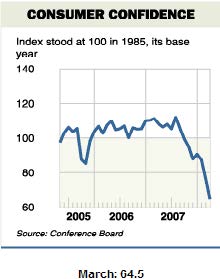
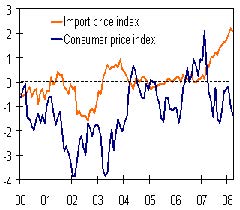
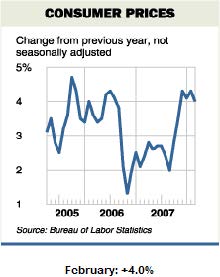
The more closely watched core CPI reading, which removes the volatile food and energy costs, was up 0.2% in March after being unchanged in February. On a year to year basis, the increase was only 0.65% for March which is the second worst showing since 1992. There is no question that the inflation pressure is building and is slowly eating away consumers’ purchasing powers. Import prices pose a growing threat to US inflation and are running almost 15% year-over-year, thanks to the weakening dollar and the rising commodity prices. The sharp increase in gasoline and food prices are pushing up retail sales and give a false sense of security to the US economy that the consumers are still spending at the same pace.
So how did we end up here? Without trying to oversimplify global economics, we should start at the end of the 20th Century where we experienced an unprecedented stock market valuation (now referred to as the Internet Bubble) and high productivity. After the market crashed, investors went from blatant disregard for risk to high risk aversion. The Federal Reserve lowered interest rates to avoid a severe recession and stimulate growth by injecting liquidity into the market. With interest rates at historical lows, investors turned to the real estate market as the next investment target. After 3 to 4 years of seemingly endless appreciation, the economy is humming along with consumers feeling good with an escalating home equity. From Wall Street to Main Street, investors have once again got comfortable with risk, leveraging on the cheap became a sure way to make money. The Federal Reserve began to raise interest rates in 2005, but regardless of how often the rates were increased there seemed to be no impact on the real estate market or cooling investors’ enthusiasm.
In the meantime, with the significant trade deficit with importing countries, such as China and Japan, much of their surpluses were invested in long term US government securities which further prevented the US intermediate and long term rates to rise. This extended the low mortgage rate environment and the real estate bubble. Beginning in 2007, the environment began to shift and the risk dynamics began to tighten.
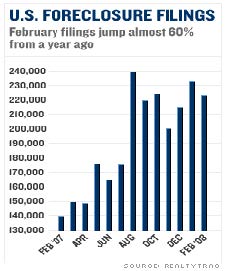
The contraction in real estate wealth and the choking of market liquidity happened quickly and severely. The most recent estimate is close to $1 trillion in write-off among global financial institutions. Although it started with the sub-prime mortgage debacle, the combined losses will far exceed the total value of the sub-prime loans outstanding. The rippling effect of extreme risk aversion is equivalent to throwing out the baby with the bath water.
We believe that the US is in a recession and we will not begin to recover until 2009 at the earliest. The US dollar has probably seen bottom against the currencies of the developed economies but will continue to adjust against emerging and oil export countries as they loosen or abandon their currency peg to the US dollar, but a meaningful reversal is also not likely until we enter the first leg of the next economic cycle since we are 6 to 12 months ahead of other economies. Commodity prices may remain high, but they will not likely continue their bull market for long as the rest of the world economies begin to slow. As the demand pressure is reduced, so will the commodity prices. This also does not mean that commodity prices will be significantly lowered in the near time since rising economies of China, India and Russia are growing their middle class and massively consuming commodities for domestic consumption. This will continue to apply pressure on all commodity prices.
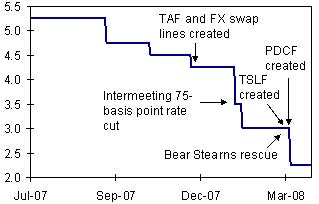
We are not supportive of any further interest rate reduction. Further lowering is not likely to have more effect on the real economy since this recession is caused by liquidity contraction. With the bail out plan for Bear Sterns, we have witnessed new approaches by the Fed to intervene in the market and the economy.
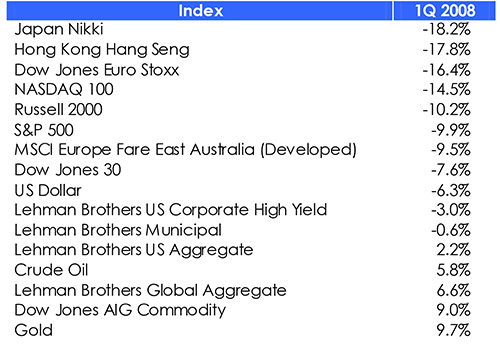
Under the weight of an economic slowdown (recession) and other uncertainties, the stock markets took a beating during the first quarter and extended their losses from the prior quarter. The market correction was not confined to the US alone. Foreign markets retreated in an acknowledgement that we are truly in an inter-dependent global economy as well as the recognition that a global slowdown is on its way. The following table summarizes the performances of the major market indexes for the respective periods:
This quarter clearly demonstrates two important aspects regarding portfolio diversification: 1) There is a significant downside correlation among equities. Many investors operate with the understanding that spreading their assets among domestic stocks with various capitalization and investment style as well as investing in foreign developed and emerging markets would help them to minimize their portfolio volatility. This may be accurate on the upside but obviously not on the downside. 2) Using non- or low-correlated investments (i.e. the investment movements are more independent from one another) provides the benefit of risk management in a down market.
