In our second quarter report, we highlighted a number of major macro risks that added significant downside risk to the economy and financial markets. At the top of the list was the European sovereign debt crisis. At that time, 2012 was shaping like a repeat of 2011 with renewed fear of an increasing propensity of a breakup in the European Monetary Union (EMU). Spanish and Italian borrowing costs were rising back toward the unsustainable 7% level. The death spiral[1] was showing its full force and effect. Overlaying this was the clear conflict between policymakers’ loyalties to their own countries and the desires or needs to hold the EMU together for the greater good of member countries as a trading bloc. The divide between the core countries, led by Germany, and the peripheral countries remained at a standstill. The U.S. has its own set of uncertainties as well – the November election, the fiscal cliff, debt ceiling, and the stubborn reality of the New Normal. Signs of a worldwide synchronized economic slowdown are brewing.
Now, welcome to the world awash in liquidity. The third quarter was buoyant by the July 26th European Central Bank’s (ECB) announcement that “[t]he ECB is ready to do whatever it takes to preserve the euro,” and the September 14 announcement by the Federal Reserve “to support a stronger economic recovery and to help ensure that inflation, over time, is at the rate most consistent with its dual mandate”. The two actions had an additive effect while aiming at two sets of risks. The ECB is expected to buy Italian and Spanish government bonds under the Securities Market Program (i.e. quantitative easing) to ease the liquidity and sovereign credit risks. This, in the intermediate term, truncated the tail risk of the breakup of the euro. The Federal Reserve action on the other hand is to continue its accommodative and expansion policy by being even more lax through a third round of bond purchasing without an end date and extending the low interest rate environment further. This is not QE3, it is “QE4ever”.
QE4ever
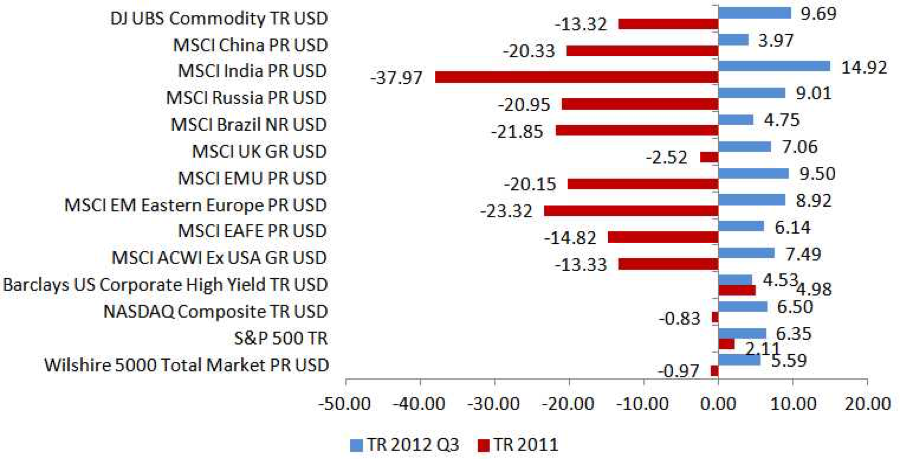
One of the intended consequences of QE is financial market euphoria where investors and savers would abandon caution, embrace risk and push risk assets higher. Well, the third quarter was a “risk-on” quarter globally.
Since the prior QEs have not yielded the sustainable desired outcome of 1) economic growth, 2) meaningful employment and 3) more inflation with any meaningful escape velocity, the Federal Reserve’s latest action can only be interpreted that the long-term ineffectiveness of QE2 and Operation Twist is not bad policy but simply insufficient. Combining with the extended Operation Twist program (i.e. QE2.5), the Federal Reserve will begin buying assets at a pace of $85bn per month for the rest of the year, at a rate similar to its QE2 program during 2010, and lower it to an open ended $40bn per month of mortgage-backed securities buying. Moreover, the Federal Reserve has extended the almost 0% interest rate environment further from late 2014 to at least mid-2015. As if this is not enough, the option of additional measures was left open, should the job market stay weak.
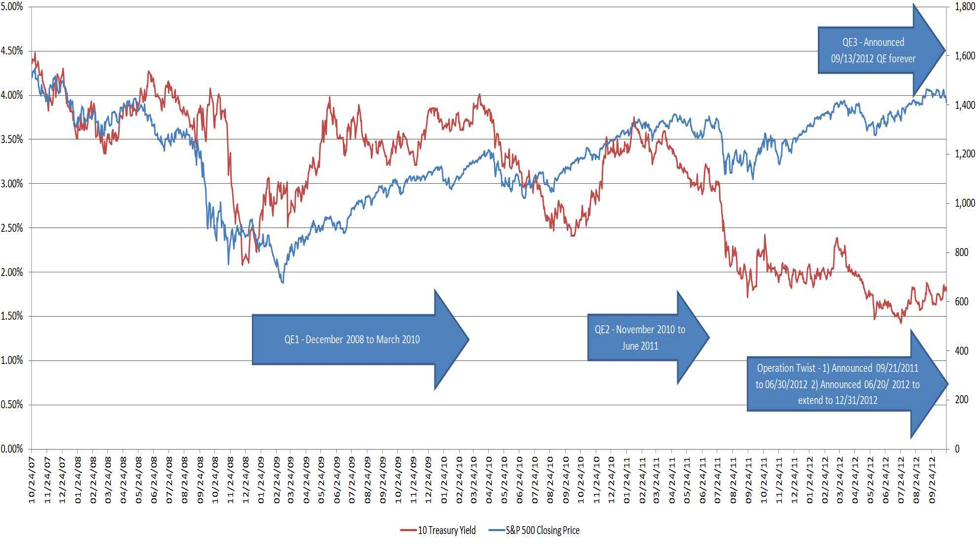 With the S&P 500 Index at pre-crisis levels and mortgage rates at 3.5%, Federal Reserve actions have certainly made an impact in making investors nominally wealthier and allow homeowners who qualify to refinance keep more money in their pockets. The problem is that there is no broad evidence this additional wealth or confidence has been pumped back into the economy completing the Federal Reserve desired economic virtuous cycle. A part of the answer to this lack of animal spirits can be traced to the continuing presence of significant fiscal and political uncertainty and the ongoing repair of consumer and public balance sheets through deleveraging. The government reported the third quarter real gross domestic product at 2% which is higher than the Bloomberg economist consensus of 1.8%.
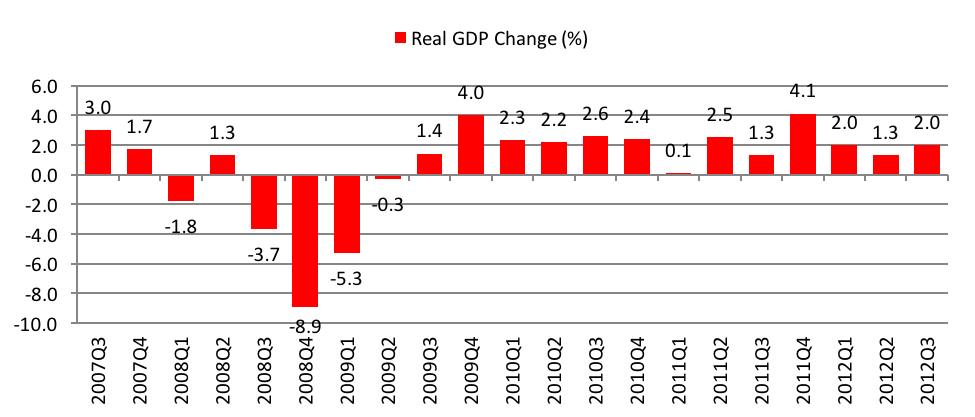
The Bureau of Economic Analysis calculates and reports the nation’s GDP each quarter. To understand the latest GDP[2] better, we should examine how each underlying component has contributed to the GDF. Bear in mind that this advance GDP estimate for the third quarter is based on source data that are incomplete and subject to revision.
| Real Index | 2012Q3 | 2012Q2 |
| Disposable Income | 0.80% | 3.10% |
| Personal Savings Rate | 3.70% | 4.00% |
| Price Index for Gross Domestic Purchase | 1.30% | 1.40% |
| Personal Consumption Expenditure | 2.00% | 1.50% |
| Durable Goods | 8.5% | -0.20% |
| Nonresidential Structure | -4.40% | 0.60% |
| Equipment & Software | -0.10% | 4.80% |
| Residential Fixed Investment | 14.40% | 8.50% |
| Exports | 1.60% | 5.30% |
| Imports | -0.20% | 2.80% |
| Federal Gov’t Consumption | 9.60% | -0.20% |
| National Defense | 13.00% | -0.20% |
| Private Inventories | -0.12% | -0.46% |
| Gross Domestic Purchases | 2.10% | 1.00% |
Residential Fixed Investment component jumped in the third quarter showing continuing signs of the residential real estate market stabilizing and rebounding. This is great news. The current low interest rates contributed to the overall affordability to purchase a home, which remains very attractive. Exports and imports are both trending lower, reflecting a global economic slowdown. Moreover, the real rate of disposable income has retreated from the prior quarter while personal savings has also lowered. Hence, the increase in consumer spending did not come from increasing wages. The Federal Government consumption and National Defense spending have both spiked up but are not sustainable, especially when we are at the doorstep of the Fiscal Cliff.
Monetary Policy Alone is Not Enough
Not unlike the remaining developed economies of Western Europe and Japan, the U.S. government debt, if not meaningfully addressed and reduced, will quickly become unsustainable. As a country, an increasing amount of our revenue will be used to service and repay the debt. This is before accounting for more deficits in the next few years and the increasing pressure from Social Security and Medicare payments. The bottom line is that Congress has no appetite to initiate fiscal stimulus. This has been the case since the end of the Great Recession, and the country has been relying on monetary policies via the Federal Reserve to get the economy going again.
Evidence so far in the U.S. and reviewing the history of quantitative easing in Japan does not support the notion that we can print our way to restoring economic vitality and increase aggregate demand. In the case of Japan, they are on their third Lost Decade.
US Labor Market
The U.S. economy is substantially driven by its domestic consumers. Thus the unemployment rate has a direct and rippling impact on the nation’s economy. During this quadrennial presidential election season, each candidate has emphasized certain aspects of the labor markets adding confusion to reality. But one thing everyone can agree on is that, regardless if the current unemployment woes are cyclical or structural, unemployment rates are too high.
Let’s first define some of the terms. According to the Department of Labor[4], the basic concepts involved in identifying the employed and unemployed are as follows:
- People with jobs are “employed“.
- People who are jobless, looking for jobs, and available for work are “unemployed”.
- People who are neither employed nor unemployed are “not in the labor force” or not counted.
The DOL’s monthly employment survey (a combination of two surveys[5] in deriving its monthly statistics) is designed so that each person age 16 and over who is neither in an institution (for example, correctional facilities and residential nursing and mental health care facilities) nor on active duty in the Armed Forces is counted and classified in only one group. The sum of the employed and the unemployed[6] constitutes the civilian labor force. Persons not in the labor force combined with those in the civilian labor force constitute the civilian non-institutional population 16 years and over. (There is no upper age limit.)
Further, the DOL defines the labor force participation rate as the total “employed and unemployed civilian labor force” divided by the “total non-institutionalized civilian population” This ratio for U3 calculation can be improved in two ways. The first is the conversion of unemployed to employed. This means the unemployed is getting jobs. The second is the elimination of employed through attrition because workers are so discouraged that they no longer fit the DOL’s definition of unemployed (for example, retirees).
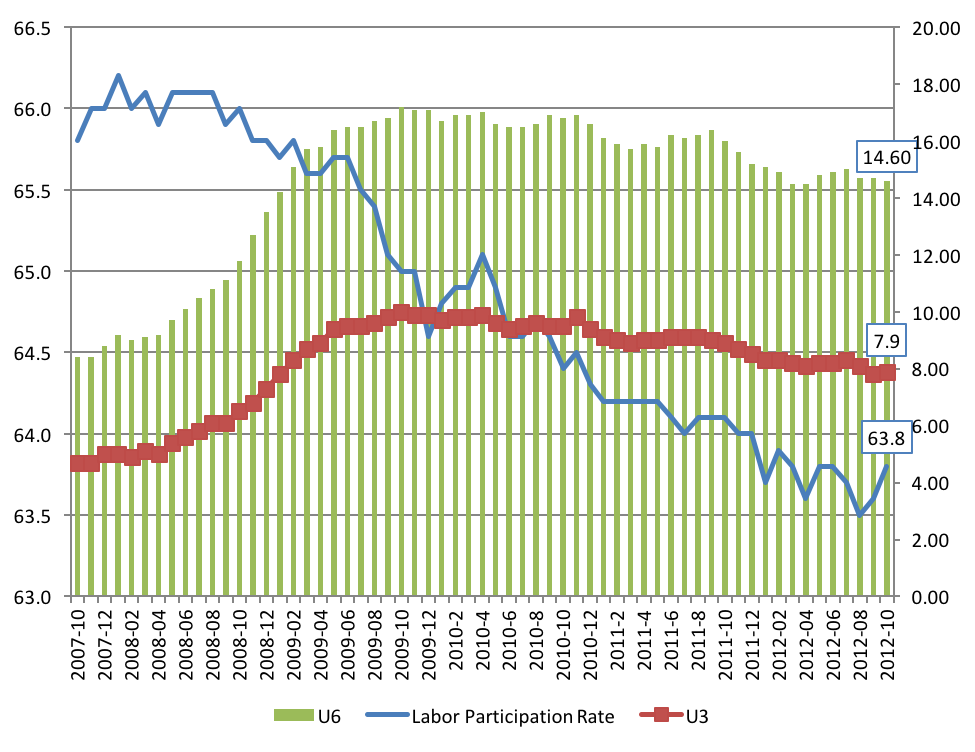
The following graph shows the U3[7] unemployment rate gradually move lower from 10% to 7.8%. Although U3 is the most recognized data in expressing the state of the U.S. employment, it is inadequate in understanding the broad employment picture. We prefer the unemployment data set captured by the U6 rate[8]. For the latest quarter, the U6 rate remains unchanged at 14.7% from its Great Recession high of 17.20%. It is important to note that the U6 rate does not speak about the those individuals so discouraged or have been out of work for so long that they decided to stop looking, retire or take no further action. To put unemployment improvement into the overall population context, we need to examine the overall Labor Participation Rate. The participation rate has been on the decline since it peaked in 2000, and as the participation rate continues its trend, as expected, any improvement of the unemployment rate should not be viewed in isolation. Thus the slow downward unemployment trend is not reflecting the stubborn unemployment challenge we face in the U.S.
 The U.S. requires an estimated increase of around 150,000 per month in order to absorb the new individuals entering the work force. The following graph using the DOL data since October 2007 through the current month to illustrate the months in which job creation was equal to or greater than the 150,000 threshold. Since February 2010, when the U.S. had a net loss of jobs, there were 13 months where job growth has been 150,000 or more and 18 months where job growth has been less than 150,000.
According to the DOL statistics[9], the U.S. lost a total of 8,779,000 jobs during the Great Recession from March 2008 through February 2010. Since then, 1,102,000, 1,840,000 and YTD 1,314,000 new net jobs have been created in 2010 (10 months), 2011 and 2012 (10 months), respectively. This represents a net gain of 4,256,000 job with another 4,523,000 job yet to be created to bring us back to January 2009.
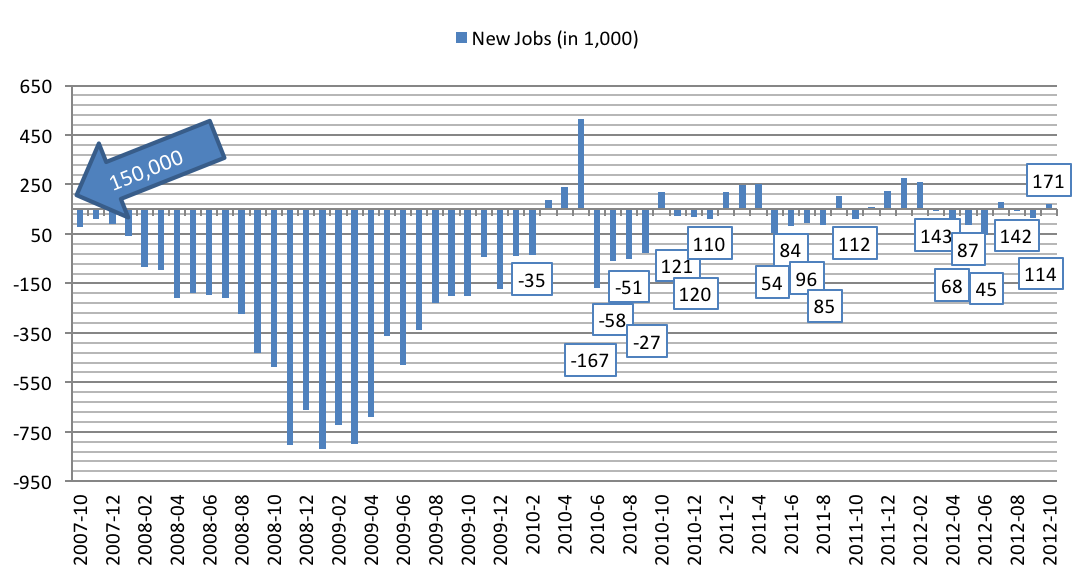 Based on this set of statistics and assuming an average of 150,000 jobs per month is needed to just meet new job demand, the recent improvements in the labor market (i.e.the 7.9% U3 rate for October) are not reflecting the challenges in the labor market completely and can be misleading. We need to generate 250,000 to 350,0000 new jobs each month to begin making meaningful reductions in unemployment in this country.
The U.S. Consumer
In late September, the Federal Reserve reported that household debt climbed $39.4 billion, the first gain in more than a year, to $13 trillion in the second quarter. It is likely that, when the time comes to report for the third quarter, the increased borrowing trend will continue since the Advance 2012Q3 GDP suggests a stronger consumer spending pattern. This is likely spurred on by the extremely accommodative Federal Reserve which pushes down borrowing costs (while not sufficiently relaxing consumer lending standards). This is good news for the economy but not necessarily good news for the individual consumer.
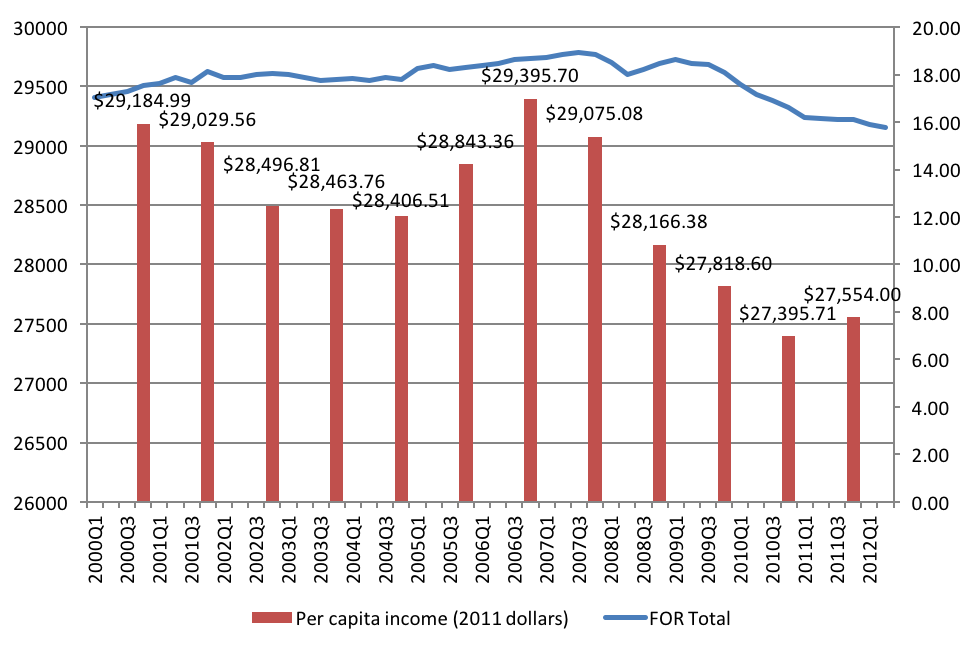
The following table shows the decrease in the U.S. per capita income. Since the high reached in 2006, the per capita income has continued to trend down. The 2011 income shows a slight bounce back and is close to the low of this decade. The good news is that the total private debt has also lowered according to the Federal Reserve financial obligations ratio[10] (FOR).
 Reduction in debt or deleveraging came from defaults, financial institution writeoffs and repayments. It appears that the average consumer is repairing his balance sheet but the process is uneven. Credit card debt is the third largest source of household indebtedness, after accounting for mortgage debt and student loans, averaging $15,587 per indebted household as of June 2012[11]. According to the Federal Reserve:
| Total Credit Card Debt | Average Household Credit Card Debt | Average Indebted Household Debt | |
| July 2012 | $850.7 billion | $7,149 | $15,325 |
| Change from June 2012 | -0.6% | -0.6% | -0.6% |
| Change from July 2011 | 6.9% | 5.9% | 5.9% |
| Change from June 2012 (annualized) | -6.7% | -7.5% | -7.5% |
| Change from July 2011 (annualized) | 82.7% | 71.3% | 71.3% |
According to John Krainer, a senior economist in the Economic Research Department of the Federal Reserve Bank of San Francisco, households are still facing credit supply challenges. “The extent of deleveraging in consumer nonmortgage debt differs by households in different markets…highly indebted households seek to reduce debt loads when house prices fall substantially. The most important differences appear to depend on the type of borrower. Within a county, borrowers who defaulted on mortgages tended to experience much larger reductions in nonmortgage debt than borrowers who stayed current on mortgages. Borrowers with low credit scores experienced larger reductions in nonmortgage debt than borrowers with high credit scores. These results suggest that tighter credit conditions also are probably restricting the flow of credit to consumers. Moreover, these changes in credit supply appear to be working at an aggregate rather than a regional level.”
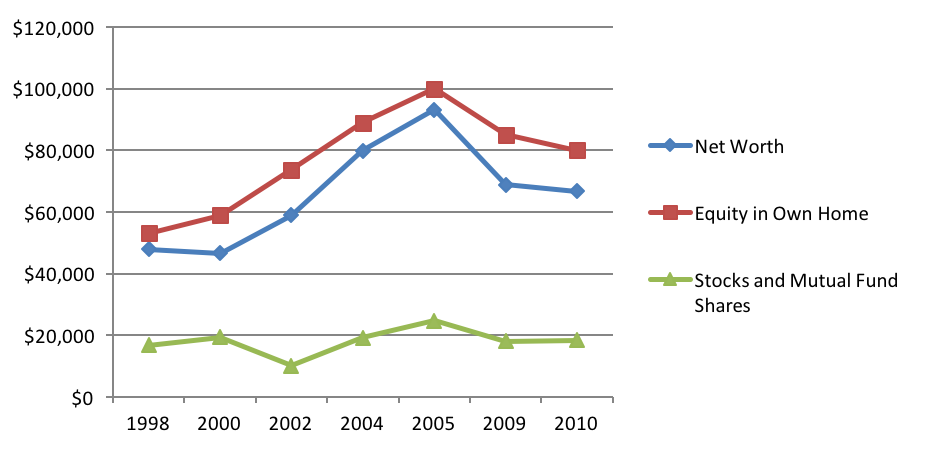
Finally, the American net worth remains at the 2003 level according to the US Department of Census[12].
In summary, the US consumer, who is responsible for two thirds of the U.S. economy, is doing better than at the depth of the financial crisis, but the average consumer is not feeling wealthier in terms of net worth or by income. Even with low interest rates and without relaxing credit standards, consumer borrowering will be uneven and will not be sufficient to add strength in aggregate demand.
The Fiscal Cliff
The fiscal cliff is an all encompassing term for a number of major tax and fiscal events that can push the US economy into a recession. First, the Budget Control Act of 2011, signed into law by President Obama last year, intended to delay deficit reduction decisions until the end of this year. If a deficit reducing bill is not passed by the end of this year, $1.2 trillion “sequestration” cuts will automatically be implemented over 10-years. The budget cut items are to be across the board and Congress shall have no influence on how the cuts are distributed. Cuts are to be evenly divided among defense and non-defense departments. The Budget Control Act is made up of a combination of tax increases and spending cuts and intends to cause a sharp reduction in the federal budget deficit. The combined actions are supposed to generate $500 billion in tax revenue and $110 billion from spending cuts. The following is a summary of the sources of revenue and the groups of taxpayers that will be affected:
Expiring Bush-Era Tax Cuts
| Tax | More Details | Who did it help? |
| Lower tax rates for the top four tax brackets | The Economic Growth and Tax Relief Reconciliation Act of 2001 (EGTRRA) reduced rates for high income-earners | High income earners |
| No limitations on itemized deductions | 2010 saw the repeal of itemized deduction limits (which formerly mainly affected high income-earners) | High income earners |
| Lower taxes for families with children | As a result of EGTRRA, the child tax credit increased from $500 to $1,000 | Families with children |
| Lower taxes for married couples | EGTRRA reduced marriage tax penalties and increased the earned income tax upper threshold | Low-income married couples |
| Lower taxes on long-term capital gains | Long-term capital gains are profits on assets that have been held for one year or more. This mainly benefitted high income-earners because they have more invested assets | High income earners |
| Lower taxes on qualified dividends | Instead of being taxed at the same rate as income, the tax rate on qualified dividends was lowered so that it was the same as the tax rate on capital gains | High income earners |
Expiring Obama-Era Tax Cuts
| Tax | More Details | Who did it help? |
| Increase in Earned Income Tax Credit (EITC) and expansion to more families | The EITC wage subsidy rate was increased from 40% to 45% for large families (3+ children) and the credit phase-out range for married couples was raised by $2,000 | Low income earners and large families |
| Child Tax Credit Refund | Families were able to claim a child tax credit of $1,000 for dependent children under 17 | Families with children |
| American Opportunity Tax Credit (AOTC) for college students | This credit replaced the Hope credit, allowing students (earning under $80,000 as individuals or $160,000 as a joint couple) to claim this credit for four years instead of two years, raising the maximum credit by $700, and increasing the allowable refund to 40% | Students and families earning under $160,000 per year |
Secondly, 163 million workers can expect to feel the pinch of a big tax increase regardless of who wins the election. The temporary payroll tax holiday provided under the Temporary Payroll Tax Cut Continuation Act of 2011 that extended a 2% payroll tax cut for employees is sechduled to end on December 31, 2012[13]. According to the Congressional Budget Office[14], taken together, “these policies will reduce the federal budget deficit by $607 billion, or 4.0 percent of gross domestic product (GDP), between fiscal years 2012 and 2013. The resulting weakening of the economy will lower taxable incomes and raise unemployment, generating a reduction in tax revenues and an increase in spending on such items as unemployment insurance. With that economic feedback incorporated, the deficit will drop by $560 billion between fiscal years 2012 and 2013, CBO projects. If measured for calendar years 2012 and 2013, the amount of fiscal restraint is even larger.
According to CBO’s estimates, the tax and spending policies that will be in effect under current law will reduce the federal budget deficit by 5.1 percent of GDP between calendar years 2012 and 2013 (with the resulting economic feedback included, the reduction will be smaller).”
| Policy to Expire | $ Billion |
| Bush-era tax cut (Below $250,000 Income) | 198 |
| Alternative Minimum Tax Patch | 120 |
| Payroll Tax Holiday | 115 |
| Automatic Spending Cuts (Sequestration) | 100 |
| Bush-era tax cut (Above $250,000 Income) | 83 |
| Emergency Unemployment Insurance | 40 |
| Affordable Care Act | 20 |
| Medicare Doctor Fix | 20 |
| Tax Extenders | 20 |
| Bonus Appreciation | 12 |
| TOTAL | 728 |
| % of GDP | 4.60% |
With the uncertainty of the presential election as well as congressional elections, it is difficult to predict the likelihood of the U.S. going over the Fiscal Cliff in 2013. It is unlikely that the lame duck Congress will take any action between now and the end of this year. The base case, however, is a combination of expiration and punting other decisions into the future through the use of temporary extensions. The U.S. will likely avoid the fiscal cliff in its entirety but experience certain amounts of fiscal drag due to tax increases. Moreover, a repeat performance of the debt ceiling theater will be likley in February resulting in credit rating downgrades and causing havoc to the financial markets.
The State of the World Economy – Policy Risk
The October 2012 issue of the World Economic Outlook[15] (WEO) is the latest annual surrvey and analysis by the International Monetary Fund (IMF). The opening statement is very telling about the global financial stability: “The global economy has deteriorated further since the release of the July 2012 WEO Update, and growth projections have been marked down. Downside risks are now judged to be more elevated than in the April 2012 and September 2011 WEO reports. A key issue is whether the global economy is just hitting another bout of turbulence in what was always expected to be a slow and bumpy recovery or whether the current slowdown has a more lasting component. The answer depends on whether European and U.S. policymakers deal proactively with heir major short-term economic challenges”
| Year over Year | |||||||||||||
| Difference from | Q4 over Q4 | ||||||||||||
| Projections | 07/2012 WEO Update | Estimates | Projections | ||||||||||
| 2010 | 2011 | 2012 | 2013 | 2012 | 2013 | 2011 | 2012 | 2013 | |||||
| World Output | 5.1% | 3.8% | 3.3% | 3.6% | -0.2% | -0.3% | 3.2% | 3.0% | 4.0% | ||||
| Advanced Economies | 3.0% | 1.6% | 1.3% | 1.5% | -0.1% | -0.3% | 1.3% | 1.1% | 2.1% | ||||
| US | 2.4% | 1.8% | 2.2% | 2.1% | 0.1% | -0.1% | 2.0% | 1.7% | 2.5% | ||||
| Euro Area | 2.0% | 1.4% | -0.4% | 0.2% | -0.1% | -0.5% | 0.7% | -0.5% | 0.8% | ||||
| Japan | 4.5% | -0.8% | 2.2% | 1.2% | -0.2% | -0.3% | -0.6% | 0.0% | 1.2% | ||||
| UK | 1.8% | 0.8% | -0.4% | 1.1% | -0.6% | -0.3% | 0.6% | 0.0% | 1.2% | ||||
| Canada | 3.2% | 2.4% | 1.9% | 2.0% | -0.2% | -0.2% | 2.2% | 1.7% | 2.2% | ||||
| Other Advanced Economies | 5.9% | 3.2% | 2.1% | 3.6% | -0.6% | -0.6% | 3.0% | 3.2% | 3.5% | ||||
| Emerging Market and
Developing Economies |
7.4% | 6.2% | 5.3% | 5.6% | -0.3% | -0.2% | 5.7% | 5.5% | 6.2% | ||||
These downwardly revised global GDP numbers do not tell the whole story and we believe the base case to be worse for 2013. According to the WEO report, the risks to the forecast have significantly risen. The IMF standard risk metrics point to a much higher downside risk now even when compared to a few months ago, even though the probability of an upside surprise has also been elevated, although much less so. This is the bimodal outcome that we spoke of last quarter. Although there are many factors influencing the outcome of global economic recovery and expansion, the greatest drivers rest with U.S. and European policymakers. The short term down risks are predicated on the escalation of euro area crisis and fiscal policy failures in the U.S.
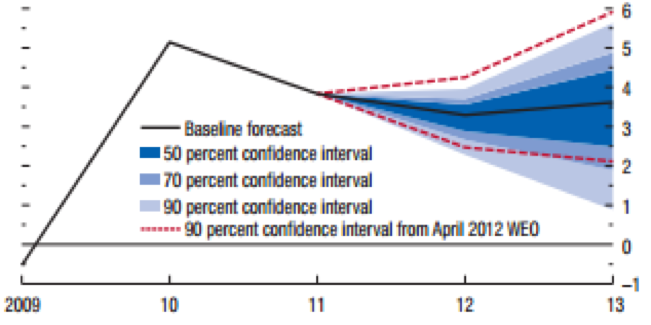
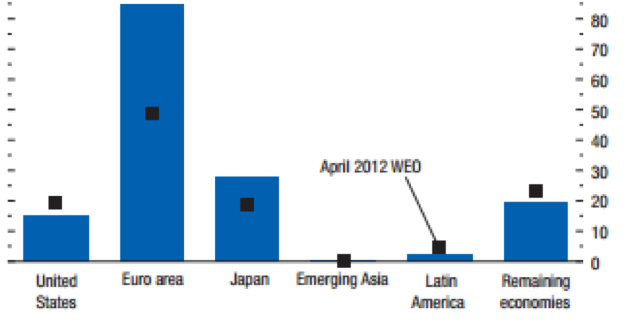
The following fan chart[16] (figure 1.11 on page 14 of the WEO) illustrates the wide deviation of outcome projected by the IMF regarding the world GDP growth rate for 2013.
The World Is Slowing – Eurozone
The probability of the 2013 global growth rate falling below 2% has risen to about 17%, up from about 4% in April 2012 and 10% in September 2012. A 2% global GDP would be assuming a recession in developed economies and serious slowdown in developing and emerging economies. The following chart shows the increasing chance of a recession in the eurozone.
 The following is a series of charts and data that show the latest economic activities in the eurozone:
Data collected 12–24 October
- Final Eurozone Manufacturing PMI at 45.4 in October (flash estimate 45.3)
- Rates of contraction in output and new orders accelerate, as demand remains weak
- Job losses recorded in almost all nations, with Ireland the sole exception
- Manufacturing output declined for the eighth month in a row during October, and at a faster rate than in the previous month.
October 2012 Manufacturing Purchasing Managers’ Index (PMI)
| Country | PMI | Status |
| Ireland | 52.1 | 3-month high |
| Netherlands | 48.9 | 3-month low |
| Germany | 46.0 | 2-month low |
| Italy | 45.5 | 2-month low |
| Austria | 44.8 | 40-month low |
| France | 43.7 | 2-month high |
| Spain | 43.5 | 3-month low |
| Greece | 41.0 | 4-month low |
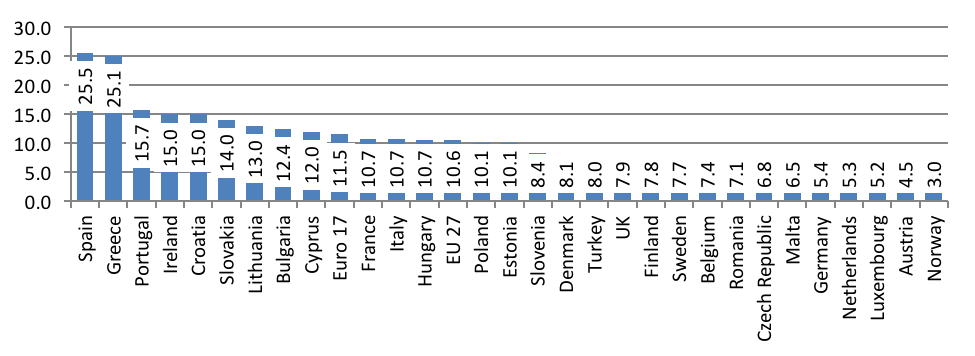
July through September 2012, the average unemployment rate in each eurozone country[18] continues to remain unsustainable and in the fringe countries unstable.
 The World is Slowing – China
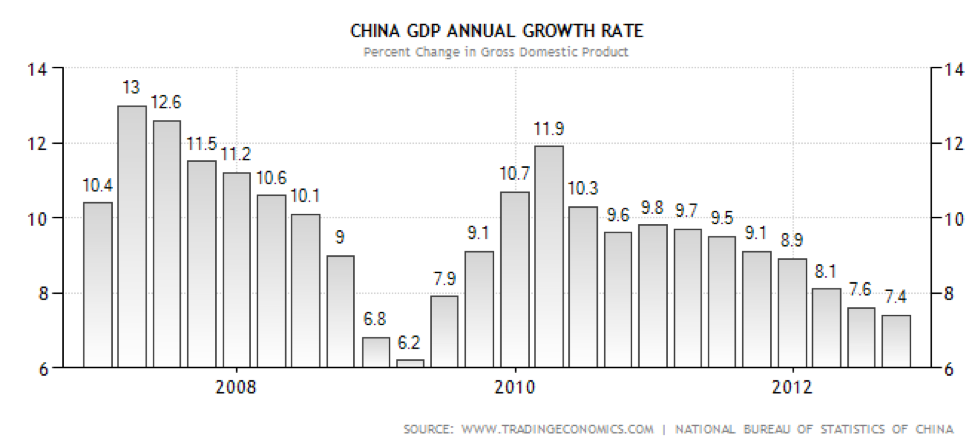
China’s economic slowdown has been widely reported and followed. The latest report shows a continuing slowdown over the past 10 months[19]. Many observers believe that China may never return to its double digit growth rate again.
There has been a lot of discussion or speculation about the China slowdown, and the question is would this be a hard or soft landing. The economic development over the past 20 years has been nothing less than spectacular in China. This is especially so considering it is the most populace country. Not unlike many emerging and developing countries before, the rite of passage is to first become the manufacturing floor for the world and investing in the country’s infrastructure. This has typically resulted in holding its currency in check to maintain competitiveness, transferring technologies and intellectual properties, and huge foreign reserves and trade surpluses. To counter the impact of the Great Recession, China loosened its monetary policies and wielded its fiscal might that resulted in a real estate boom of a generation. With the rest of the world still mired in the New Normal, China can no longer depend on export or fiscal spending to sustain its economic growth and survival. As a part of the country’s economic evolution, China recognizes its need to look to its domestic market for answers. Being a totalitarian and socialist single party controlled regime, its control and rule is rigid and fragile. Turning inward for economic answers at a time of its decennary power transfer this month adds a further layer of uncertainty.
According to the October HSBC China Manufacturing PMI report, the manufacturing economy measured 49.5 in October, up from 47.9 in September, to signal a full year of monthly deteriorations in Chinese manufacturing sector operating conditions. However, with the PMI at an eight month high, the latest data indicated the rate of deterioration was marginal. Manufacturing output in China contracted modestly in October and at a slower rate than in September. New orders grew, albeit marginally, for the first time in 12 months, as nearly 20% of firms reported a higher number of sales in October.
Evidence suggested that growth of new orders was due to an increasing number of new clients. However, new export orders declined for the sixth successive month, with the rate of reduction again solid (but slower than in September). Weak demand from Europe and the US was reported. Backlogs of work fell during October for the third month in a row. The rate of backlog depletion was marginal and similar to September. Employment levels continued to fall in the latest survey period at a modest rate, with nearly 10% of panelists reporting lower staff numbers. Anecdotal evidence suggested that job losses reflected lower production requirements.
Conclusion
The slowing world is a primary example of the consequences from the financial excesses-led Great Recession. The policy actions of the past few years have moved the world financial system from falling into the abyss while adding significantly more debt onto already over burdened sovereigns. Without the ability or willingness to borrow more, governments are relying on central banks to use monetary policies to mask economic dislocations and stimulate growth. Growth is the elixir. With economic growth, unemployment will come down, lead to greater aggregate demand, drive up income and tax base, and make current sovereign debt service more manageable while narrowing or even eliminating budget gaps. The trouble in the eurozone is that most of the efforts and attention are placed on addressing debt, budget and the banking system. Although these are important and necessary to appease the creditors and lenders, they remain short lived and cannot bring long term stability. Creditors, lenders and super-sovereigns must take haircuts as they mutualize the existing bank and sovereign debt while bring in banking and fiscal union.
However, the real and much more difficult challenge is to restore sustainable growth and not the kind built on debt, leverage and excess. The demand for austerity by core Europeans for the peripheral countries as a precondition for assistance is nothing less than a game of chicken. After 5 years into the crisis, the Band Aid solutions not only lead to depression in labor markets but also economic consequences now clearly rippling to the “healthy” core. The solutions have not been structural and are nothing more than throwing good money after bad. Civil unrest will become more widespread and intense which leads to political instability and further dampens the ability for the European Monetary Union to stay together and to garner the confidence necessary for internal growth. There are no easy solutions and the ongoing “kicking the can down the road” strategy can only work if the road leads to structural reform and growth and can-kicking is to buy the necessary time to strengthen the dials for growth. As a case in point, watch out, Greece is back for more and we affirm that it will exit the EMU.
The US is a much different story but with similar challenges. Yes, we are the least dirty shirt in the laundry, but we are all in the same laundry basket. In a globally linked world of finance and trade, we have dealt with our debt problems better and faster than the Europeans and we are achieving GDP growth rates that are also superior. However, being less dirty may be helpful in relative investment return but without our own version of structural reform, the days of 4% to 5% real GDP growth cannot return.
The third quarter ushered in excellent investment returns in the US and globally. This is attributable to the global unlimited quantitative easing, the affirmation of low or reducing interest rates, and the appearance of the bazooka from the ECB. Taking more investment risk has not been translated into taking on more business risks to hire, build, expand and invest by private industries. In the eurozone, the reason is obvious. The worst is not over and the near future remains bleak. In the U.S., the uncertainty of the election, debt ceiling and fiscal cliff are great reasons to be cautious. The stock market, a bastion of irrational optimism, can be a significant disconnect with the real economy, but over time, the stock market will mirror the underlying economy. There is no question that passively investing in US Treasuries is a guarantee for a negative real rate of return and bonds in general is overbought. This makes stocks look more attractive. Investors should be clear minded about their investment horizon. What is deemed safe today may be the most disappointing asset in their portfolio.
Our future remains in the hands of an elite group of policymakers and politicians. The degree of their actions or inactions will continue to drive the real economy and financial markets. We expect the continuance of a risk-on and risk-off market environment with greater volatility. Even though our base case remains that the US will muddle through and the New Normal remains intact, the bimodal outcome of extremes (realized or perceived) keep all of us on the edge of our seat while floating in this zero return world.
[1] deleveraging -> austerity -> recession -> high unemployment -> low tax receipt -> increased borrowing -> lower credit rating -> increase borrowing costs -> bailout -> deleveraging
[2] http://www.bea.gov/newsreleases/national/gdp/gdpnewsrelease.htm
[4] http://www.bls.gov/cps/cps_htgm.htm#concepts
[5] The payroll survey—the headline source for job growth—is officially known as Current Employment Statistics (CES); the household survey is known as the Current Population Survey (CPS). Both surveys are produced by the U.S. Department of Labor’s Bureau of Labor Statistics (BLS). Their results, available monthly, are released jointly as the Employment Situation Summary.
[6] Who is counted as unemployed?
Persons are classified as unemployed if they do not have a job, have actively looked for work in the prior 4 weeks, and are currently available for work. Actively looking for work may consist of any of the following activities:
- Contacting:
- An employer directly or having a job interview
- A public or private employment agency
- Friends or relatives
- A school or university employment center
- Sending out resumes or filling out applications
- Placing or answering advertisements
- Checking union or professional registers
- Some other means of active job search
[7] U3 is the official unemployment rate, which is the proportion of the civilian labor force that is unemployed but actively seeking employment.
[8] The U6 unemployment rate counts not only people without work seeking full-time employment (the U3 rate), but also counts “marginally attached workers and those working part-time for economic reasons.” Note that some of these part-time workers counted as employed by U-3 could be working as little as an hour a week. And the “marginally attached workers” include those who have gotten discouraged and stopped looking, but still want to work. The age considered for this calculation is 16 years and over.
[9] http://data.bls.gov/timeseries/CES0000000001?output_view=net_1mth
[10] The financial obligations ratio is an estimate of the ratio of debt payments to disposable personal income. Debt payments consist of the estimated required payments on outstanding mortgage, consumer debt, automobile lease payments, rental payments on tenant-occupied property, homeowners’ insurance, and property tax payments to the debt service ratio.
[11] http://www.nerdwallet.com/blog/credit-card-data/average-credit-card-debt-household/
[13] A temporary reduction in Social Security payroll taxes is due to expire at the end of the year Social Security is funded by a 12.4 percent tax on wages up to $110,100, rising to $113,700 in 2013. Half is paid by employers and the other half is paid by workers. For 2011 and 2012, Congress and Obama cut the share paid by workers from 6.2 percent to 4.2 percent. A worker making $50,000 saved $1,000 a year, or a little more than $19 a week. A worker making $100,000 saved $2,000 a year.
[14] http://www.cbo.gov/sites/default/files/cbofiles/attachments/March2012Baseline.pdf
[15] http://www.imf.org/external/pubs/ft/weo/2012/02/index.htm
[16] The fan chart shows the uncertainty around the WEO central forecast with various confidence intervals. The 70% confidence interval includes the 50% interval, and the 90% confidence interval includes the 50 and 70% intervals. The fan chart serves to addresses the following three questions:
- What is the baseline forecast for the current and future years?
- What level of uncertainty surrounds the forecast?
- Where does the balance of risks lie?
The baseline WEO projection is based on a suite of models, together with informed judgments made by IMF desk economists. In order to impose a greater degree of objectivity on the construction of the fan chart, the model in corporate information embedded in market indicators that have strong associations with the level of global economic activity. This information is subsequently aggregated and mapped into the degree of uncertainty and the balance of risks associated with global growth. The sources of information that were used to gauge the market’s assessment of risks range from survey-based measures, such as those provided by Consensus Economics, to market based measures, such as option prices for equities and commodities. Consensus Economics surveys more than 25 institutions each month for its forecasts regarding key macroeconomic indicators for a broad set of countries. The variance and skew of the distribution of forecasts serve as proxies for the degree of uncertainty as well as the balance of risk.
[18] http://www.guardian.co.uk/news/datablog/2012/oct/31/europe-unemployment-rate-by-country-eurozone?INTCMP=SRCH
[19] http://www.tradingeconomics.com/china/gdp-growth-annual