Summary
- In a “riskoff and risk on” world where fundamentals are less of a driver to portfolio performance,relying on portfolio construction basics is the answer – downside correlation matters.
- Asset allocation works over time but may not work from time to time. It is only a “free lunch” if a portfolio is properly diversified based on (non-static) correlation and risk factors and not merely by asset or sub-asset classes.
- Although seemingly painful, holding core bond constrained to the Barclays U.S. Aggregate Bond Index (the core bond benchmark) is essential for portfolio stability. It is the cheapest portfolio stabilizer/insurance to buffer risk off events.
- Not all active constrained core bond funds produce the same desired behavior as their benchmark during risk off events.
- Active core bond managers may have macroeconomic and other factor views that would position their portfolio to perform less well during a risk off event such as the January-February market sell off this year.
- When selecting a core bond manager as the portfolio’s safety anchor to offset equity risks, it is not only important to make sure the manger is constrained to the Barclays U.S. Aggregate Bond Index but also the expression of the manager’s view is not sufficiently deviated so that the safety anchor is compromised.
- One solution to ensure the desired benefits from core bond allocation during risk off events is to blend actively managed core bond investments with a passively managed Barclays U.S. Aggregate Bond Index investment.
- Seeking the “right” core bond allocation requires a balance between seeking longer term superior return through active management and risk off protection in the short term derived from passive index replication management
RORO Reigns
Behavioral finance has shown that investors tend to demonstrate herd-like behaviors. Since the Financial Crisis, investor emotions have contributed to a risk on, risk off (RORO) environment where asset correlation increases (i.e. the benefits derived from asset diversification diminishes). Losing over half of their equity value, investors were spooked and ushered in the binary world. The global unconventional monetary policies from zero interest rate (ZIRP) to negative interest rate (NIRP) and from quantitative easing (QE) to outright buying risk assets continue to distort markets and the financial system. With much of the developed economies riding the line between disinflation and deflation and the ever lowering global aggregate demand resetting commodity price equilibriums, lack of confidence remains constant. The ongoing financial deleveraging, policy reactions to prevent a repeat of the Financial Crisis, and the diminishing risk premia have all contributed to a smaller and less liquid cushion to absorb downside risks. Exogenous factors matter in a globally linked world. In response, markets go from elation to despair and back again.
The Federal Reserve’s unconventional monetary policies since 2008 used ZIRP to push short term rates down (Financial Repression) and used QE (I, II Twist and III) to buy longer term bonds to depress (through supply and demand) longer term interest rates to lower consumer, mortgage and business borrowing costs. These policy actions have pushed savers and investors to move up the risk continuum to seek higher income and return. Investors increasingly took on risks that have higher correlation with equities and away from core bonds. Anticipating that the ZIRP cannot last forever and to avoid a negative impact on fixed income (bond principal is inversely related to interest rates), investors move towards the shorter end of the yield curve (or reduced duration in bond portfolios). This combination inadvertently lowered the benefits of portfolio diversification by increasing asset class correlation. The benefit of core bond (longer term bond’s safe haven status) has systematically been replaced.
In portfolio construction for long term investors, diversification is often referred to as the only “free lunch”. By allocating assets to low or non-correlated assets (sometimes even a dose of negatively correlated assets) the portfolio could be “efficiently” calibrated to reach for the optimal average return based on a defined downside portfolio volatility. Core fixed income along with cash/cash equivalent and U.S. equity arethe 3 traditional asset classes and their combination offers portfolio balance. On a basic level, during a risk off period, investors sell stocks and other high risk assets and either park the proceeds in cash or risk free assets (short term treasuries) or buy investment quality and safe haven bonds (i.e. core bonds). This binary allocation is one of the most important benefits of core bonds. It is the least expensive form of portfolio insurance.
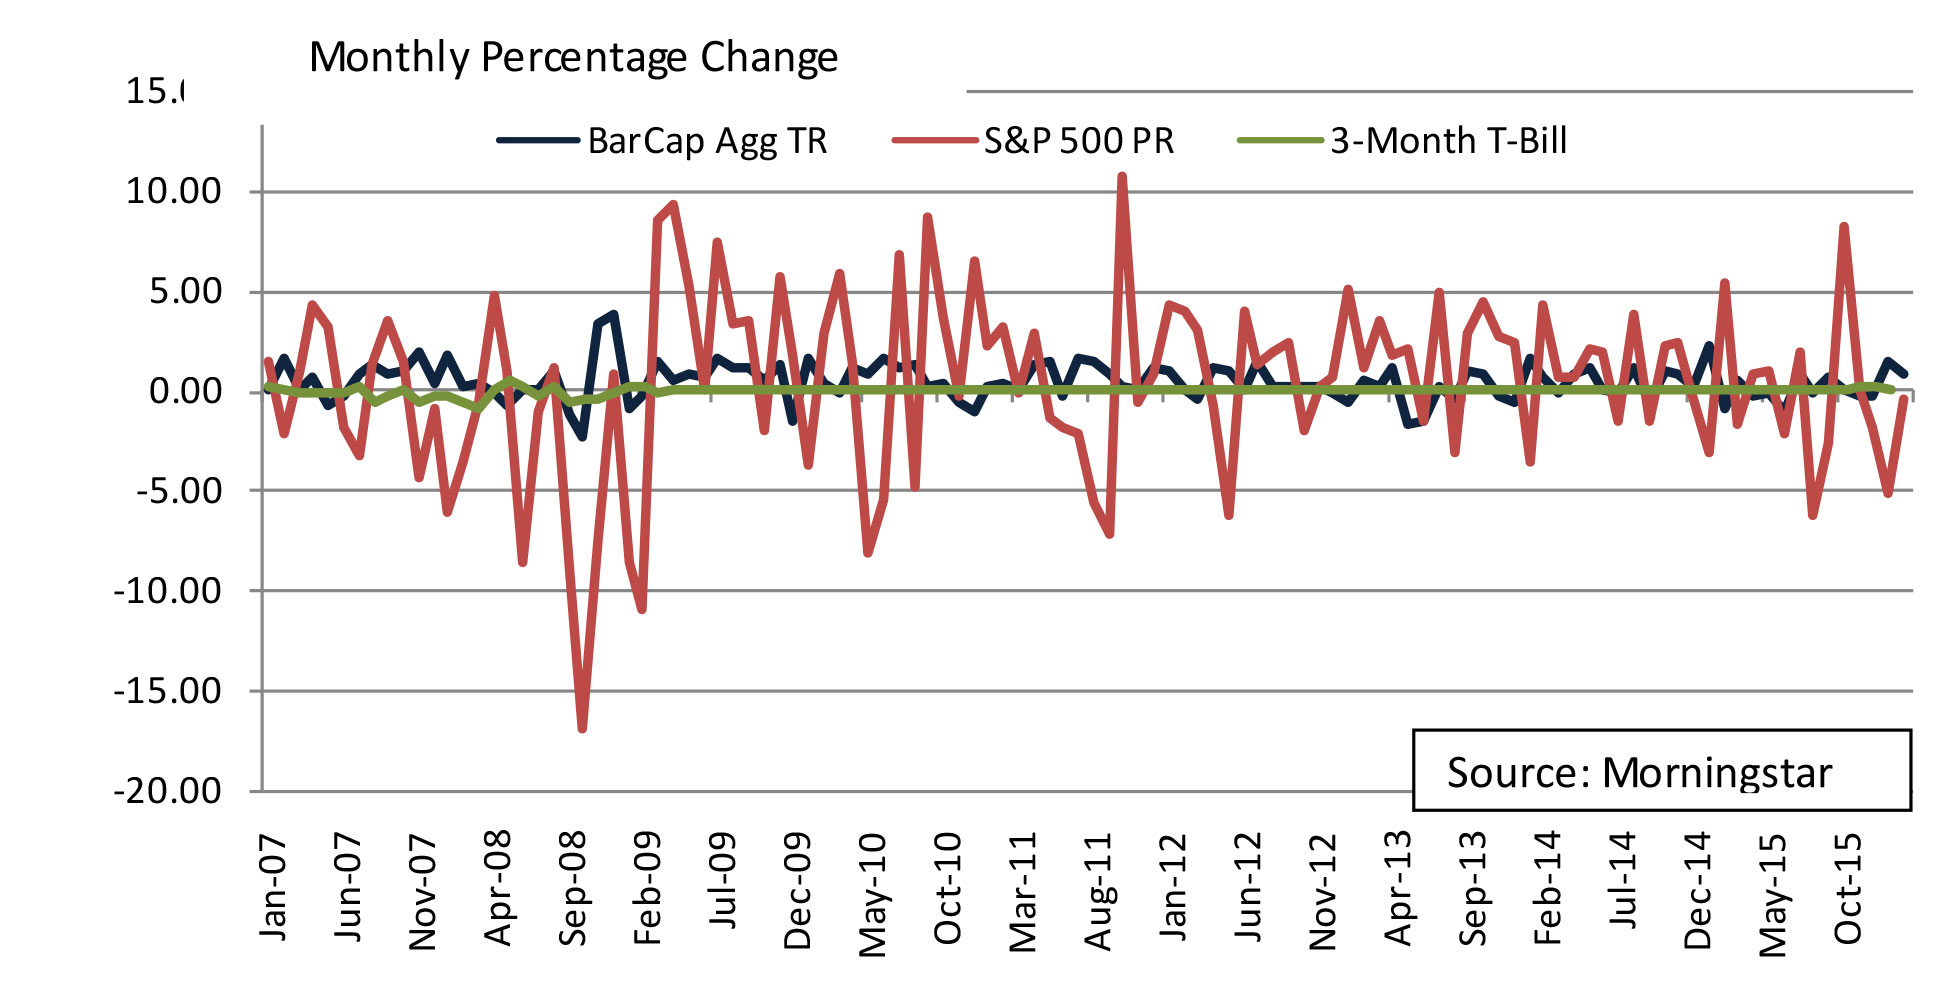
The following graph helps to illustrate the degree of volatility (monthly data) for the three traditional asset classes since January 2007 through February 2016. This juxtaposes the volatility of equity (the S&P 500 price movement in red) against the risk dampening characteristics of cash (monthly price change of the 3-month T-Ball on the secondary market in green) and investment grade (IG) fixed income assets (monthly price change of the Barclays U.S. Aggregate Bond Index total return in navy blue).
The widely accepted benchmark for core bonds is the Barclays U.S. Aggregate Bond Index1, an index made up of U.S. dollar-denominated investment grade bonds rated Baa3 by Moody’s/BBB- by S&P, /BBB- by Fitch or higher. Since the Financial Crisis, many observers have noticed the change in sector composition (increasing dominance in government securities), lengthening duration (disappearing maturity premium) and relative deterioration of quality. The counter intuitive challenge for this index is the need to maintain a pro rata ratio of an issuer’s debt level where the more debt issuance (deteriorating credit), the more representation in the index. A constrained core bond active manager attempts to add value (alpha) by deviating from the index within a risk factor framework. The following are three main considerations:
- Expressing and executing on top down financial, monetary, economic and interest rate views that affect curve positioning, duration and sector weightings,
- Using fundamental bottom up security selection, and
- Executing on relative values and liquidity (narrowing spread) through the use of derivatives (futures and CDS etc.).
I Thought I Had Core Bonds!
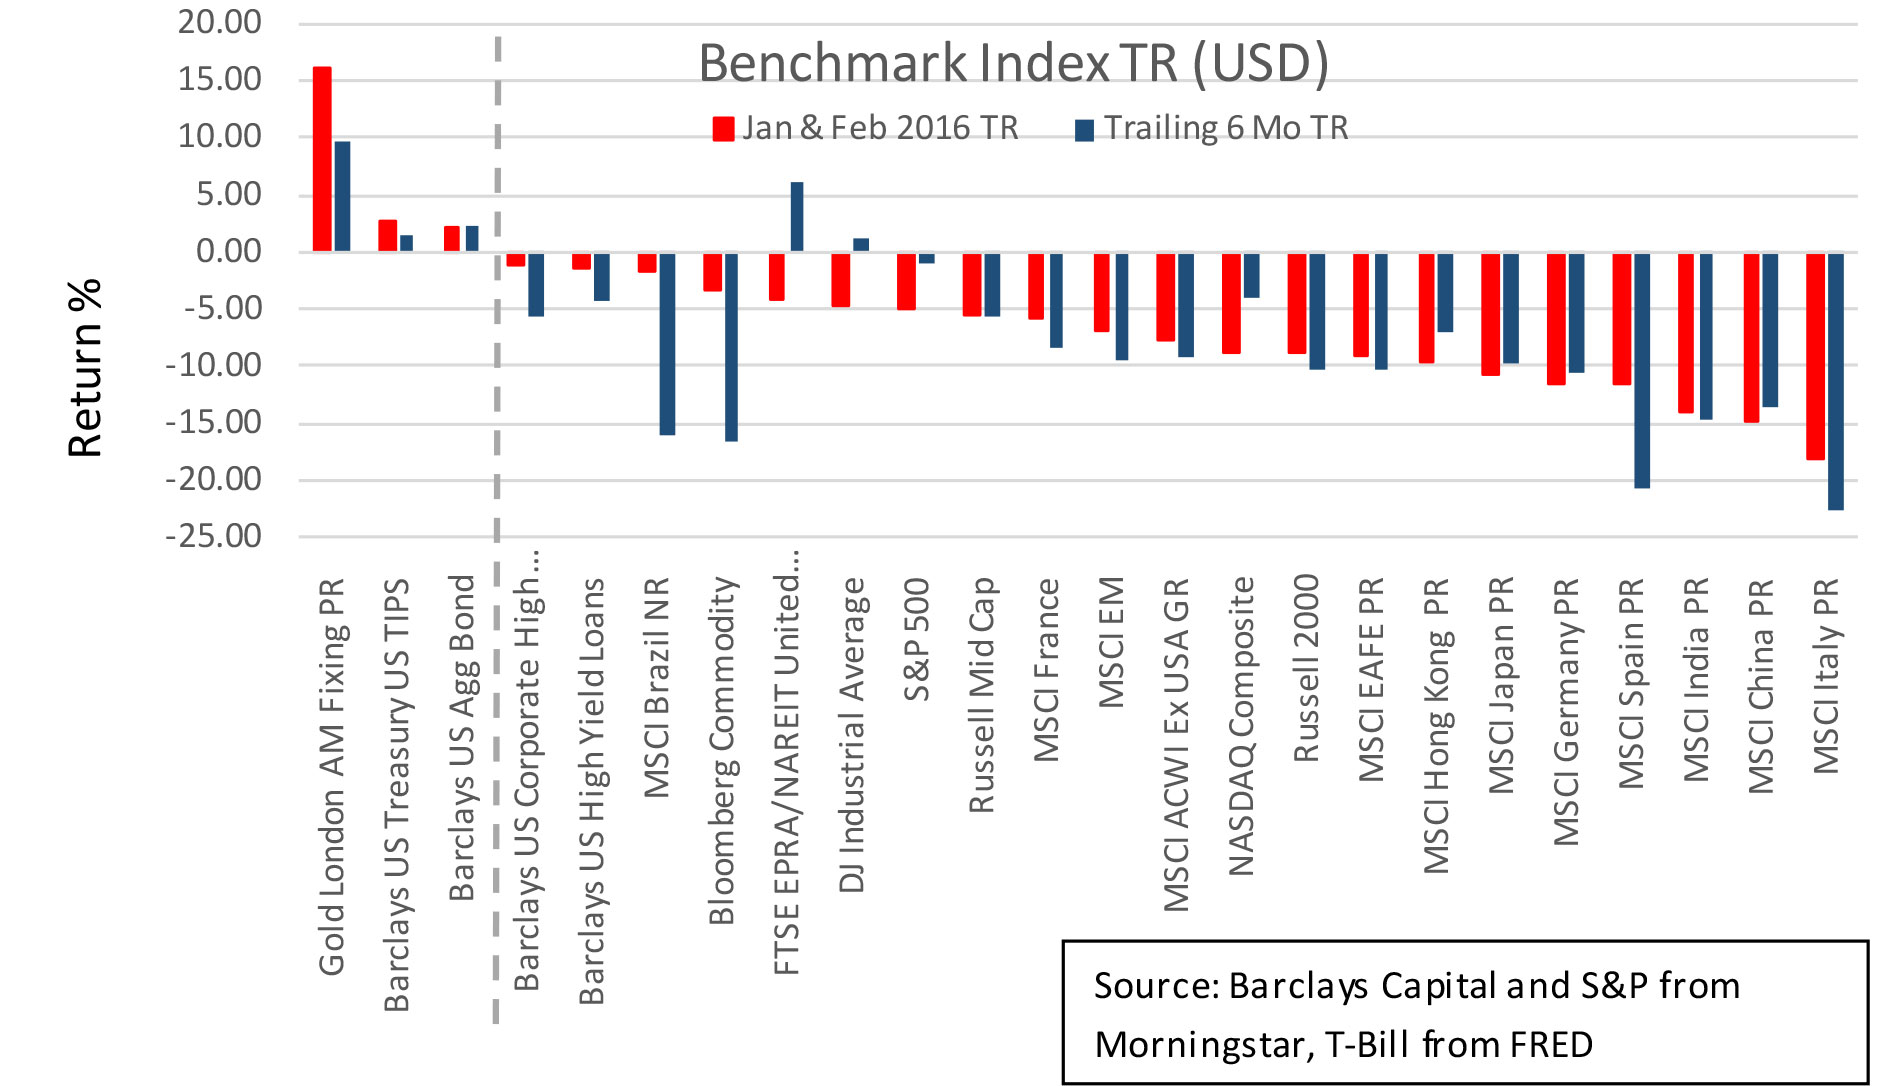
The global equity market sell off during January and February this year took everyone by surprise. We witnessed a classic risk-off event where all risk assets became positively correlated. Core bonds and safe haven assets gave a positive return (negatively correlated) as expected.
Once again, core bond came to the rescue of portfolios that adequately (based on the risk tolerance of the investor) allocated to this asset class along with perhaps cash/cash equivalents. Gold’s spectacular rise during this period was probably due to the investors’ response to Japan’s induction into the negative rate club.
However, if one examines the average portfolios with core bond allocation, you would find that the actively managed core bond fund did not provide the expected portfolio insurance.
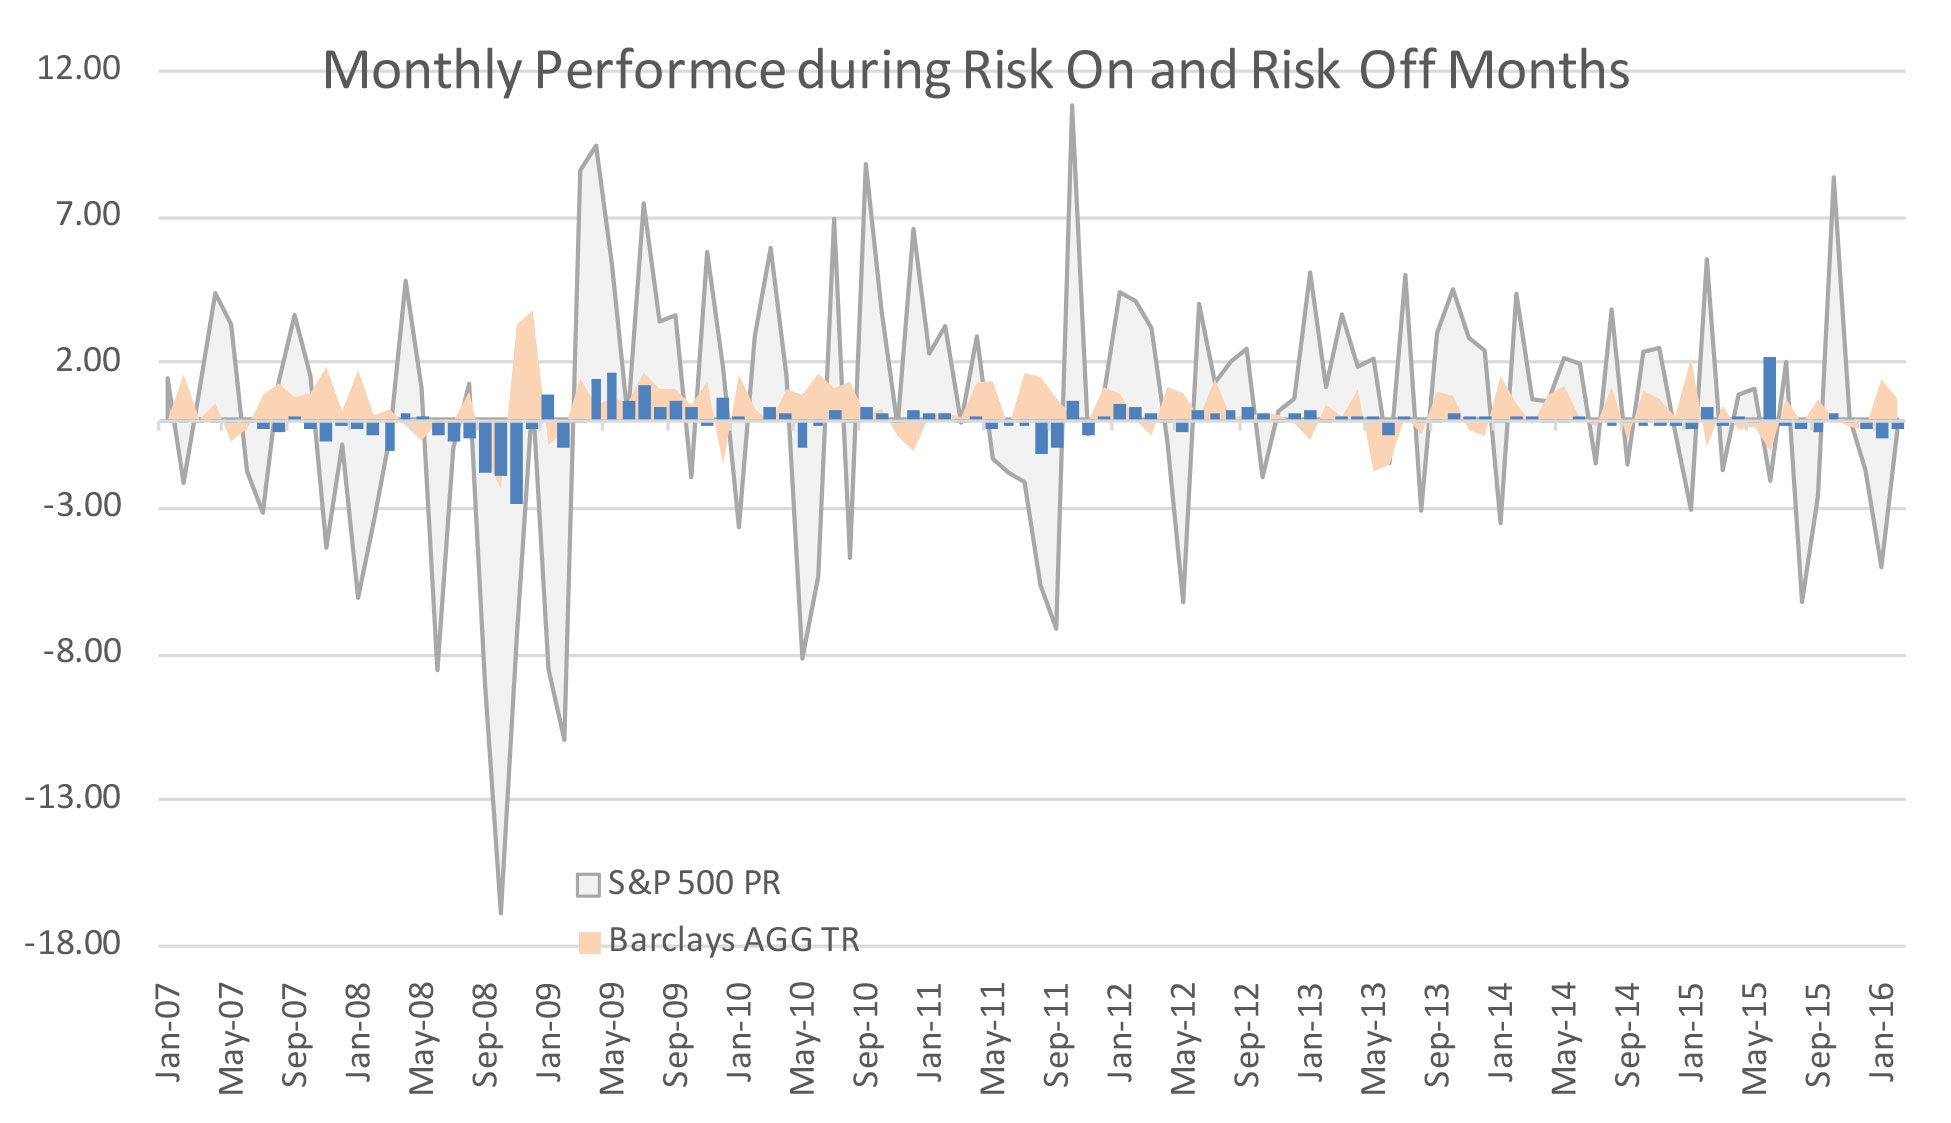
Using Morningstar data, we plotted the above chart showing the monthly returns of the S&P 500 TR Index (in grey) since January 2007. The monthly return of core bond, as represented by the Barclays U.S. Aggregate Bond Index TR (in light orange), behaved as expected most of the time. When there is a risk-off event in stocks, core bonds gave a positive return using benchmark index data. However, when observing the Morningstar Intermediate-Term Bond Category2 (a universe of investment grade bond open end mutual funds), which represents the average investment performance after fees, the performance during risk-off periods were more correlated. We subtracted the monthly returns of the Barclays index from the Morningstar Category returns (in blue bars) to illustrate the over- or under performance for the fund category during risk-on and risk-off periods. What we found is that the Morningstar Category under performed the Barclays benchmark index during risk off events. This means that, as a group, open end intermediate term investment grade bond mutual funds failed to function as a portfolio stabilizer (consistent with the Barclays benchmark index) when stocks turned negative. In fact, as of March 1, 216, according to Morningstar data, only 5 mutual funds (eliminating duplicating funds under different share classes) have outperformed the Barclays U.S. Aggregate Bond Index (1.72%) out of a total 74 actively and passively managed funds in the Morningstar Category. In fact, during the trailing 3 month period, only 3 funds were able to outperform. Bear in mind that it is not out performance investors should be seeking during risk-off periods. Investors should be looking for the negative correlation from core bonds to act as the solid foundation during stock market correction.
So What Is The Deal Here?
The two primary characteristics investors seek in core bond allocation are 1) to realize a predictable stream of income and 2) to serve as a risk dampener and to be negatively correlated during risk off events. We strongly believe in active management in the core bond space. Core bond is one of a few asset classes that are sufficiently inefficient that a manager can add value over time through bottom up security selection. Moreover, the correct global market views and the ability to execute on those top down convictions timely can further add value. After all, we are looking to core bond managers to outperform the Barclays benchmark index on a net of fee basis. As stated earlier, managers must deviate from the benchmark in order to outperform by definition. Since no one can consistently time a risk-off event or the breadth or depth of a sell off, actively managed core bonds can be caught making the right move or expressing the right convictions at the wrong time. Although within a full market cycle the manager may add value, in the short run or in sudden risk-off periods, actively managed core bonds could fail to live up to the core bond characteristics investors seek.
A ‘have your cake and eat it too” approach may be to blend a Barclays U.S. Aggregate Bond Index tracking investment with one or more actively managed core bond investment. This would provide a solid foundation during short term risk off events while reaching for alpha through active management in the long term. When selecting the active component, it is critical to understand the investment process and discipline of the active manager as well as the manager’s view and conviction on an ongoing basis. If the manager’s conviction is not aligned properly with the investor’s own view, the investor can be disappointed in the short term. Thus the calibration of the passive and the active component is an expression of an investor’s weighting of safety vis-à-vis return.
The late Casey Kasem closed each of his American Top 40 radio show with “Keep your feet on the ground and keep reaching for the stars.” I am not sure how good an investor he was, but his closing statement each week summarized prudent portfolio construction perfectly – reaching for better returns should be on the shoulders of a solid foundation.
This document is for informational purposes only and should not be deemed as offering investment or portfolio advice. Other factors and data not presented herein may be equally relevant and no investment decisions or actions should be taken based on any information and view expressed. Data providers are solely responsible for data accuracy.
- Source: Barclays. Created in 1986, the Barclays US Aggregate Bond Index is a broad-based flagship benchmark that measures the investment grade, US dollar-denominated, fixed-rate taxable bond market. The index includes Treasuries, government-related and corporate securities, MBS (agency fixed-rate and hybrid ARM pass-throughs), ABS and CMBS (agency and non-agency).
- Morningstar Intermediate-Term Bond Category portfolios invest primarily in corporate and other investment-grade U.S. fixed-income issues and typically have durations of 3.5 to 6.0 years. Category Group Index: Barclays US Agg Bond TR USD


