On April 27th, the Bureau of Economic Analysis (BEA) released its “advance estimate” for the 2018 Q1 real GDP[1] at 2.3%. The “second” estimate, based on more complete data, is expected on May 30, 2018. BEA affirmed the fourth quarter real GDP at 2.9%. As such, the real GDP was 2.3% for Y2017.
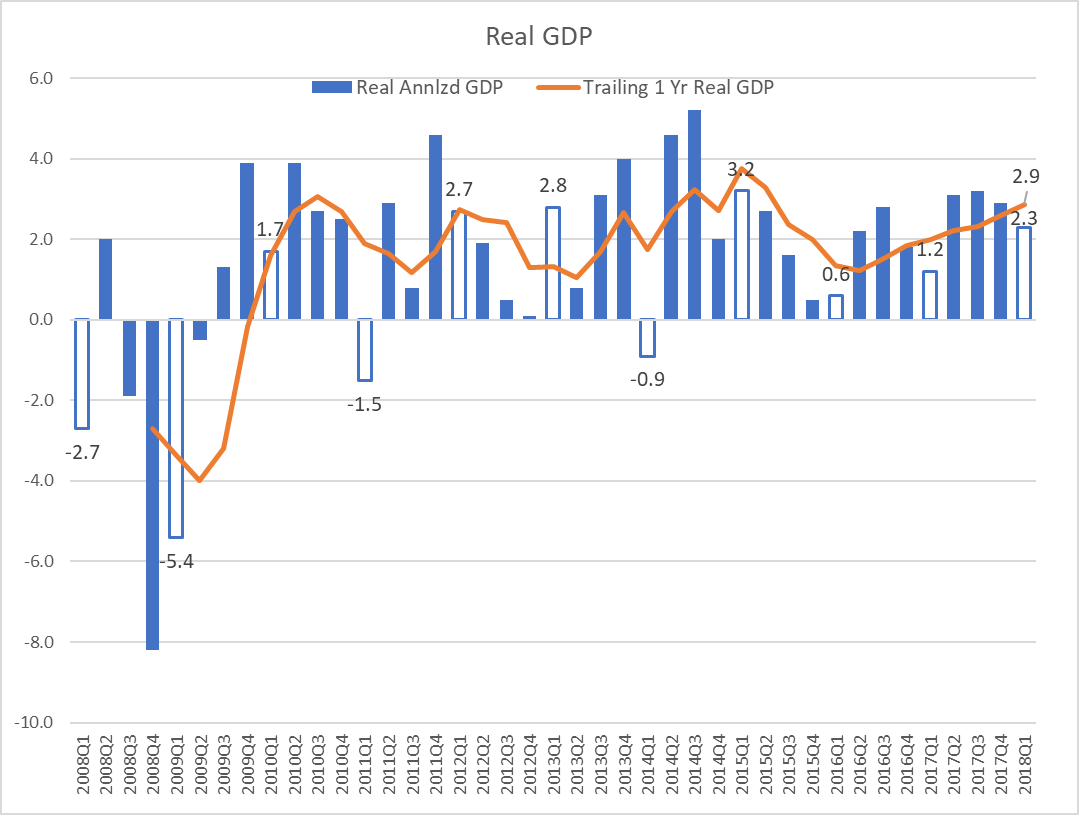 Current-dollar GDP increased 4.3%, or $211.2 billion, in the first quarter to a level of $19.97 trillion. In the fourth quarter, current-dollar GDP increased 5.3%, or $253.5 billion.
The down short in real GDP growth in the first quarter reflected slowing in Personal Consumption Expenditure, residential fixed investment, exports, and state and local government spending. Also, imports were up which subtracted from the GDP. These decelerating factors were partly offset by an increase in private inventory investment.
The following 6 charts show the directionality of the GDP and 5 of its sub-components to illustrate how consumers, companies, government and imports/exports added to or detracted from the U.S. economy since the first quarter in 2017.
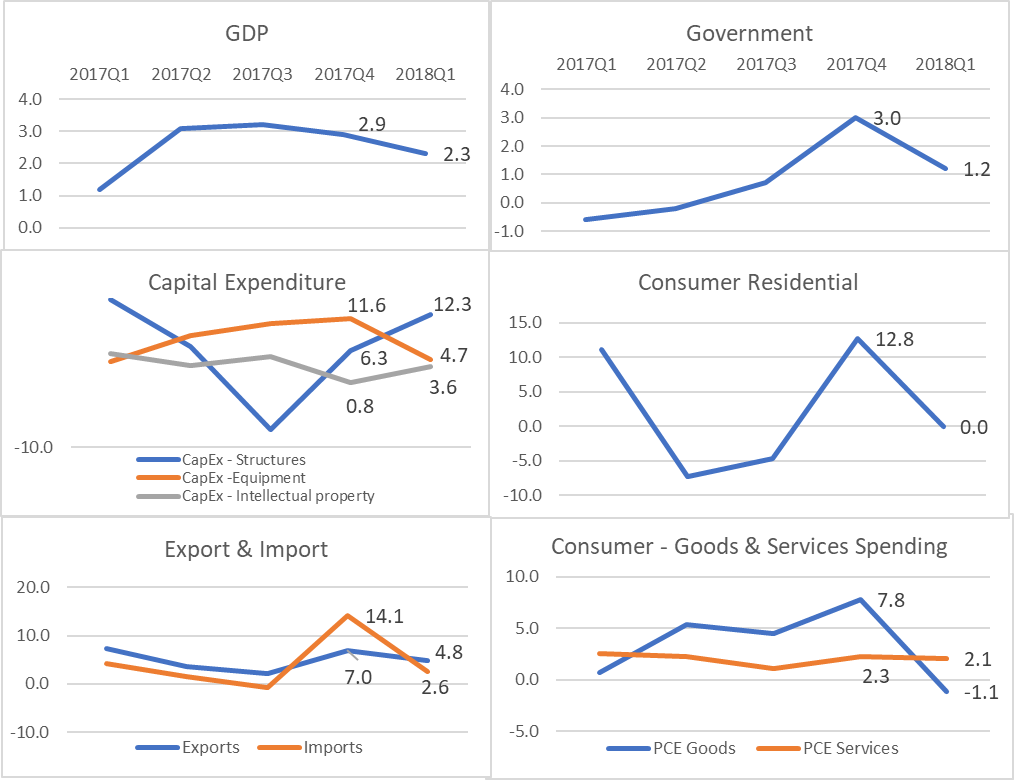
It is pretty clear that the 12.8% rise in residential spending by consumers and the 7.8% increase in goods spending topped overall spending (which represents 70% of the U.S. economy) by households. Both imports (detractor) and exports have come down as well As consumer spending slows, imports tend to slow as well. Both federal and state government spending also slowed. On the other hand, Business spending in structure[2] and intellectual capital is quite robust, even though the rate for equipment spending is slowing somewhat.
The April 27, 2018, Bureau of Economic Analysis release of Real Personal Consumption Expenditures (PCE) confirms the slowdown in consumer spending in Q1. The following are four graphs that capture the quarterly data since 2017 for PCE, Durable Goods (with sub components), Non-Durable Good (with sub components), and Services (with sub components).
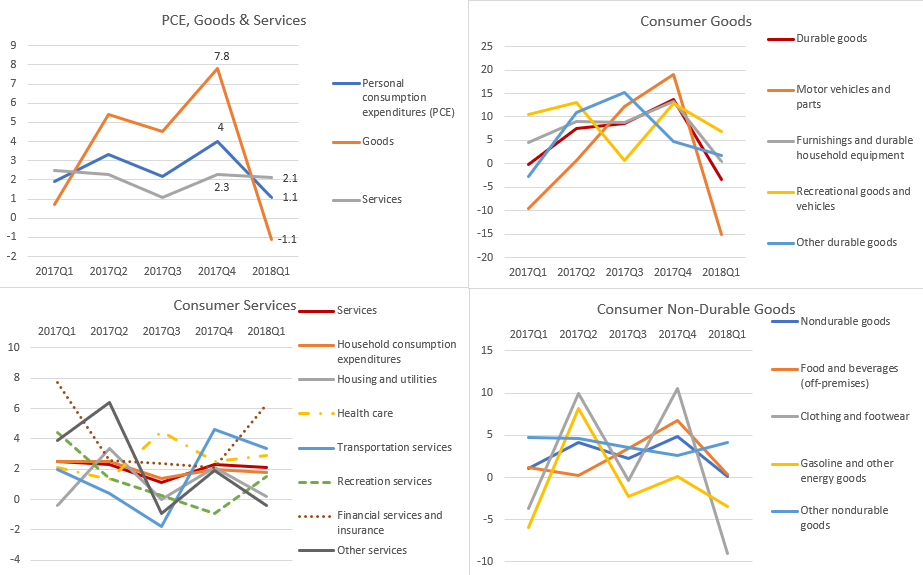
This shows that consumers have slowed down spending in durable goods (especially in the auto sector) and non-durable goods (especially in clothing and footwear). This probably reflects a natural slowdown from the typical excessive holiday season consumption. Spending on services, on the other hand, continues to be steady. However, the latest consumer spending data for March released by BEA shows a positive change from the preceding two months. In billions of chained (2009) dollars, seasonally adjusted annual rates are as follows:

After a drop in January and February, consumers came back in March for goods and services spending. This is a positive sign and hopefully reflects wage growth and tax savings.
According to a Bloomberg News[3] online article: “Among the 130 companies in the S&P 500 that have reported results in this earnings season, capital spending increased by 39 percent, the fastest rate in seven years, data compiled by UBS AG show. Meanwhile, returns to shareholders are growing at a much slower pace, with net buybacks rising 16 percent. Dividends saw an 11 percent boost.”
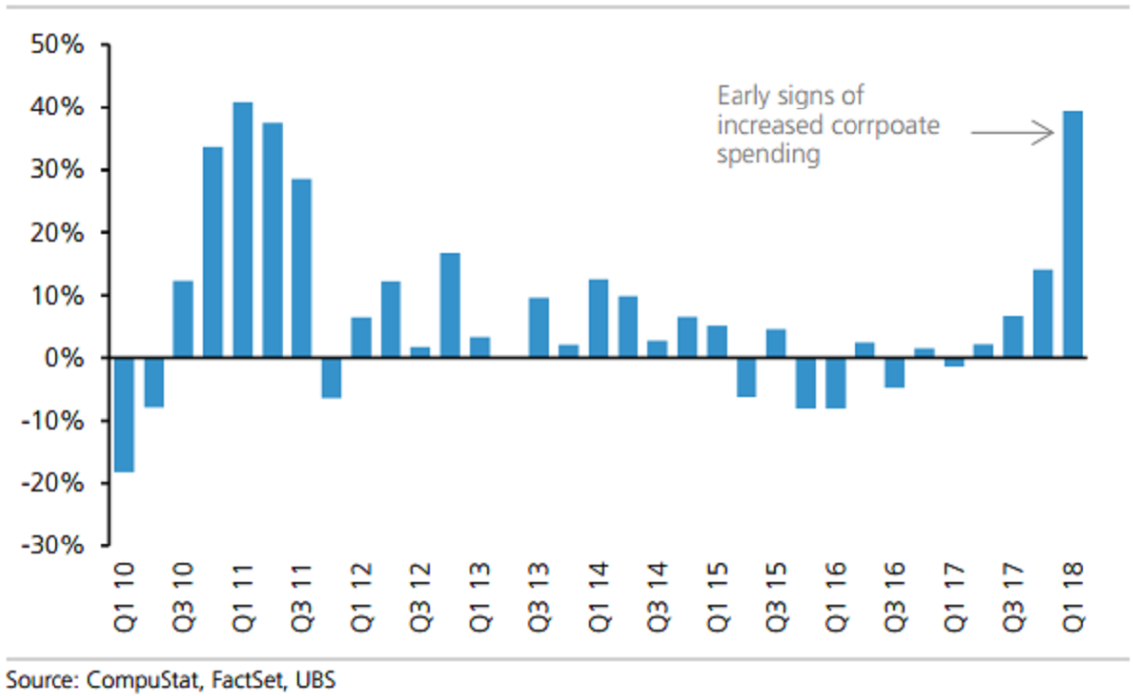 A strong and sustained capex spending by business would eventually increase labor productivity and wages. This would lead to the virtuous cycle of increased standard of living, economic expansion, full employment (NAIRU) and price stability.
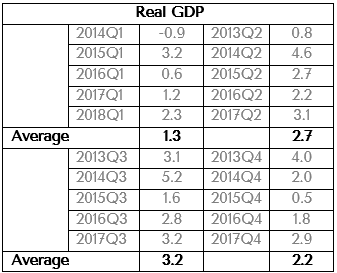
Q1 GDP Anomaly
Since 2014, the average real GDP has been disappointingly low at 1.3%. This has also been the case for the 4th quarter until last year. Second and third quarters are then to be the better performing or bounce back quarters. At 2.3%, 2018 Q1 growth rate is better than 2017 and 2016. The reality is that a single data point is probably not a good way to project for the rest of 2018 even though we are positive about the U.S. economy, especially when corporate America is buoyant by tax reform and consumers are doing well.
Finally, the inflation gauge that the FOMC uses to track inflation, the core Personal Consumption Expenditure (PCE), is now inches away from the 2% objective. The March report shows that core CE is now at 1.9%.
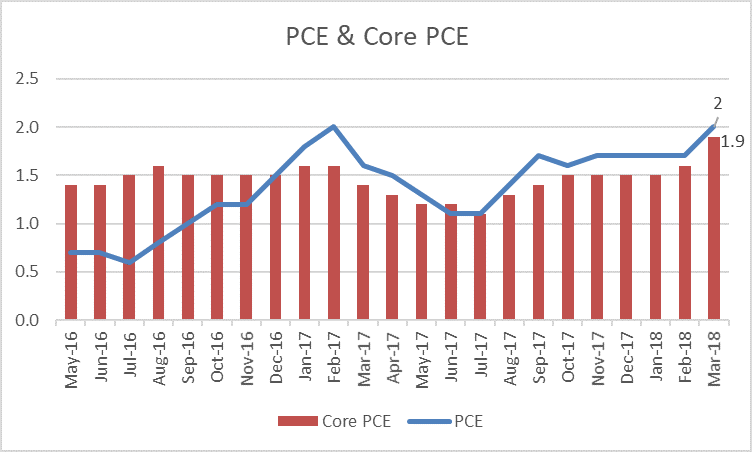
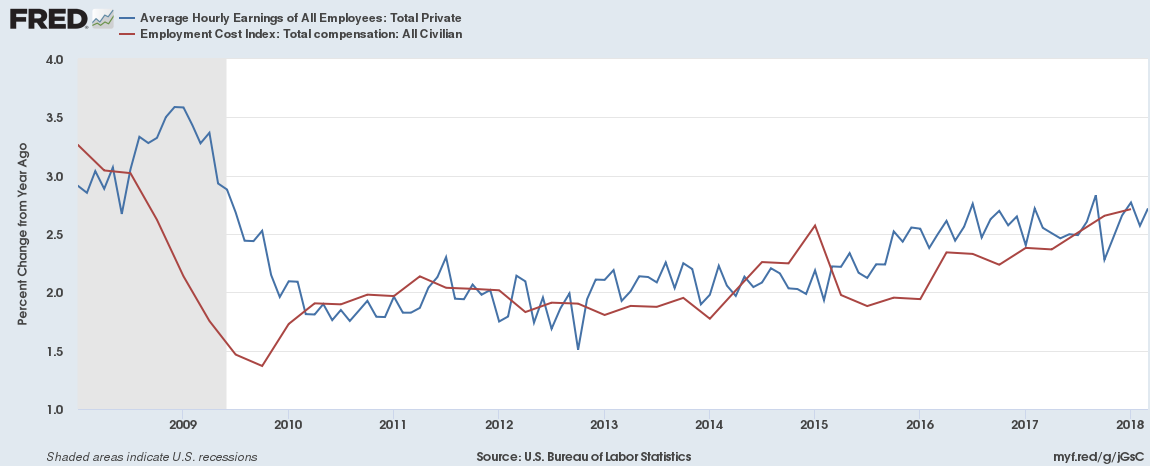
FOMC’s long stated objective for core inflation is 2% which has not been witnessed since briefly in early 2012. This, combined with the gradual rise in wages, is perhaps giving the FOMC more confidence about increasing the pace of rate normalization.
 For 2018, we expect the U.S. economy to continue its expansion without a recession in sight. If history can serve as a guide and the capex spending keeps up along with positive consumer spending, we expect real GDP for the year to finish at or around 3%. The uncertainty remains policy, politics and trade.
[1][1]https://www.bea.gov/newsreleases/national/gdp/2017/pdf/gdp3q17_adv.pdf
[2]consists of new construction—including own-account construction improvements to existing structures; expenditures on new mobile structures; expenditures on mining exploration, shafts, and wells; and net purchases of used structures by private businesses and by nonprofit institutions from government agencies. It includes equipment that is considered to be an integral part of the structure (such as plumbing, heating, and electrical systems).
[3]https://www.bloomberg.com/news/articles/2018-04-26/trump-tax-windfall-going-to-capex-way-faster-than-stock-buybacks