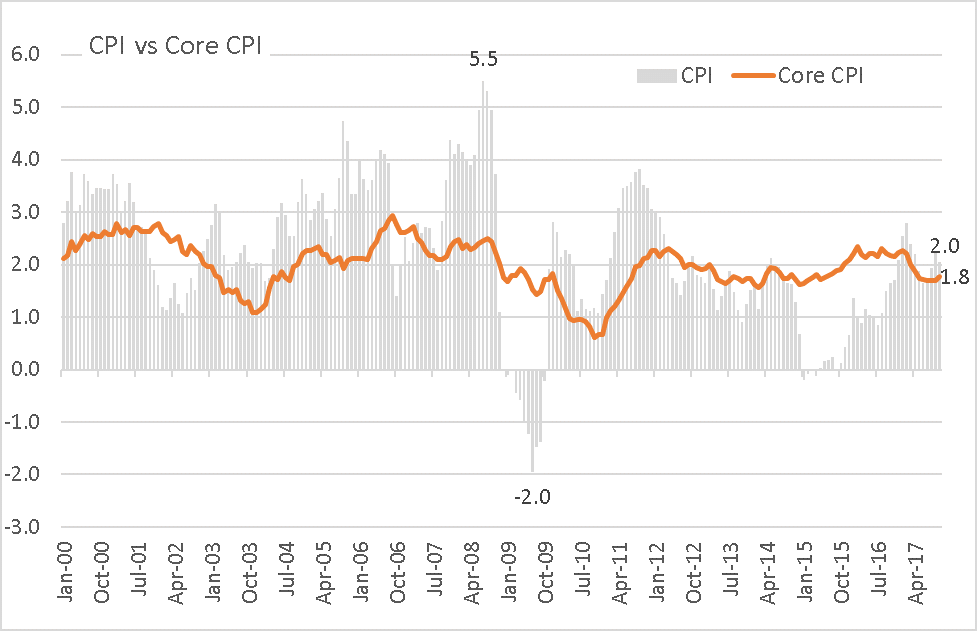
On November 15, 2017, the Bureau of Economic Analysis (BEA) released its Consumer Price Index showing the Consumer Price Index for All Urban Consumers (CPI-U) rose 0.1% in October on a seasonally adjusted basis. Over the last 12 months, the all items index rose 2.0%, while the index for all items less food and energy (Core CPI) increased 0.2%. On a trailing 1-year basis, the Core CPI rose 1.8%.
The graph below offers a better insight into how the major components of the CPI have performed during the trailing 3-monthly periods as well as the trailing 1-year period. 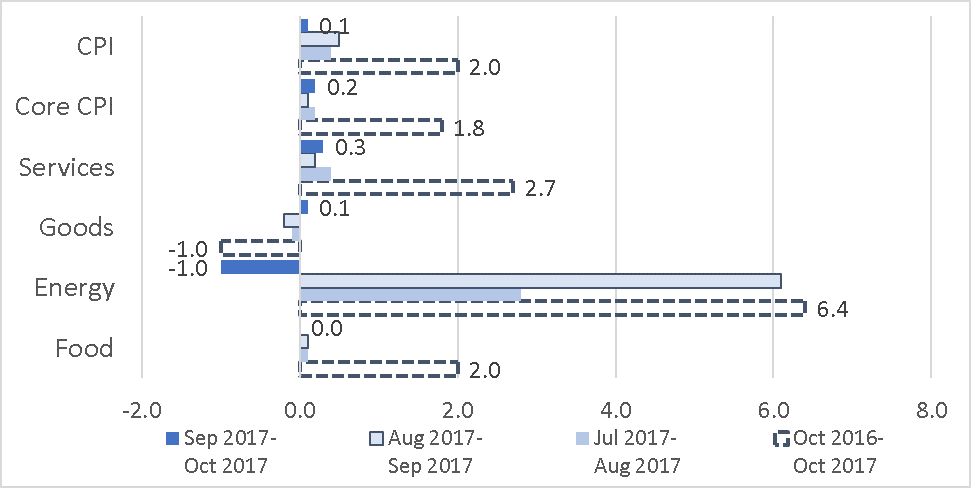
The service component of the CPI has been positive for the 3 monthly periods and over the 1-year period rose 2.7%. The goods component has been negative in August and September but turned positive in October. However, over the trailing 1-year period it was negative 1%. Core CPI has been steadily rising and is moving towards the 2% Fed target.
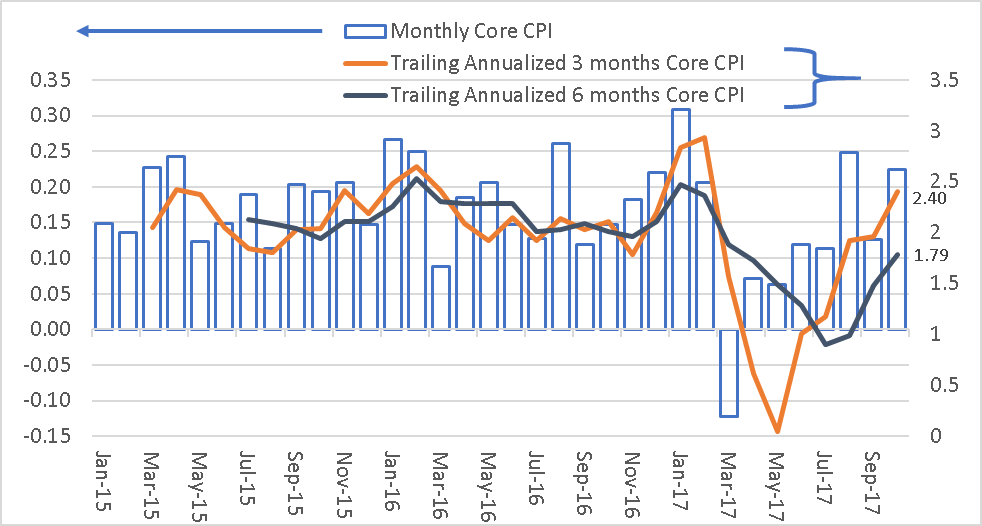
By annualizing the trailing 3-month and trailing 6-month Core CPI data, inflation trend is shown gradually rising.
Inflation is a function of two forces: the inflation expectations of the public and the amount of slack in the economy. Inflation expectations are an important consideration in wage and price decisions, and slack influences the pricing power of firms and workers. The May 19, 2010, issue of the Federal Reserve Bank of Atlanta Economic Commentary- “Are Some Prices in the CPI More Forward Looking than Others? We Think So” – Michael F. Bryan and Brent Meyer summarized their research on the sub-components of the CPI. They found that the flexible-price CPI data series tends to bounce violently from month to month, presumably as it responds to changing market conditions, including the degree of economic slack. On the other hand, sticky price CPI data series are slow to adjust to economic conditions. Importantly, the sticky-price measure seems to contain a component of inflation expectations, and that component may be useful when trying to discern where inflation is heading.
According to the Commentary, some prices are “sticky,” which means that they may not respond to changing market conditions as quickly as other, more “flexible-price” goods. And because sticky prices are slow to change, it seems reasonable to assume that, when these prices are set, they incorporate expectations about future inflation to a greater degree. In contrast, the flexible-price measure is much more responsive to changes in the economic environment (such as slack).
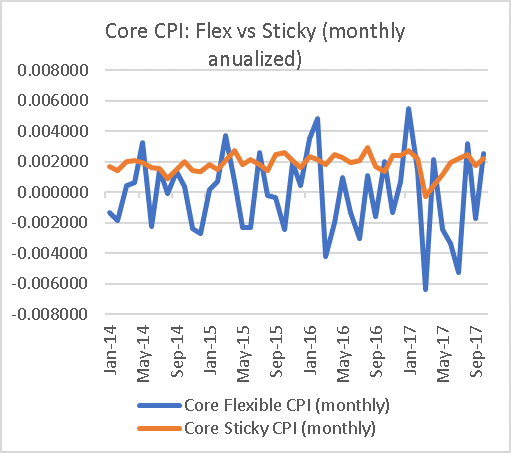
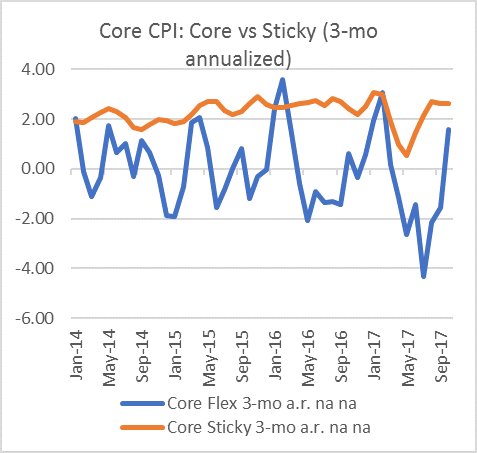
Based on the data provided by the Atlanta Federal Reserve Bank, the two graphs show the 1-month and 3-month annualized Core Flex CPI vs. Sticky CPI. It shows that the more stable core (or forward looking) CPI is trending above 2% while the more noisy Core Sticky CPI is trending upward after a significant drop in the first half of 2017.
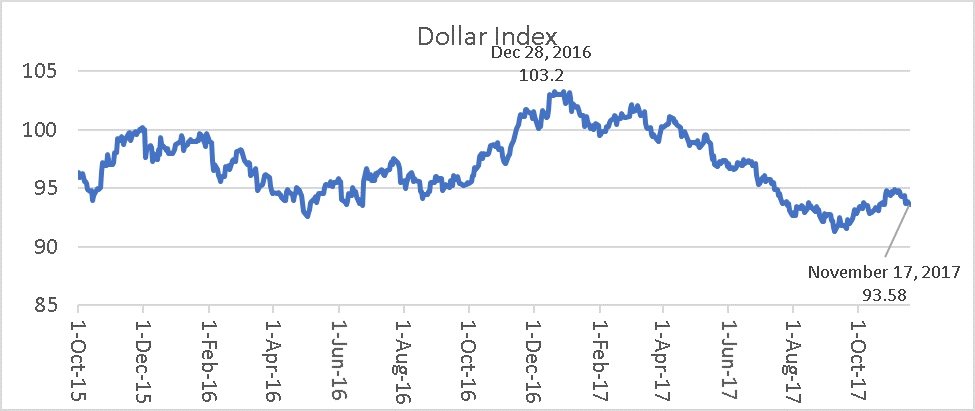
Since the end of 2016, the U.S. Dollar Index has depreciated by over 9% which contributes to firming and ultimately rising import prices for goods. This is supportive of the inflation rate in the medium term.
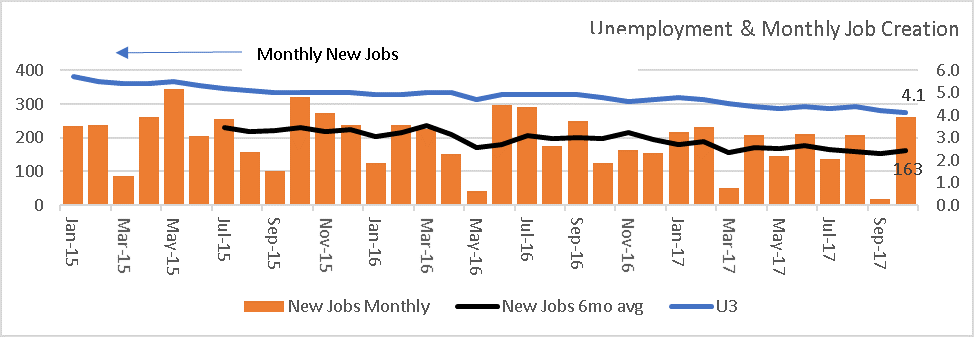
Employment and jobs are central to the health of the economy and inflation.
In summary, the October CPI data suggests that the service sector of the CPI continues to be above the 2% inflation rate while the goods producing sector has turned positive after two months of negative values. Based on the trailing 3-month and 6-month core CPI annualized data as well as the 3-month Flex CPI annualized data, the trend is positive and rising.
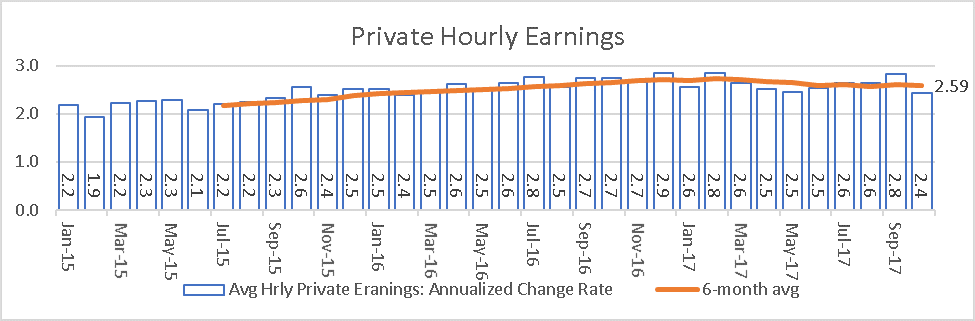
With the combination of a lower dollar and the ever lowering U3 unemployment rate (now at 4.1%) with an average 6-month new job creation of 163,000, it is a matter of time before wages will edge upward. These factors should continue to be supportive of a higher inflation rate from a product push and consumer pull standpoint. We should be at the Federal Reserve target of 2% by the end of next year for core inflation.