Economists spend a lot of time thinking about the U.S. unemployment rate, the slack in the labor market and the persistently low productivity. For the Federal Reserve, one of the dual mandates is to “maximize employment.” The FOMC has raised rates four times since December 2015 and each time has relied on the strength of the labor market (certainly not inflation) as a justifying indicator. We want to see how even unemployment is across the country and across workers of all education levels.
Each month, the DOL’s Bureau of Labor Statistics (BLS) publishes the State Employment and Unemployment report. In the June 2017 report[1], the overall picture was rather upbeat, as expected. With the national unemployment rate at 4.4% in June, the focus has turned increasingly to wage inflation and reaching NAIRU (non-accelerating inflation rate of unemployment – a theoretical unemployment rate, below which inflation rises) and decreasingly about labor slack.
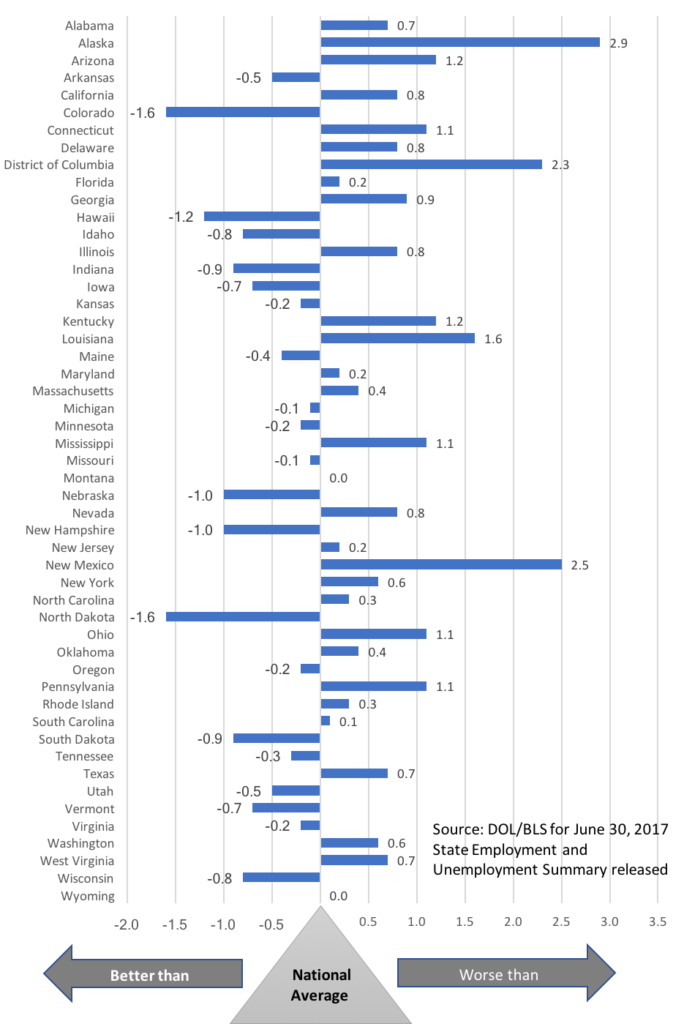
We took the individual state unemployment rate and subtracted the national unemployment (U3) rate of 4.4% to see which states are doing better or worse than the national average. We found 21 states have a lower unemployment rate while 27 states and the District of Columbia have higher rates with two states (Montana and Wyoming) exactly at the 4.4% national average. The states with 1% or more below the national average are Colorado, Hawaii, Nebraska, New Hampshire, and North Dakota; those with 2% or more above the national average are Alaska, District of Columbia and New Mexico.
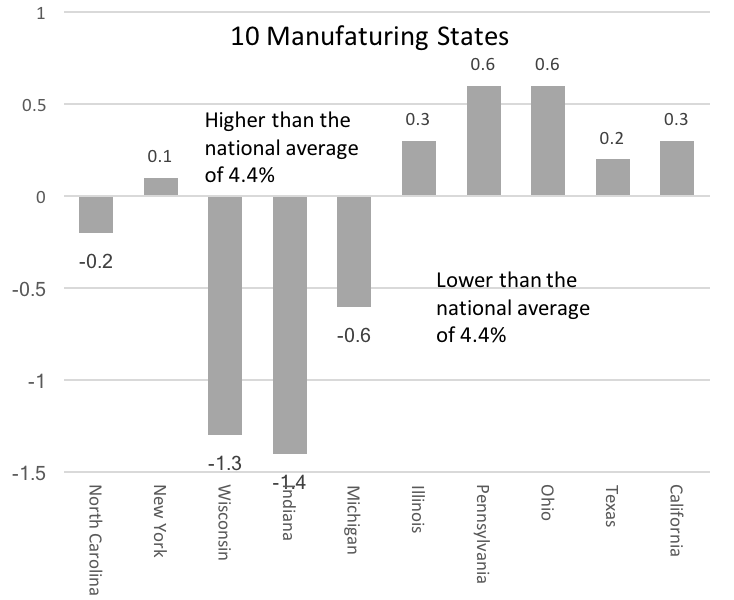
With years of hollowing out our manufacturing base, we also wanted to see what the unemployment rates are for the 10 largest manufacturing states. Six states out of ten have higher unemployment rates than the national average: New York, Illinois, Pennsylvania, Ohio, Texas and California. If we remove the ten largest manufacturing states from the national average, the U3 rate would be lowered from 4.4% to 4.2%.
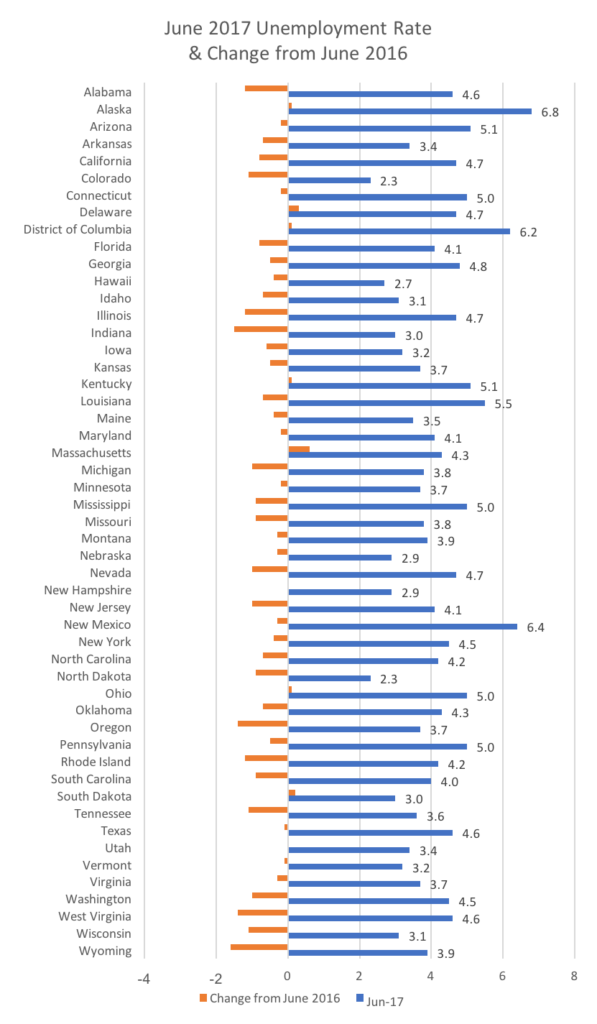
We further compared the change in unemployment rate per state from June 2016 to June 2017. Although a predominant number of states have improved, six states saw their unemployment rates rise a year later: Alaska, Delaware, Kentucky, Massachusetts, Ohio, and South Dakota plus the District of Columbia.
The data suggests that there is still slack in the economy and the labor market recovery has not been uniform. It is reasonable to suggest that, on average, the U3 rate may be at NAIRU, but this is certainly not the case in every state. As the general economy continues to expand, even at the 2% range, we will observe pockets of wage inflation, but we are not likely in the near term to witness an across-the-board national reflation of wages among workers at every skill level.
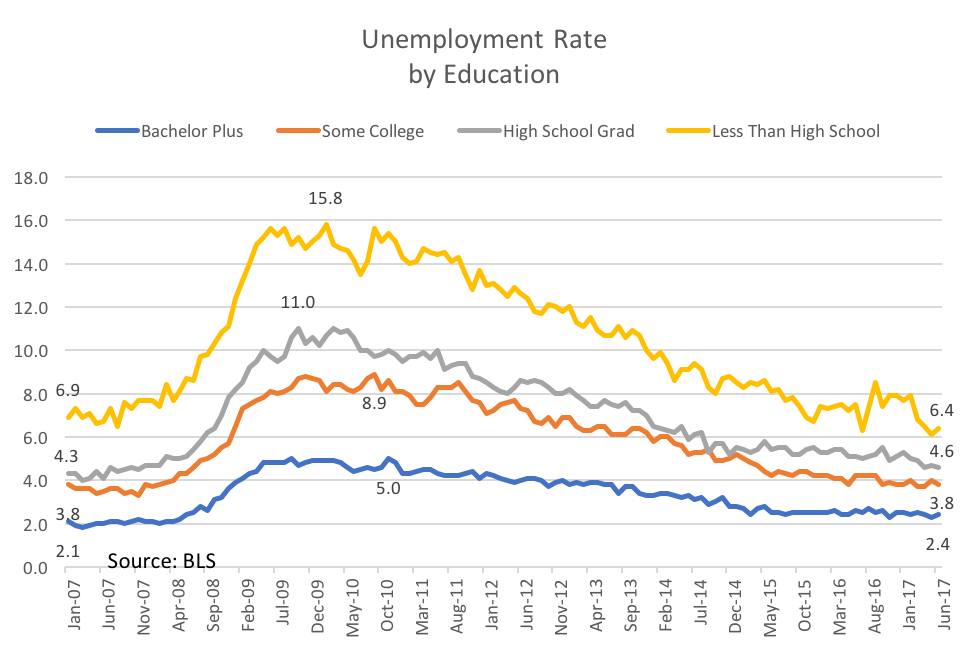
Let’s now take a look at unemployment and participation rates (number of people who are either employed or are actively looking for work) by education level (data from BLS[2]). From an unemployment rate standpoint, workers with every education level have achieved the unemployment level achieved prior to the Great Recession. From this angle, it appears we have fully recovered. This of course assumes that the pre-crisis level is the correct benchmark.
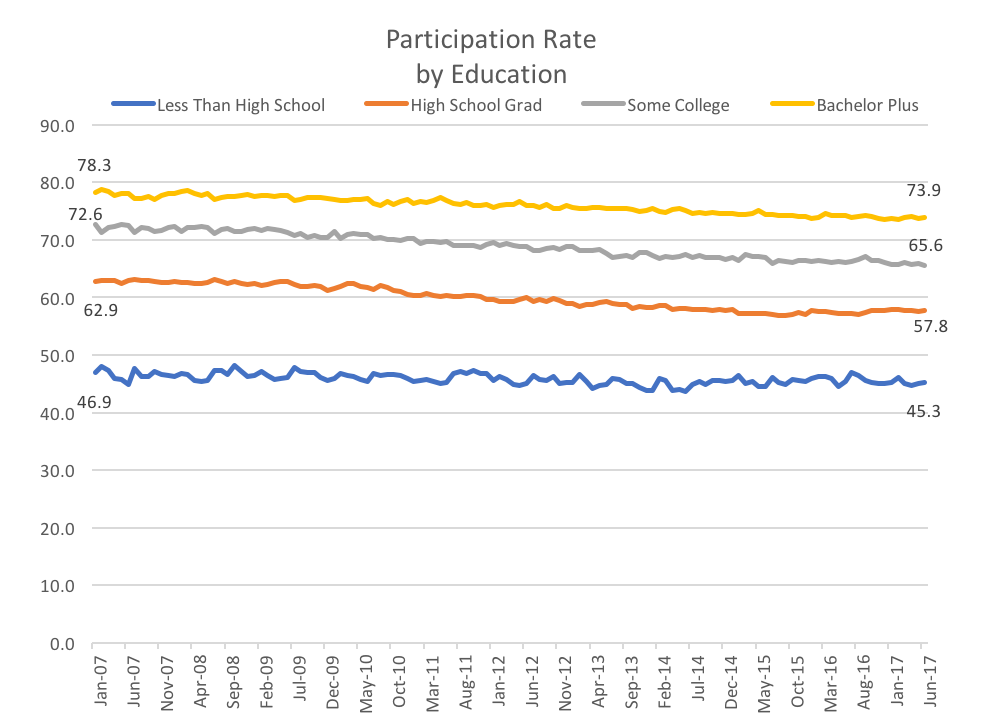
However, if we also review the participation level of workers with different education levels, the story is different.
Almost ten years after the Financial Crisis, the working population age 25 and older has not seen their participation rate back to the pre-Crisis level. The group with the least education has returned closet to the Y2007 participation level. The most educated is at a 4% reduction in participation rate. The low or decreasing unemployment rate among workers of all education levels does not fully show the lowered participation rate across the entire working age population. This also shows that the lower national participation rate is not simply due to baby Boomers retiring or leaving the workforce.
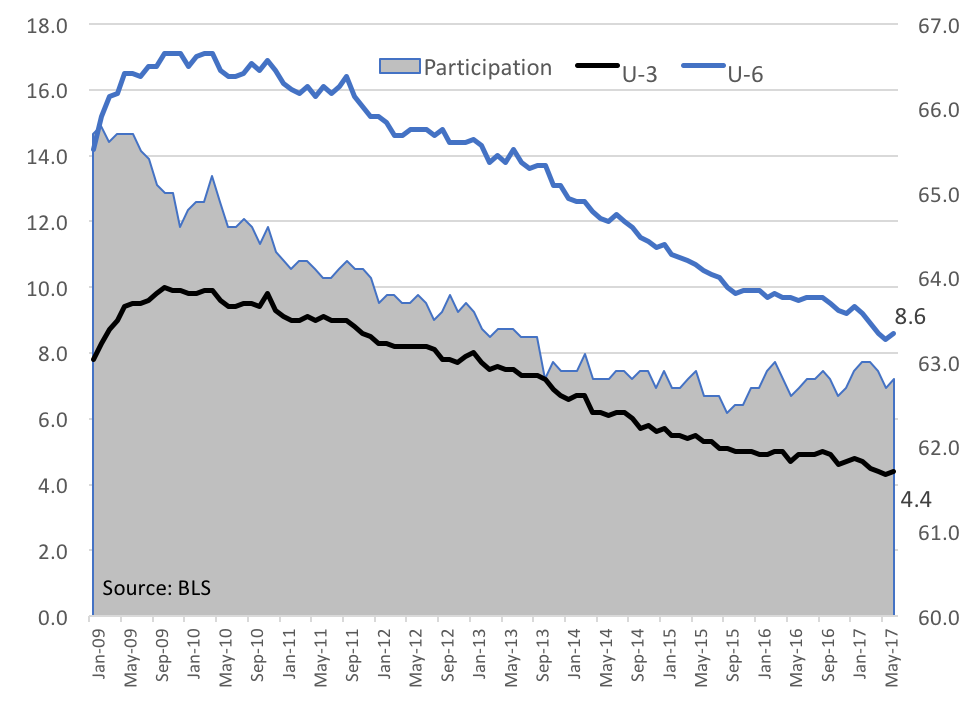
We maintain that there remains slack in the labor economy. The following graph shows, on the national level, the U3, U6 and the participation rate as of June 30th.
We need to see an increasing participation rate and lower U3 and U6 rates before NAIRU is reached during this economic cycle. This suggests that the FOMC’s policy base case is to maintain its measured pace for rate normalization.
