
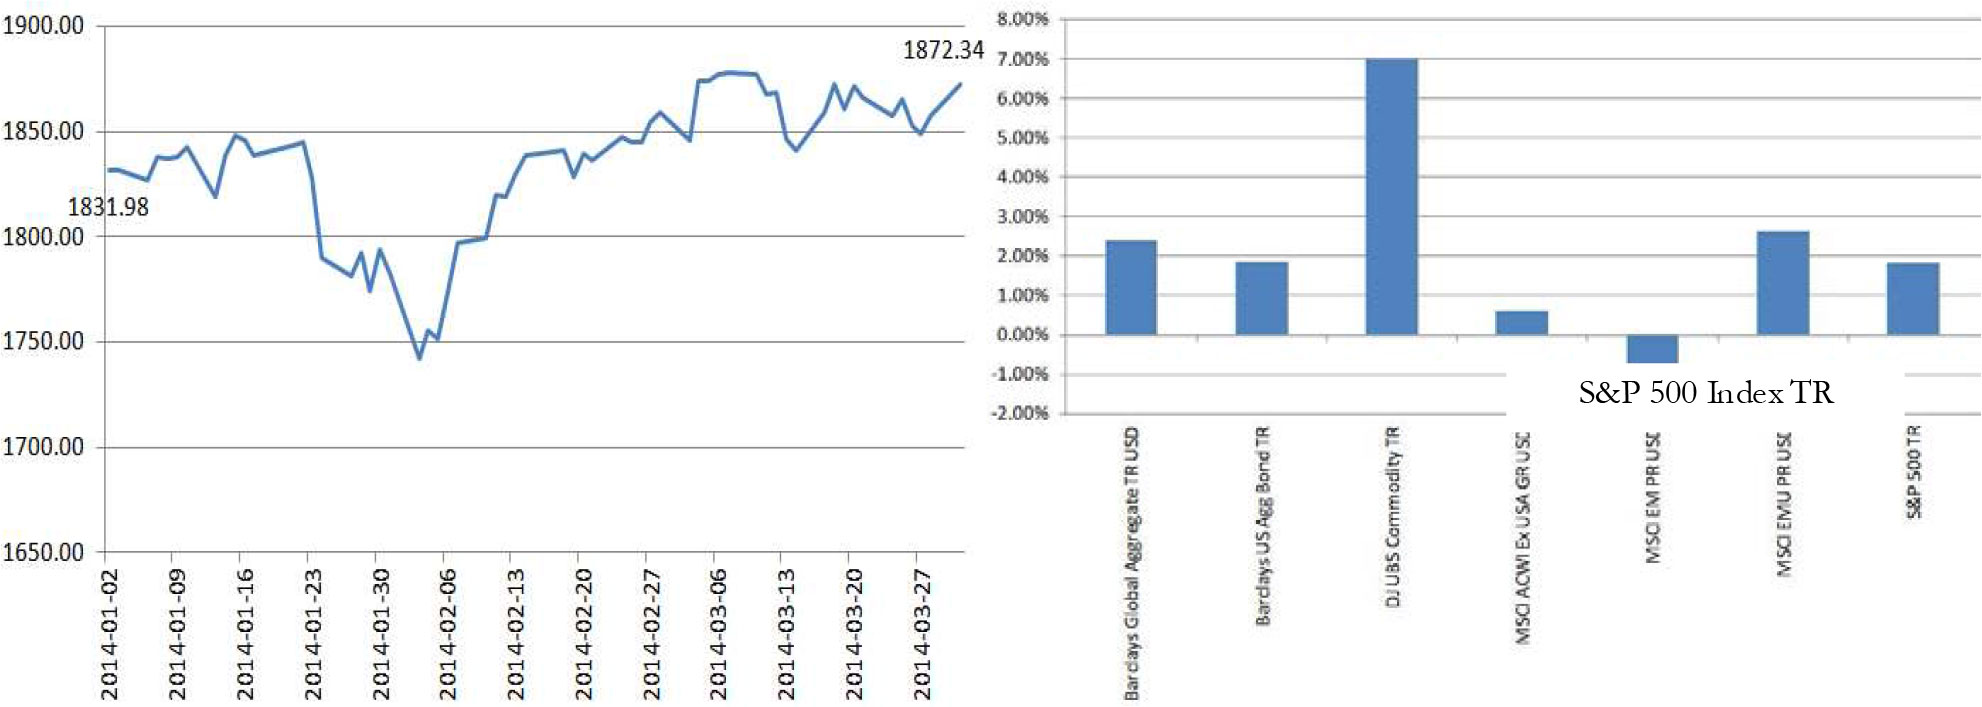
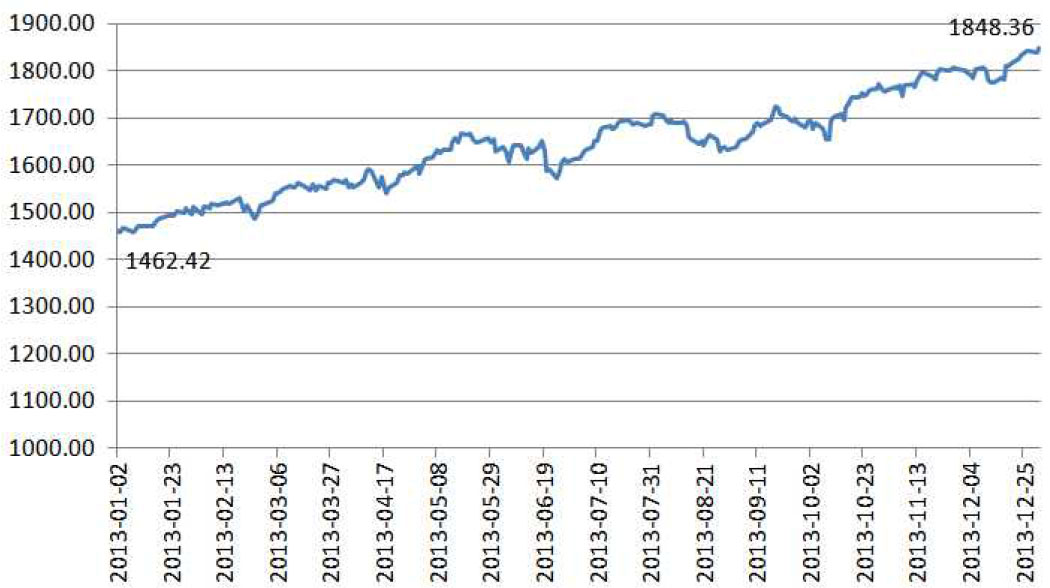
The euphoria of the 2013 US market failed to carry over into the first quarter this year. After a huge 32% gain in the S&P 500 Index (which was last witnessed in 1997) and a negative 2.02% return for the Barclays Capital Aggregate Bond Index, the performance of various assets have retreated from these extremes during the first quarter.
Much of last year’s exceptional stock market performance in the US was due to earnings’ multiple expansion and continuing profitability. The seemingly unstoppable march upward last year was accomplished with a low level of market volatility.
The support for the enthusiasm is the slow but gradual improvement of the US economy and labor market on the back of the extraordinarily supportive monetary policy. The five years (and counting) of zero interest rates continues the financial repression drive for investors to reach for yield and return at increasing risks. The hope is for the unprecedented policies of the Federal Reserve to continue until such time as the handoff to the private sector is assured and sustainable. It is well recognized that economic recovery is much more challenged when a recession and economic dislocation result from a financial crisis. The Federal Reserve monitors many factors in making its policy decisions, and factors discussed in the FOMC meetings and member speeches offer investors a snapshot of what the Federal Reserve considers to be important drivers of the economy and the timing of their policy decisions.
Chairman Yellen, how is your crystal ball?
The last FOMC meeting was held on March 18th and 19th. The March 19th Press Release (http://www.federalreserve.gov/monetarypolicy/fomccalendars.htm) stated that the recent weather-related slowdown in the economy did not affect their view of an improved outlook about the economy and labor. As such, tapering of Quantitative Easing continues. Beginning in April, the pace for buying agency mortgage-backed securities will be reduced by $5 billion to $25 billion per month and the pace of buying longer-term Treasury securities will also be reduced by $5 billion to $30 billion per month. The Committee further affirmed that the principal payments from its holdings of agency debt and agency mortgage-backed securities in agency mortgage-backed securities will be reinvested and it will roll over maturing Treasury securities at auction. Moreover, there is no change to the current Fed Funds rate.
On April 16th, Chairman Janet Yellen gave a speech at the Economic Club of New York which provided an updated summary of the factors the Federal Reserve uses in determining the health of the economy and the triggers for future policy decisions in meeting the mandate of maximum employment in the context of price stability. Chairman Yellen posed three questions facing FOMC:
- Is there still significant slack in the labor market?
- Is inflation moving back towards 2 percent?
- What factors may push the recovery off track?
Gross Domestic Product
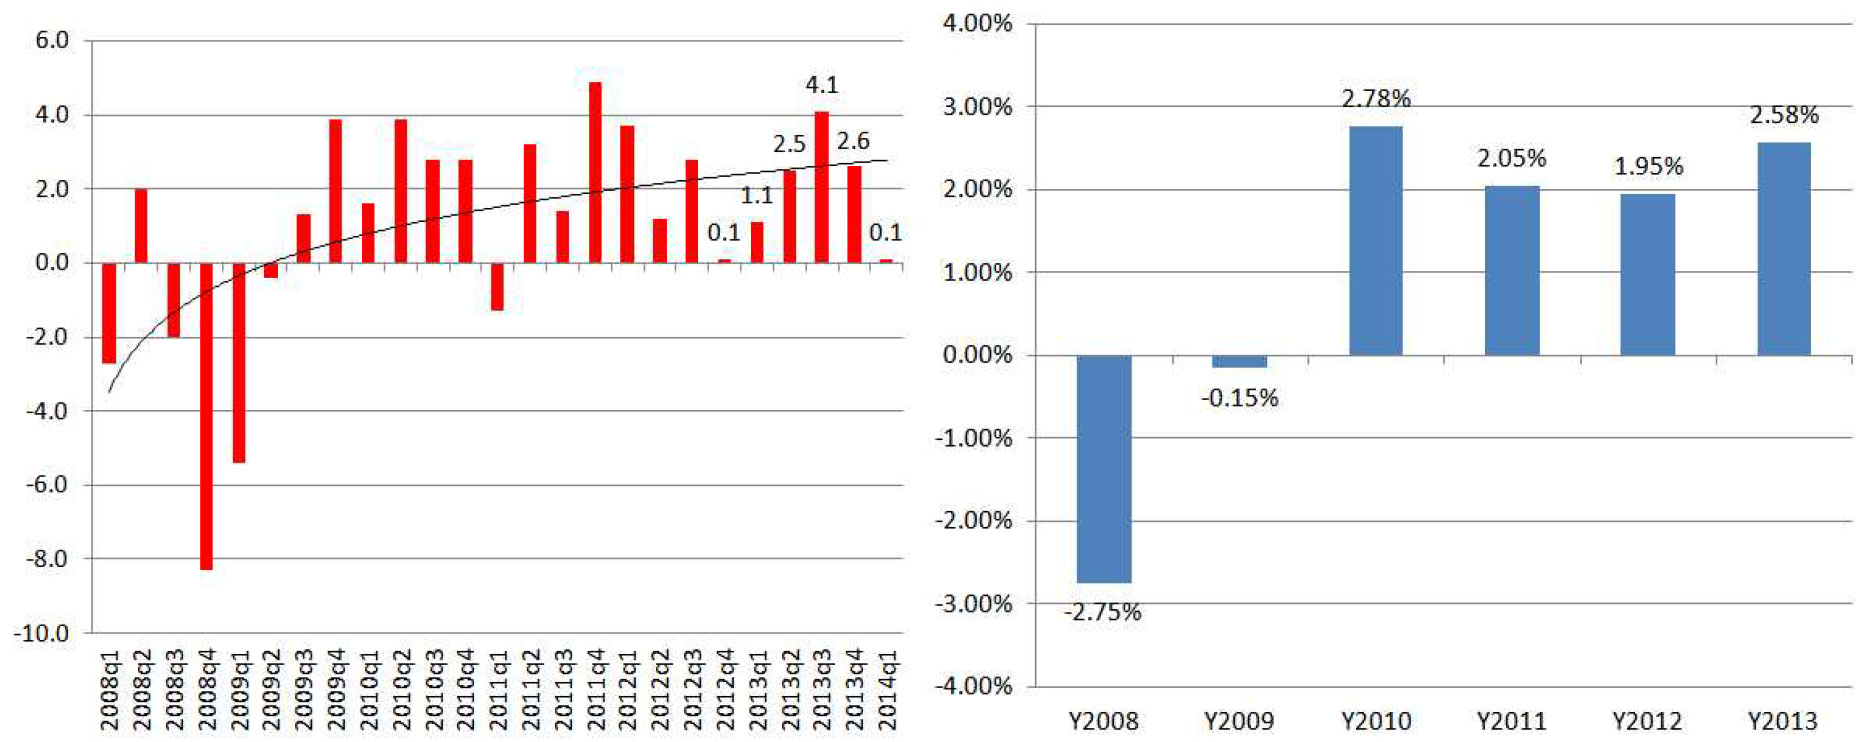
First, the FOMC’s current outlook for the US economy is to continue with moderate growth. The quarterly real GDP change since the first quarter of 2008 is shown in red below. The real GDP for 2013 is 2.58%. This continues the post Great Recession trend of sub-normal growth. The Federal Reserve is looking for a 3.5% or better year-on-year real GDP growth.
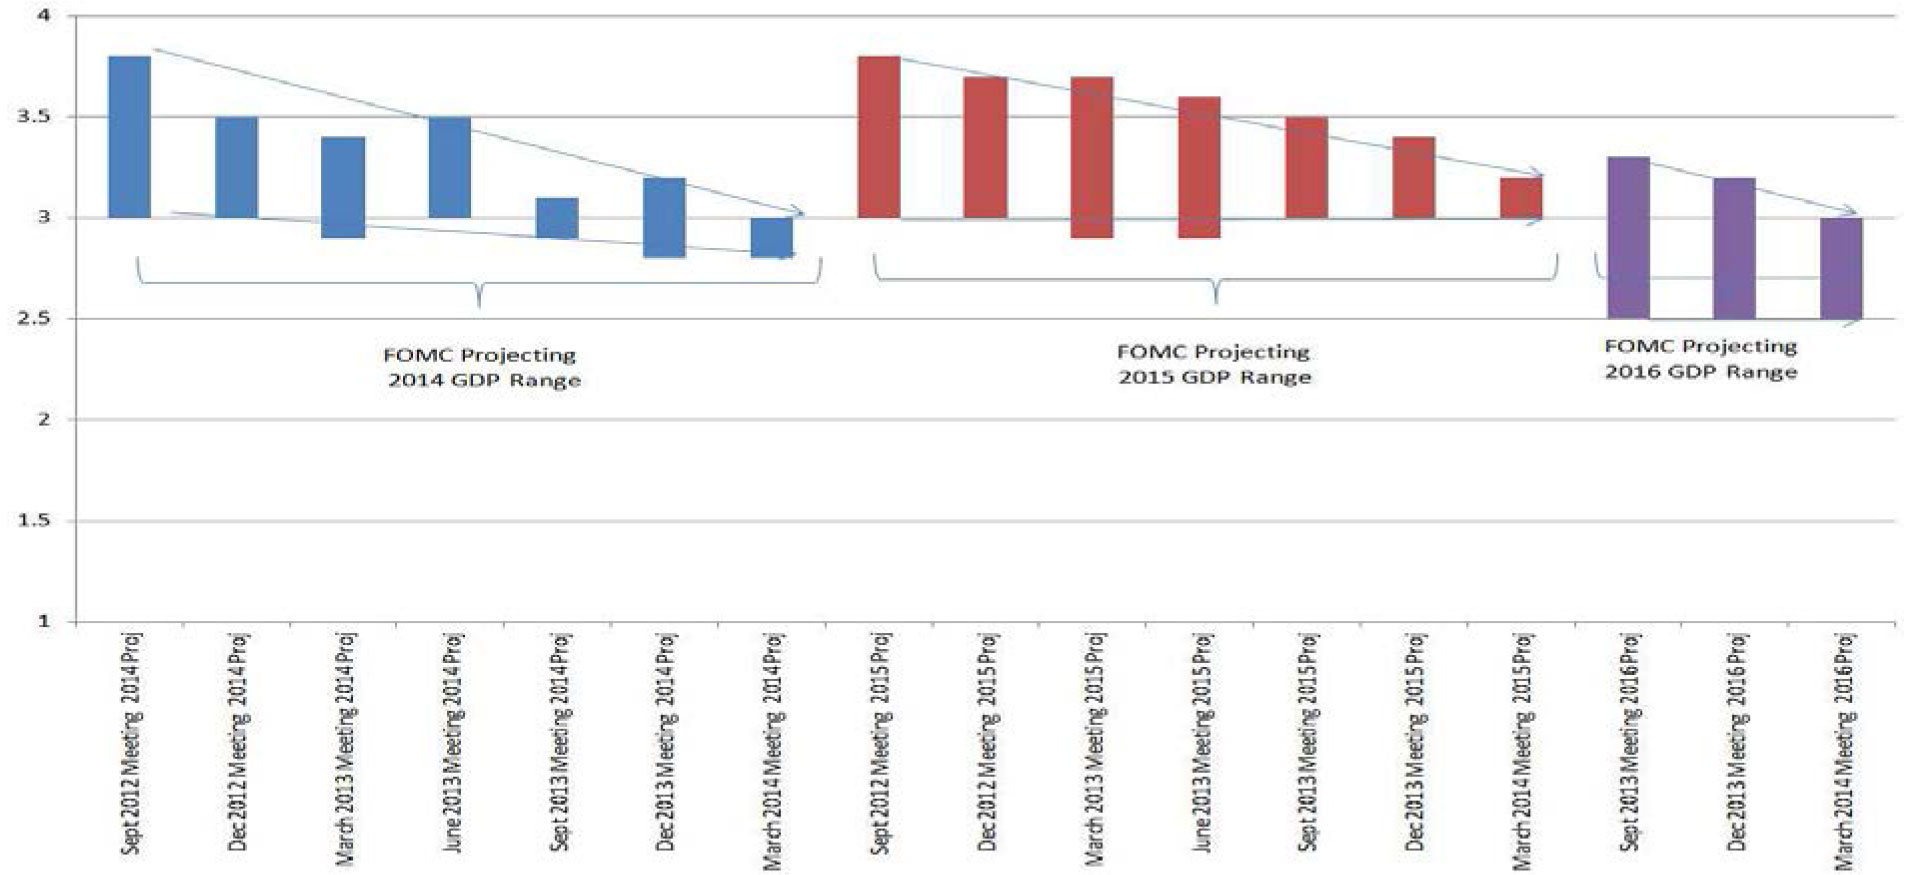
Information about Committee participants’ estimates of the longer-run normal rates of output growth and unemployment is published four times per year in the FOMC’s Summary of Economic Projections. Each member’s forward-looking projections regarding GDP, unemployment and PCE inflation show the variance among the views of the members. Armed with this historical set of forward-looking assumptions, one can begin to learn about the view of FOMC regarding each of the three data sets and how policy decisions are shaped from such views. The following graph summarizes the range of projections (excluding the outliers – highest and the lowest projection during each meeting) for 2014, 2015 and 2016 GDP since the September 2012 FOMC meeting. Obviously any divergence in members’ views narrows as the projection year gets closer and a consensus view is developed. For example, during the September 2012 FOMC meeting, the highest projected GDP for 2014 was 3.8% and the lowest was 3%. The highest projection was 3% and the lowest was 2.8% during the March 2014 FOMC meeting for 2014.
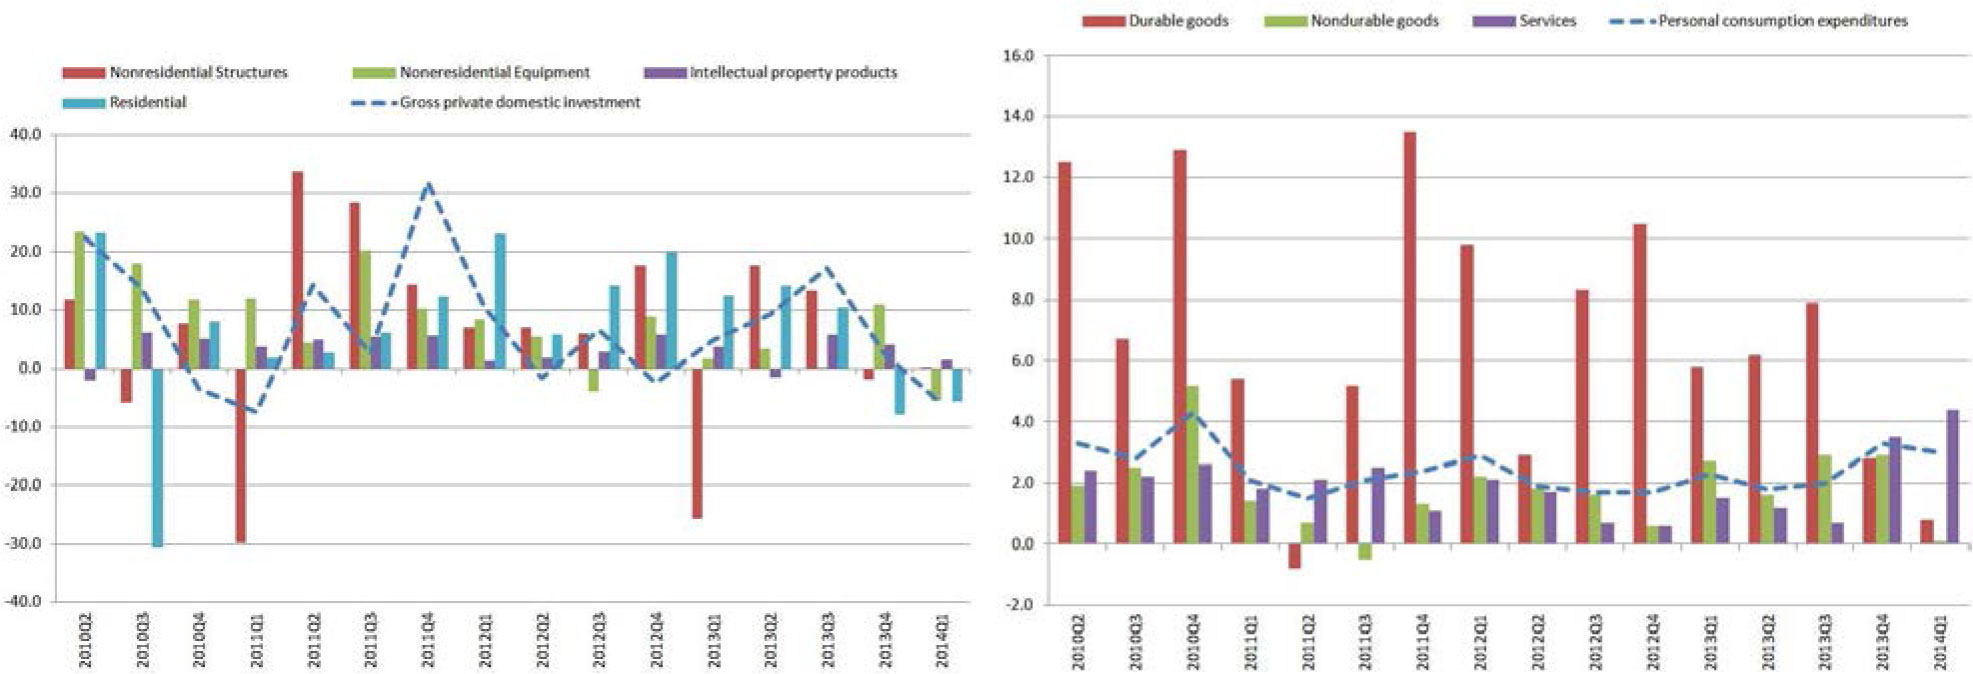
The Bureau of Economic Analysis announced today that the real GDP for the first quarter 2014 was 0.1%1 . The harsh and extended winter season is the most often cited contributing factor to this barely expanding number. The following graph summarizes the performance of the major components to the GDP since the second quarter of 2010.

After 4 quarters of positive to significantly positive contribution by private domestic investment, it was the largest detractor to the GDP. Import and export both detracted as well as government consumption. The bright spot remains personal consumption. The following two graphs show the underlying constituents to the negative private domestic investment and the positive personal consumption.
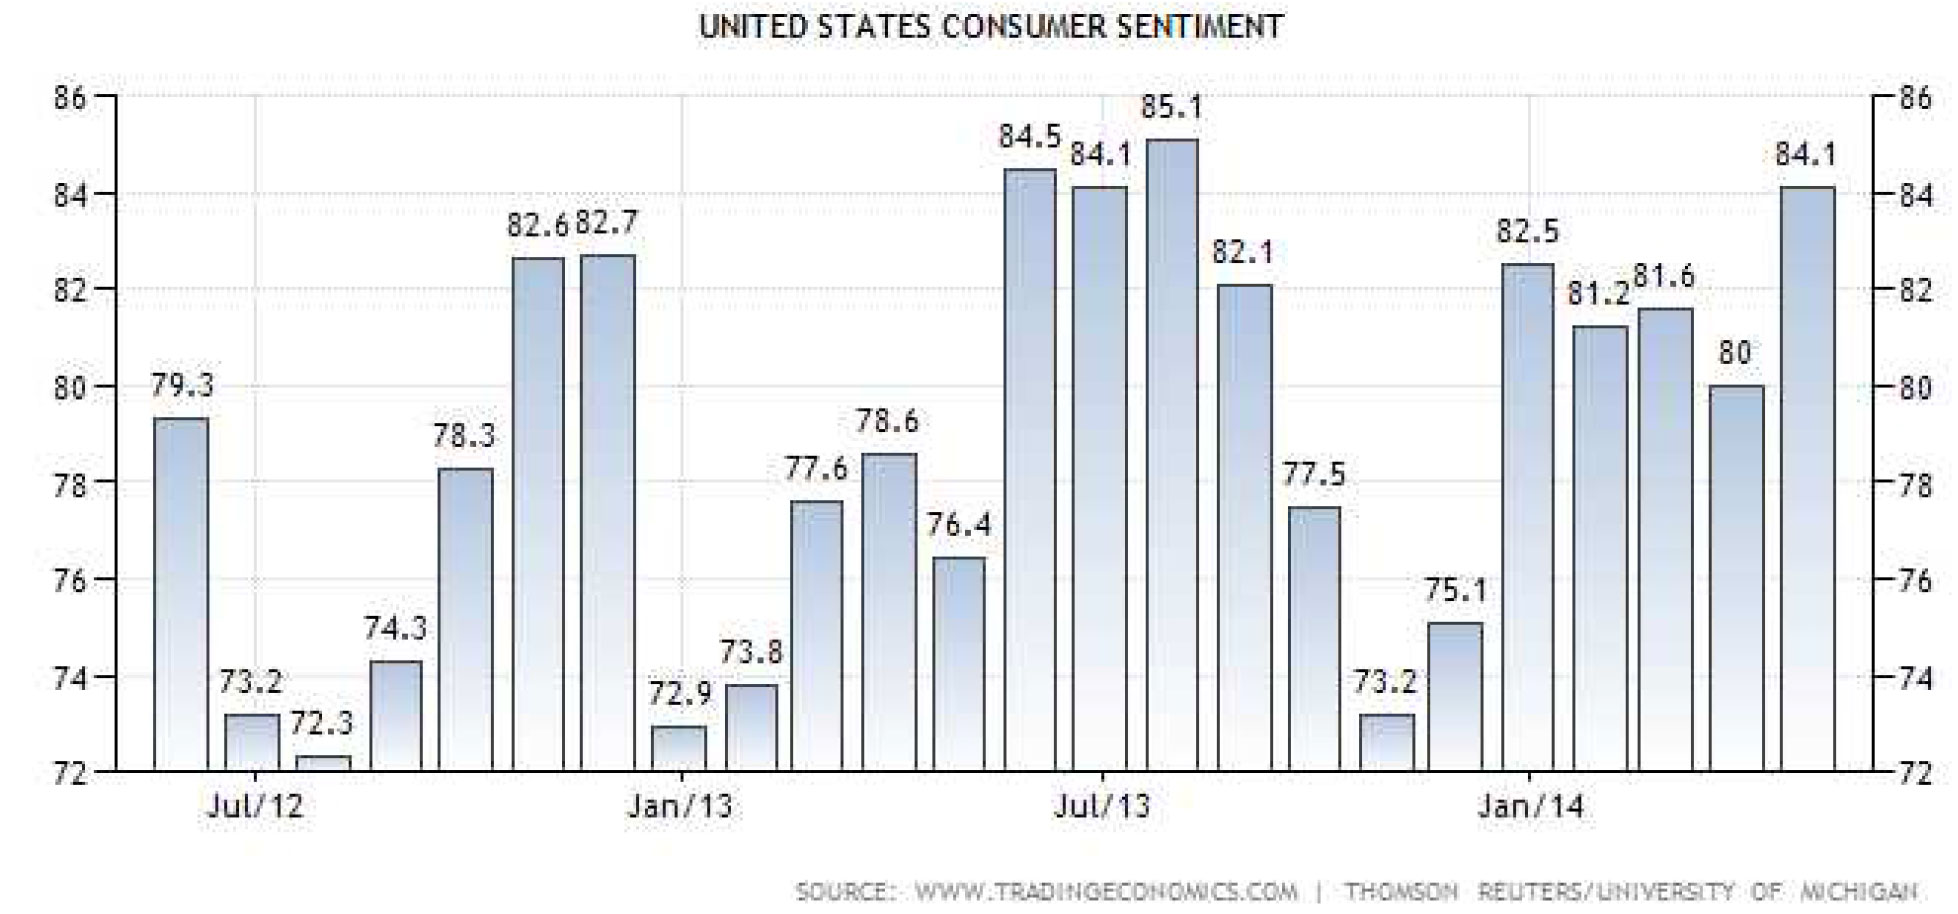
The data supports the positive consumer sentiment from the monthly University of Michigan survey below:
Although the first quarter GDP is disappointing (a low GDP number is widely expected), it does not indicate the beginning of a trend. With two thirds of the economy driven by consumers, it is critical to follow factors contributing to their confidence. With an accommodating Federal Reserve, residential real estate is likely to continue its recovery and the risk assets (such as the stock market) continue to do well. As more people find jobs, this will also add confidence to the overall economy. These factors are the drivers to an expanding recovery.
Labor Picture
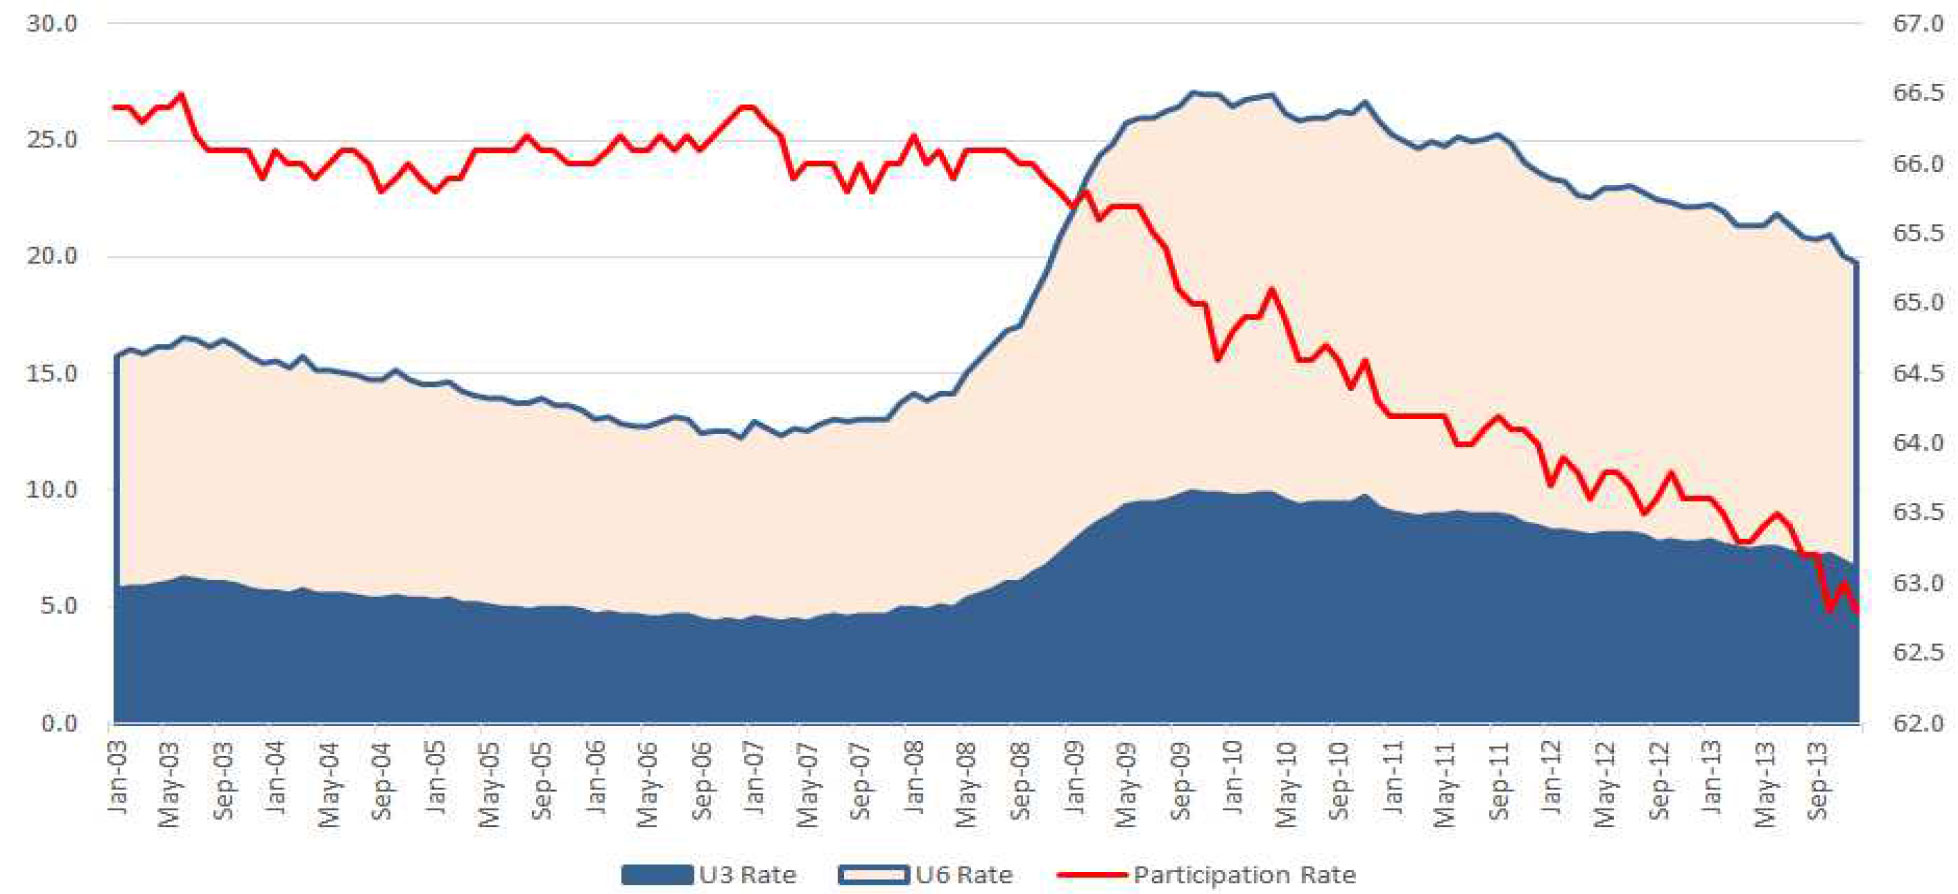
Chairman Yellen cited the continuing improvement in the labor market with the unemployment rate (U3) falling 0.3% over the past year, and the broader U6 rate, which captures the marginally attached workers, has improved. She recognized that the labor participation rate has also fallen, but there is little question that the economy has remained far from maximum employment.
According to the January 28, 2014, FOMC’s Statement on Longer-Run Goals and Monetary Policy Strategy2 , “[t]he maximum level of employment is largely determined by nonmonetary factors that affect the structure and dynamics of the labor market. These factors may change over time and may not be directly measurable. Consequently, it would not be appropriate to specify a fixed goal for employment; rather, the Committee’s policy decisions must be informed by assessments of the maximum level of employment, recognizing that such assessments are necessarily uncertain and subject to revision. The Committee considers a wide range of indicators in making these assessments.” This statement changes the previous FOMC forward guidance position of a targeted U3 benchmark of 5.2% to 5.6% longer-run “normal unemployment rate” to a more flexible, facts on the ground approach regarding the timing for raising interest rates.
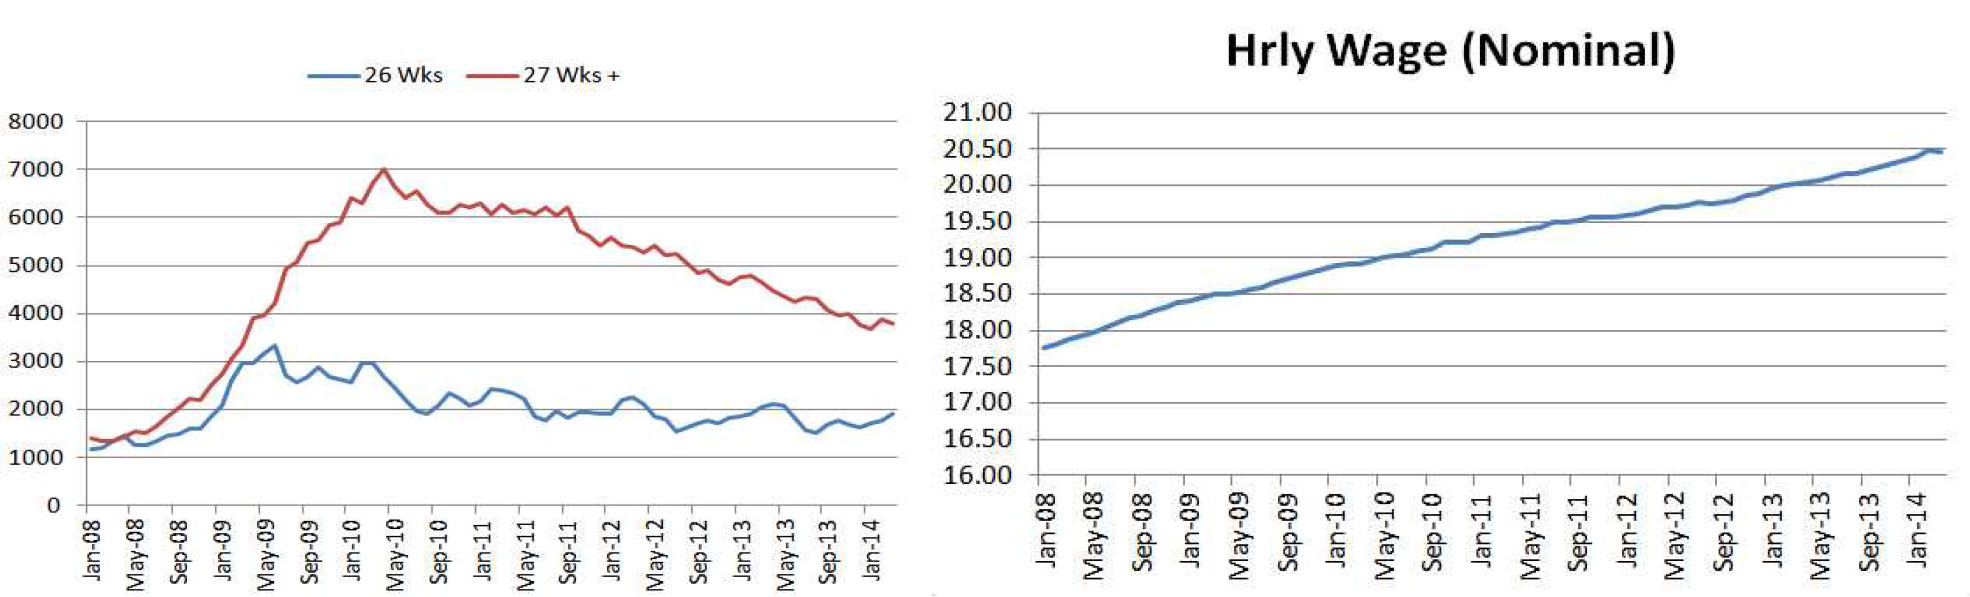
Chairman Yellen pointed to a number of indicators which the FOMC monitors to see if there is labor market slack (defined as the shortfall in employment relative to its mandate-consistent level), specifically: U3, U6, long-term unemployed (individuals looking for work for more than 6 months), labor force participation, and wage pressures. The graphs on the following page show that, although there are continuing improvements in almost all these indicators, there is no doubt that slack exists and persists.
Additional evidence of a slow labor market recovery comes from the Department of Labor. In the week ending April 19, 2014, the advance figure for seasonally adjusted initial claims was 329,000, an increase of 24,000 from the previous week’s revised level. The previous week’s level was revised up by 1,000 from 304,000 to 305,000. The 4-week moving average was 316,750, an increase of 4,750 from the previous week’s unrevised average of 312,000.
The generally accepted monthly new job creation in order to absorb the population growth rate in the labor force is 125,000. This means that, if only 125,000 jobs are created each month, the unemployment number would remain unchanged if the participation rate remains steady. Total nonfarm payroll employment rose by 192,000 in March with job growth averaging 183,000 per month over the prior 12 months, according to the Bureau of Labor Statistics April 4th Employment Situation Summary. Although the monthly 183,000 average job creation shows progress, it is insufficient to bring the economy to full employment.
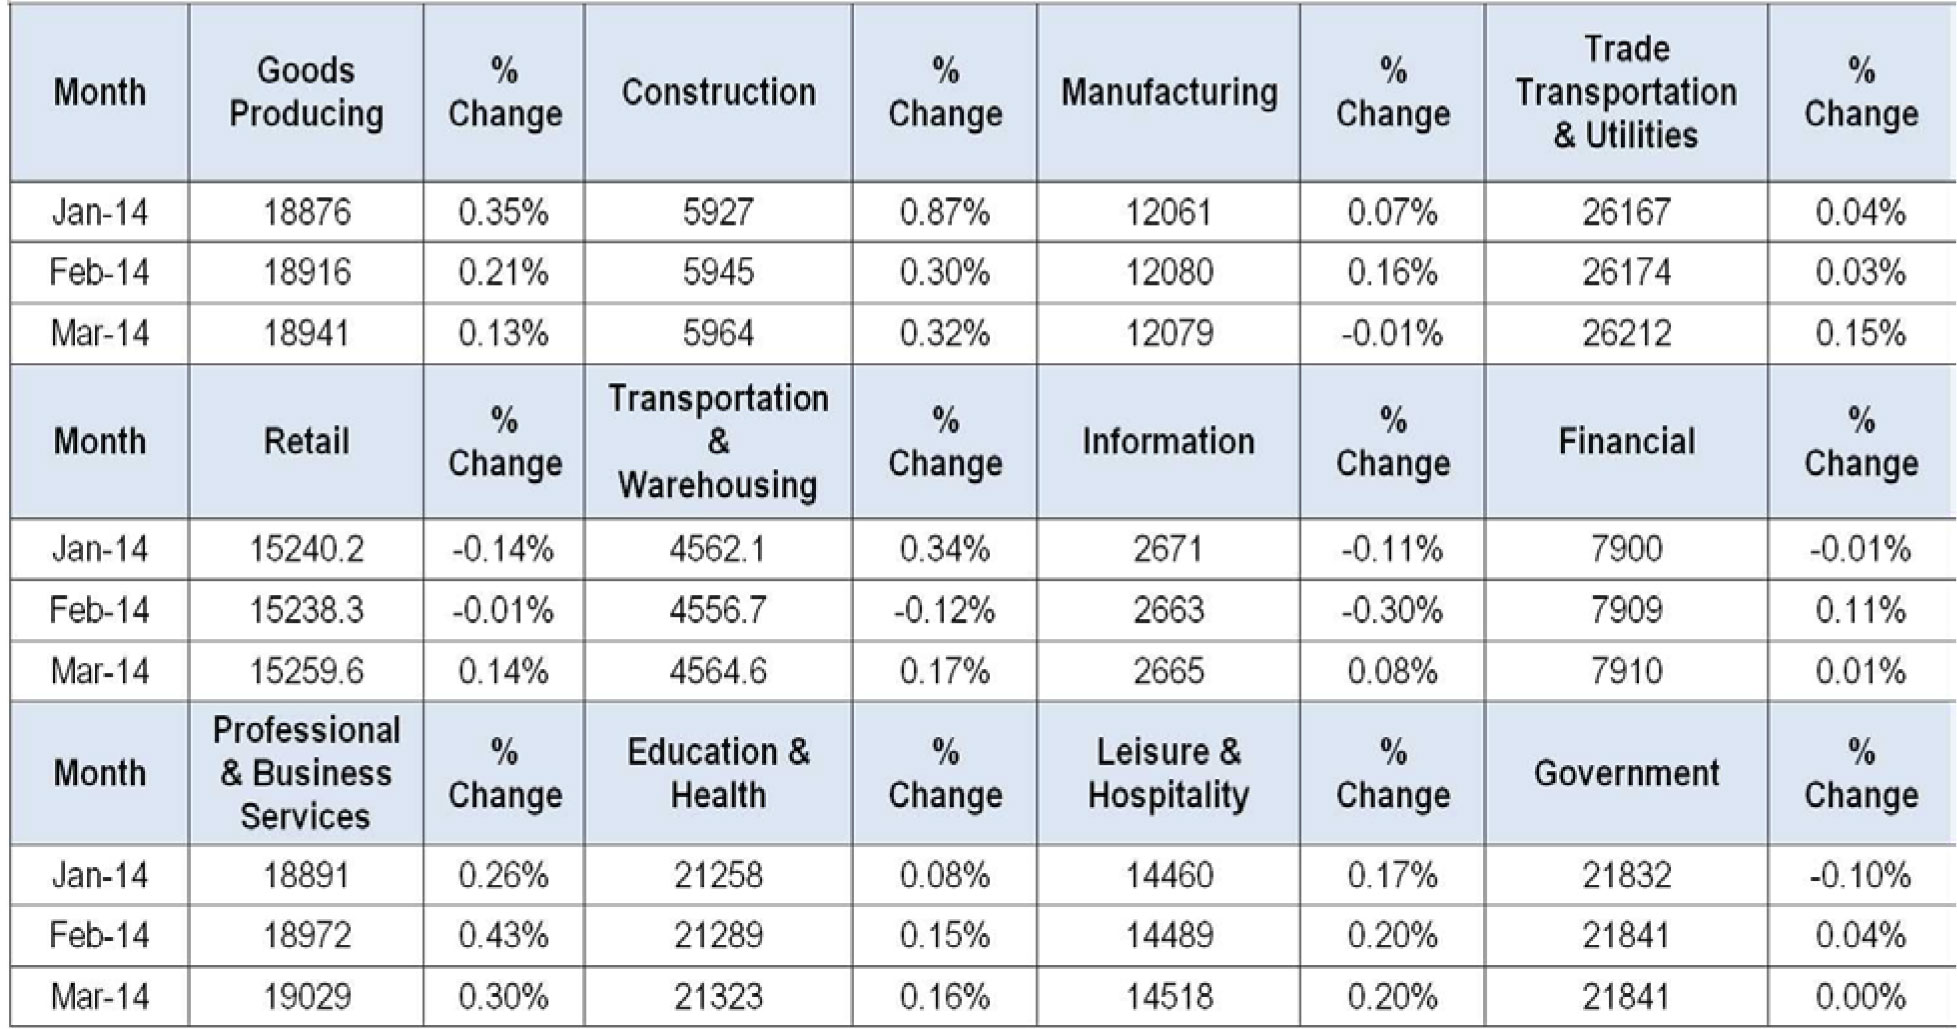
The following table shows where the job gains have been since January this year, according to the latest data from the Bureau of Labor Statistics. The number (x1000) represents the total employees on nonfarm payrolls by industry sector (seasonally adjusted) – http://www.bls.gov/news.release/empsit.t17.htm
Inflation
The FOMC has targeted 2% as the long run benchmark for inflation. Anchoring long-term inflation is an important objective of the Federal Reserve and the Federal Reserve is concerned with:
- Inflation persistently below 2% could pose risks to the general economy,
- Inflation persistently below 2% increases the “real” burden of debt for households and firms which places further drag on the general economy, and
- Inflation at rates far below 2% could easily push the economy into deflation.
Chairman Yellen is hopeful that the labor market slack diminishes, resulting in less drag on inflation (with wage growth etc.) and the psychological anchoring of 2% inflation rate is well established and should provide a natural pull back to that level. There are a number of indicators in measuring inflation. Although none of the methods are perfect, the most common is Consumer Price Index3 . The headline CPI includes the volatile sectors of food and energy, and the core CPI does not. Removing the volatile categories of food and energy provides a more stable look at inflation over time.
The other indicator is the Personal Consumption Expenditures (PCE). This is the primary measure of consumer spending on goods and services in the U.S. economy. The FOMC focuses on PCE inflation in its quarterly economic projections and also states its longer-run inflation goal in terms of headline PCE. This index is constructed from a formula that reflects the changing composition of spending and thereby avoids some of the upward bias associated with the fixed weighted nature of CPI. The weights are based on a more comprehensive measure of expenditures. Also, historical data used in PCE price index can be revised to account for newly available information and for improvements in measurement techniques, including those that affect source data from the CPI. This results in a more consistent series over time. (https://www.bea.gov/national/pdf/NIPAhandbookch5.pdf)
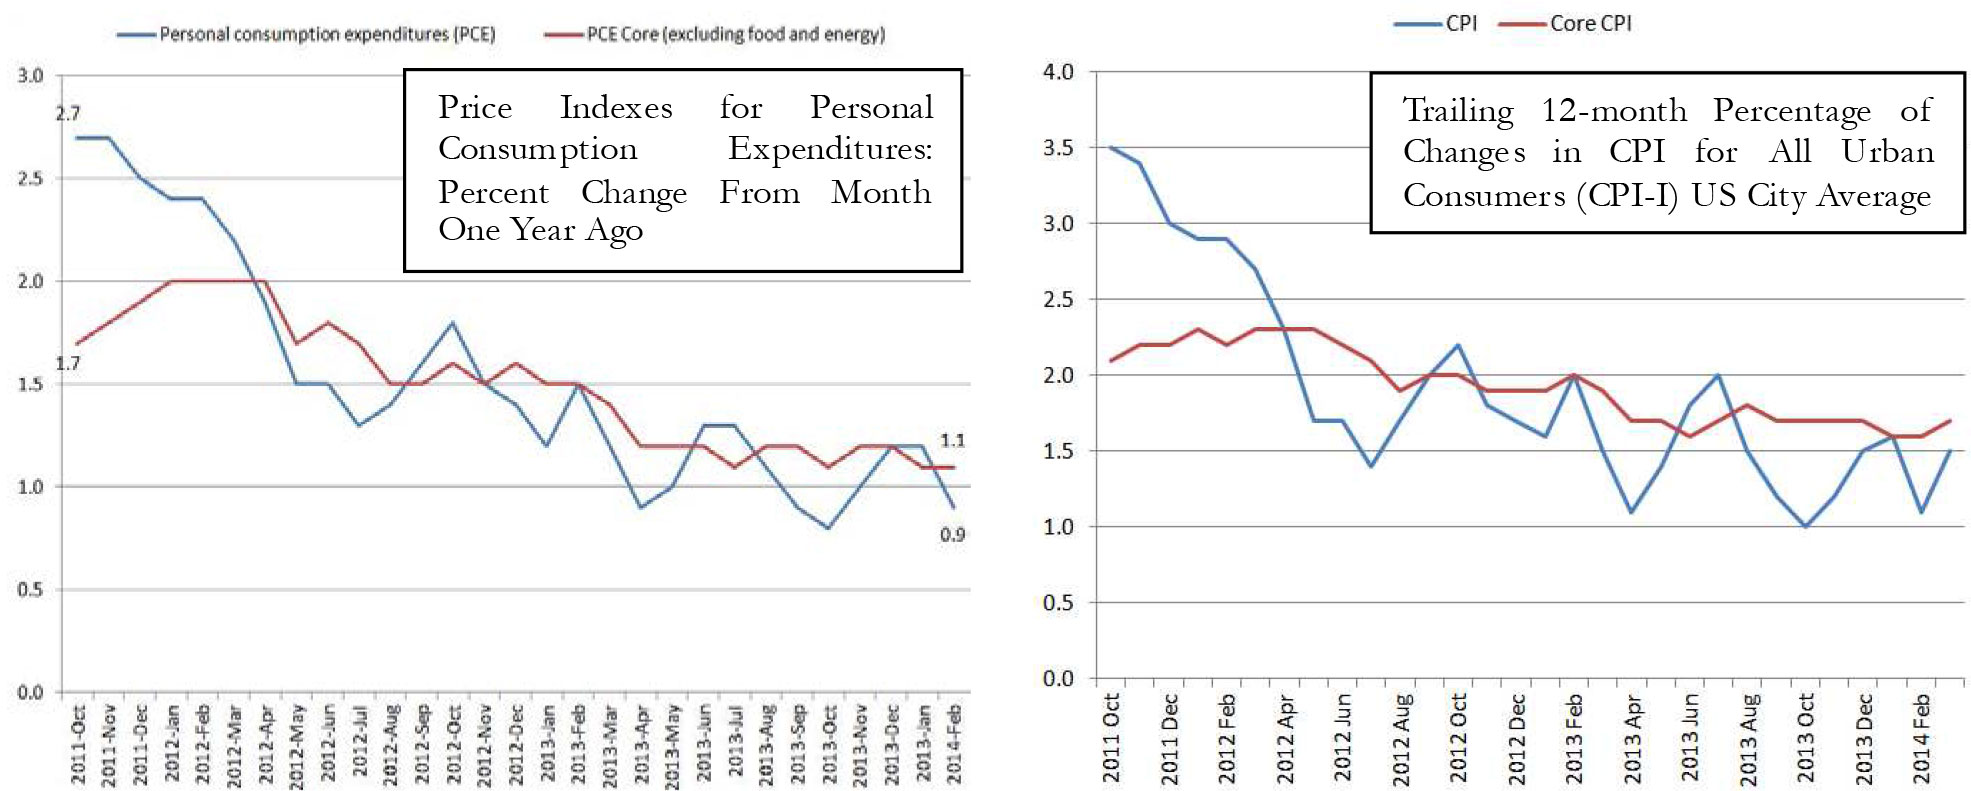
Clearly, both the headline CPI and Core CPI as well as the headline PCE and Core PCE are trending downwards. The following graph shows the projection for inflation during the past 7 FOMC meetings. The trend is definitively downwards. This does not necessarily mean that the FOMC believes we are at risk of deflation but certainly meeting the inflationary target of 2% is being more challenged.
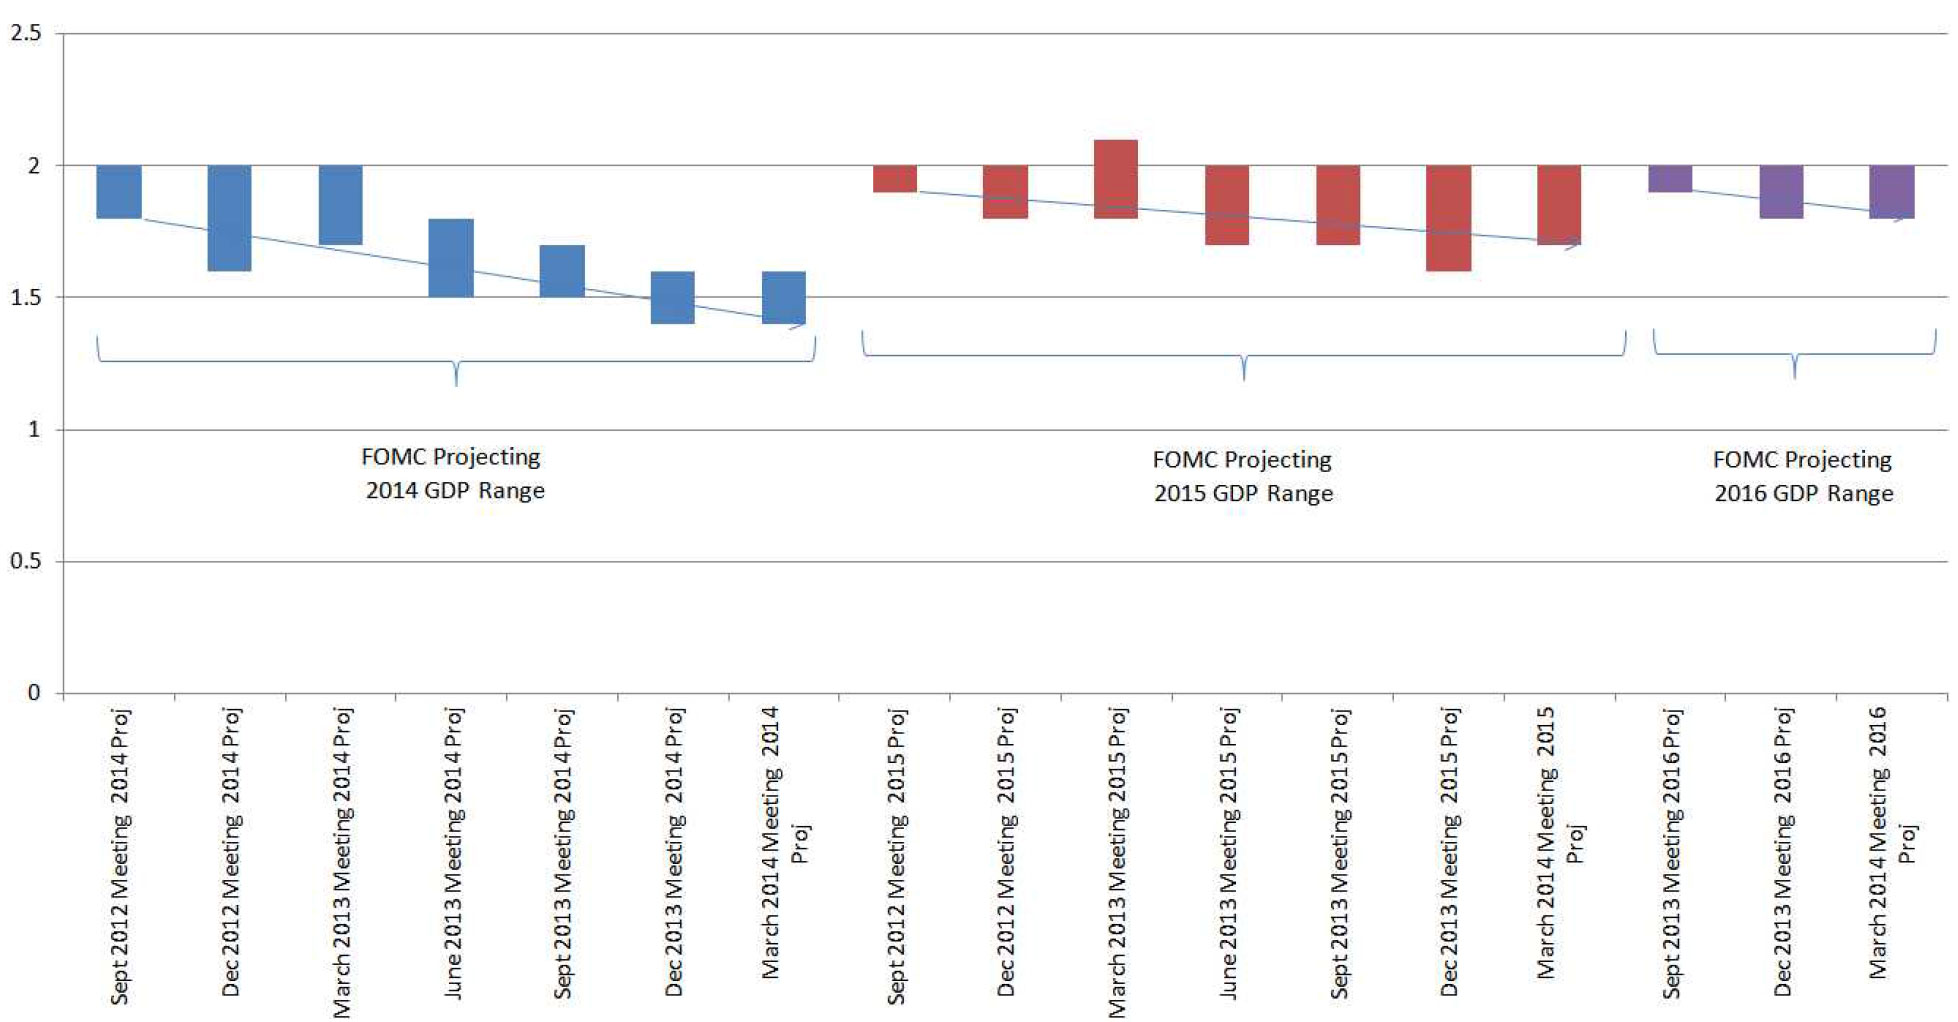
Although the high end of the range remains at 2%, the average among each projection is lower to much lower than the target 2% inflation rate over time. As long as inflation is in check or below the target, FOMC is given more room to continue experimenting with monetary policies without added pressure to tighten.
The Russians are Restless
Crimea, an autonomous republic within Ukraine, voted overwhelmingly to secede from Ukraine and rejoin Russia in a referendum on March 16th. The quick and decisive annexation of Crimea by Russia displayed the impotence of the European Union filled with conflicts of interest and the hopes of pacification of a bully by the rest of the world. The world stock market has not reacted at all to the continuing Russian aggression, suggesting that the Western economic sanctions are believed to be sufficient to contain the expansion-minded Putin. Polls have pointed out that Russians are very supportive of the actions in Crimea and the ongoing border tension with Ukraine. Russians believe that the ousting of the pro-Russia president, Viktor Yanukovych, in January was unconstitutional and posed threats to ethnic Russians in Ukraine. Moreover, many Russians believe that Crimea should have never been given to Ukraine during the fall of the Soviet Empire and viewed Ukraine as an extension of Russia. Putin and the Russians look at this geographical expansion as both their right and the restoration of their rightful position in the world.
The European Union (EU) and Ukraine operate under the Partnership and Co-operation Agreement (PCA) since 1998 and agreed at the 2008 Paris Summit that an Association Agreement would serve as the successor agreement. Since then, the EU and Ukraine have looked to formalize an Association Agreement. This is the first agreement based on political association between the EU and any of the Eastern Partnership4 countries. The key parts focus on support to core reforms, economic recovery and growth, and governance and sector cooperation in areas such as energy, transport and environment protection, industrial cooperation, social development and protection, equal rights, consumer protection, education, youth, and cultural cooperation. The Agreement also puts a strong emphasis on values and principles: democracy and the rule of law, respect for human rights and fundamental freedoms, good governance, a market economy and sustainable development. At the same time, Putin is organizing an economic bloc known as the Eurasian Union, with Ukraine, Kazakhstan and Belarus. The members of this customs union set trade policy through the establishment of common foreign tariffs. Ukraine’s consideration for the EU Association Agreement would be incompatible, even though Russia and Ukraine already have a free-trade agreement via the Commonwealth of Independent States free-trade agreement5 signed in October 2011.
On April 17th, the US-led negotiation resulted in an agreement that all parties, including separatists and their Russian backers, would stop violent and provocative acts and all illegal groups would be disarmed. Russia agreed that, if the terms of the agreement are strictly observed, the thousands of Russian troops at the eastern and southern borders of Ukraine will dissipate. Yesterday, the U.S. strengthened its economic sanctions against Russia by targeting seven known allies of President Putin since the agreement was not adhered to and more Russian troops were sent to Ukraine. A national election in Ukraine is scheduled in May, and the world (naively) hopes that a newly elected democratic president will make a difference.
Economically, Ukraine’s geographic position serves as a transit point for 80% of Russian gas, of which roughly 25% represents the EU’s natural gas supply. Russia also relies on Ukraine for steel and agriculture. Militarily, Ukraine borders between Russia and Europe, and the Ukrainian city of Sevastopol is the headquarters for Russia’s Black Sea Fleet. Further, its proximity to Russia’s own breadbasket and economic heartland in the Volga region make it key to Russia’s geopolitical strength. A strong Ukrainian ally protects and grants Moscow strength and comfort when dealing with Europe.
According to the HSBC PMI survey data compiled by Markit6 , Russia’s private sector economy registered a contraction in March and activities declined at the strongest rate since August 2010.
“Russia Composite Output Index fell to a near five year low of 47.8 in March, from 50.2 in February. This reflected the first drop in services activity in eight months, and a third successive monthly decline in manufacturing production. Over the first quarter as a whole the Index trended at 49.2, the lowest quarterly average since Q2 2009.”
Capital outflow in the first quarter this year was $50.6 billion as compared with a 2013 total of $63 billion. The Russian currency has lost 7.7% this year against the dollar, the second-worst performance among 24 emerging market currencies tracked by Bloomberg. Standard & Poor’s cut the nation’s sovereign-debt rating to one level above junk.
It is reasonable to suggest that the annexation of Crimea and the dispute in Eastern Ukraine are rooted in fear, greed, control and power. These traits cannot be easily satiated through trade sanctions or even necessarily peaceful means. The slowing of the Russian economy at the end of last year is further aggravated by the increasing economic sanctions imposed by the EU and the US. However, this may add more fuel to the Putin fire. The continuing downturn of Russian domestic economy and the increasing inflationary pressure create a perfect time for a war to distract the Russians. Thus far the fallout has been contained, but it can quickly spread to the EU and ultimately to the rest of the world and the US. If Russia uses countertrade sanctions measured by cutting off or significantly increasing the cost of gas and energy to the EU countries over a prolonged period of time, it will definitely derail the nascent economic recovery in the eurozone. This is a tail risk to the market that could initiate a risk-off environment with significant rippling effects globally. Although this is not our base case, the probability is increasing.
What Do We See?
For the US, we expect the FOMC to continue its $10 billion per month tampering pace and bring the QE purchases to an end by the last quarter this year. Based on the parameters the FOMC uses in making policy decisions, it shows that the US economic recovery continues and is speeding up somewhat but there is still slack in the labor market. The slack in the economy and the labor market is keeping the inflation rate (headline or core, measured in CPI or PCE) below the Federal Reserve target of 2%. This further suggests that, at the current trajectory, there is no rush for the FOMC to alter its policy and to raise rates in the near future.
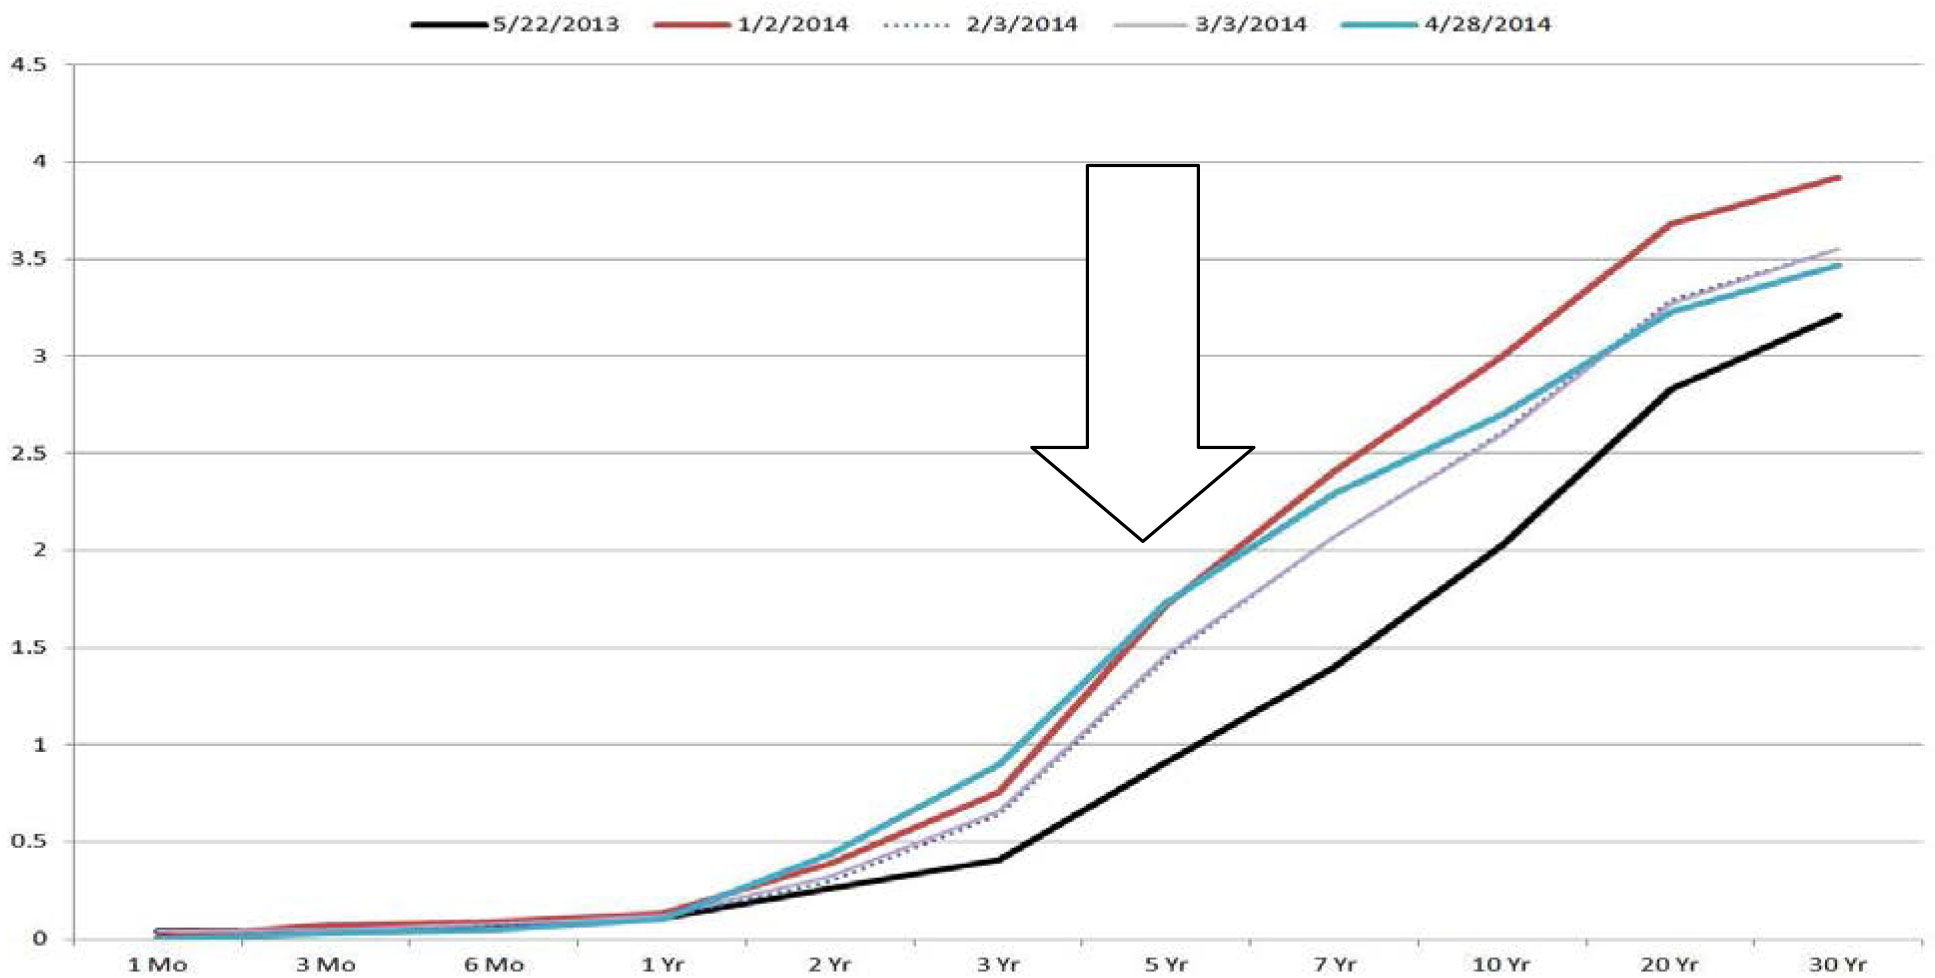
The yield curve has not changed much since the beginning of 2014. Since the May 2013 taper frenzy, the rates have moved up decisively. Since then, the longer rates have retreated. From the time series graph below, it is clear that the most impacted segment of the yield curve from the base line date of May 22, 2013, is the 5 to 7 year range.
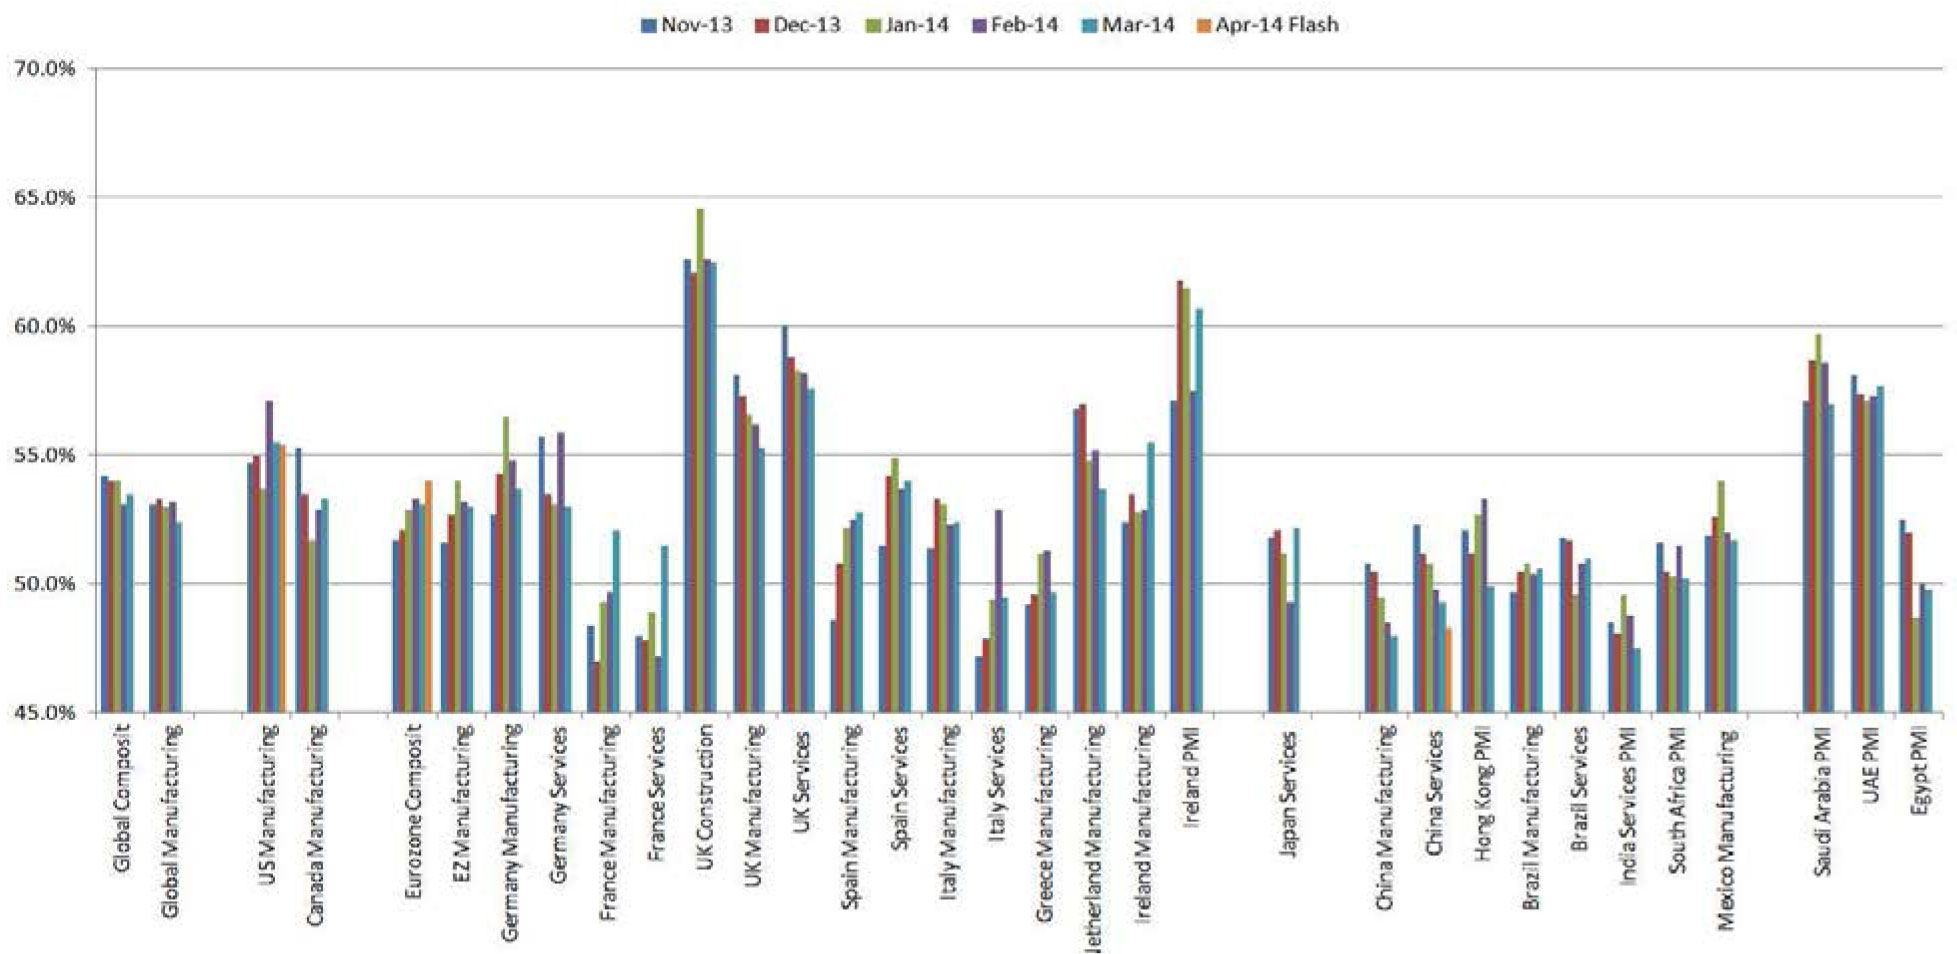
For Europe, the fragile recovery remains intact. The following graph shows the Purchasing Manager Index data, according to Markit research, that almost all eurozone economies remain expansionary (above 50). However, all indicators suggest that the eurozone economy remains week, and with almost a 12% average unemployment rate, aggregate demand remains challenged. Furthermore, the European Central Bank (ECB) is concerned about disinflation and deflation. There is an increasing chance that the ECB will lower their rates and impose a negative interest rate for savings to spur growth and risk taking. Furthermore, the ECB is ready for its version of quantitative easing to fight against deflation risk.
For emerging market and developing economies, the story is more complicated. The external and internal factors affect different countries differently. Those that depend on foreign capital and operate at a negative current account are most affected by FOMC tapering and the ultimate rise of rates. This is a period of adjustment and realignment to balance inflation, currency, interest rates, monetary, fiscal and political risks in a slowing or low growth reality. In the short term, emerging markets remain a difficult place to invest. This is further compounded by the increasing uncertainty in Ukraine.
In conclusion, the US is to continue its protracted economic expansion/recovery. We expect the US GDP to pick up from here and to end the year at 3% or more. The fiscal and policy uncertainty that plagued the US economy are behind us. The handoff from the public sector (stimulative fiscal and monetary policies) to the private sector should remain on track and successful. Although it is most unlikely that the stock market will repeat its 2013 performance this year, the US stock market should continue to do well, but at increased volatility. Developed Europe equities remain favorable, and they are even more favorable if ECB lowers rates and implements large scale asset purchase programs. This will push down the euro and make the eurozone more competitive and drive growth faster. Finally, we have not witnessed a 10% correction or pull back in the market for a long time, and when it happens, more buying opportunities would present themselves. For long-term investors who are willing to sustain a high level of volatility, emerging market equities present great opportunities.
This quarterly commentary is strictly informational and should not be perceived as Chao & Company, Ltd. providing investment consulting or advice. Recipients should not rely on any portion of this content in making any investment or financial related decisions.
- http://www.bea.gov/newsreleases/national/gdp/gdpnewsrelease.htm
- http://federalreserve.gov/monetarypolicy/files/FOMC_LongerRunGoals.pdf
- The Consumer Price Index (CPI) is a set of monthly data representing changes in the prices paid by urban consumers for a representative basket of goods and services. The CPI market basket is developed from detailed expenditure information provided by families and individuals on what they actually bought. For the current CPI, this information was collected from the Consumer Expenditure Surveys for 2009 and 2010. In each of those years, about 7,000 families from around the country provided information each quarter on their spending habits in the interview survey. To collect information on frequently purchased items, such as food and personal care products, another 7,000 families in each of these years kept diaries listing everything they bought during a 2-week period. Over the 2 year period, then, expenditure information came from approximately 28,000 weekly diaries and 60,000 quarterly interviews used to determine the importance, or weight, of the more than 200 item categories in the CPI index structure. (http://stats.bls.gov/cpi/cpifaq.htm#Question_1)
- Launched in 2009, the Eastern Partnership is a joint initiative between the EU, EU countries and the eastern European partner countries. It enables partner countries interested in moving towards the EU and increasing political, economic and cultural links to do so. http://eeas.europa.eu/eastern/docs/eap_vilnius_ppt_201113_en.pdf
- http://www.worldtradelaw.net/fta/agreements/cisfta.pdf
- http://www.markiteconomics.com/Survey/PressRelease.mvc/3a8f0a0dfae0413fb54ad2e474630b4e